Paper Menu >>
Journal Menu >>
 Journal of Mi nerals & Materials Characteriza tion & Engineering, Vol. 9, No.9, pp.787-794, 2010 jmmce.org Printed in t he USA. All rights reserved 787 Effect of Heat Treatment on Fe–0.3%P–0.14%C Alloy Yashwant Mehta1*, K. Chandra2, Rajinder Ambardar1 & P. S. Mishra2 1Department of Metallurgical Engineering, National Institute of Technology, Srinagar, Hazratbal, Srinagar, J & K– 190006, India 2Department of Metallurgical and Materials Engineering, Indian Institute of Technology, Roorkee, Roorkee, Uttarakhand -247667, India *Corresponding Author: yashwant.mehta@gmail.com ABSTRACT Modern iron and steel industry is based on the iron – carbon diagram. However, a major problem associated with Fe-C alloys is that they corrode and cause losses to the tune of 5% of GDP to the world. Ancient Indian iron (Fe-P-C) artifacts like the Delhi Iron Pillar have withstood atmospheric corro sion for about 1600 years. Phosphoro us and carbon are used as the alloying elements for strengthening iron and imparting corrosion resistance to it. Therefore, there is a need to understand the Iron-Phosphorous-Carbon alloy system and to develop strong and corrosion resistant, iron products. In the present study, Fe-0.3%P- 0.14%C alloy is subjected to heat treatment schedule by varying the rate of cooling after 30 minutes of heating at 800 oC. Microstructural characterization is carried out on the heat treatment samples. The studies reveal a higher concentration of carbides in the form of pearlite formed at the grain boundaries of the ferrite grains in the air cooled samples. As per the literature, carbon pushes phosphorous from the grain boundaries to the grain interior by site competition. Micro-hardness studies on the test samples indicate that hardness of the phases formed at the grain boundaries is higher as compared to the hardness of the interior of the ferritic grains. Keywords: Phosphoric Iron, Microhardness, Microstructure, Heat treatment. 1. INTRODUCTION Ancient and medieval India has made a tremendous i mpact on the world scene through many spectacular achievements in iron and steel technology. An exemplary monument of those times is the Delhi Iron Pillar s tanding at Mehrauli village, near Qutab Minar, on the outskirts of Delhi. The Delhi pillar has long evoked the curiosity of metallurgists, particularly for its  788 Y. Mehta, K. Chandra, R. Ambardar & P. S. Mishra Vol.9, No.9 large size and excellent state of corrosion resistance. The composition of the pillar iron is comparable to that of low carbon steel and shows a wide range as C (0.03–0.28), Si (0.004– 0.056), and P (0.114–0.48) [1]. The enhanced cathodic reactions due to the presence of slag particles at the grain boundaries can lead to the formation of passive protective film of phosphate, possibly in the glassy amorphous state conferring, thereby, high corrosion resistance to the pillar [2]. The steps leading to the formation of the protective film include i) initial rust for mation, ii) increase in critical current density and the formation of the phosphate (FePO4) on the matrix, and finally iii) the extension of the phosphate film over the slag inclusions [3]. Ancient archaeological phosphoric irons, from several different parts of the world, containing between 0.05 to 0.5 wt.% phosphorus and levels of up to 1 wt.% have also been detected [2 & 4]. Phosphorus increases the yield strength, ultimate tensile strength and hardness, but decreases both elongation, and reduction in area at failure. Very high phosphorus contents promote brittle behaviour [5]. Phosphorus causes solid solution strengthening, of the same order as interstitial carbon and nitrogen [6]. It also results in marked work hardening in iron when cold worked [4]. Phosphorus at levels around 0.1 wt. % is known to improve the strength and deep drawability of sheet steel used for automotive applications. The carbon contents are maintained at < 0.01 wt. % to obtain high formability in this application [7 & 8]. Phosphoric irons can be easily hot forged [9] and also cold worked under suitable conditions, like low strain rates and with geometries that avoid stress concentration [5]. This has been explained partly to be due to stabilization of ferrite at high temperatures and the known fact that the hardness of ferrite drops rapidly below that of austenite at high temper atures [10]. Metallographic examination of a phosphoric iron, etched with nital, so metimes produces a watery shimmer or wrinkled appearance in the ferrite grains. If a phosphorous alloy which has been quenched from the dual phase ferrite – austenite region is etched with nital, distinct boundaries are visible at prior phase interfaces, and these are attribut ed to sharp changes in phosphoric content. Metallographic analysis of archaeological artifacts reve als that th e lines of the ghosting patterns correspond to local changes in phosphorous content [5]. When the Fe-P alloy is heated upto the duplex phase region, austenite starts forming. On cooling to room temperature, the austenite transforms to ferrite. As the rate of diffusion of phosphorous in austenite is less than that in ferrite, the kinetics of the diffusion controlled austenite - ferrite reaction in the dual phase region is slow as compared to the reverse reaction. Thus, the growth of ferrite from an austenite matrix is limited by the diffusion of phosphorous into the austenitic bulk. At slow cooling rates, the phosphorous inhomogeneity of the duplex microstructure is maintained. A very long heat treatment at a high temperature in the fully ferritic region results in homogenization of the structure [5]. In an attempt to determine the boundaries of the dual phase loop, Haughton quenched a series of iron phosphorous alloys after annealing at temperatures in the range of 900- 1050 oC. [11]. A short heat treatment in the dual phase range results in the formation of  Vol.9, No.9 Effect of Heat Treatment on Fe–0.3%P–0.14%C Alloy 789 needles of austenite and heating at a higher temperature promotes spheroidization of the austenite needles [12]. 2. EXPERIMENTAL PROCEDURE 2.1 Sample Preparation Melting of iron scrap was carried out in an induction furnace of 300 kg capacity. Ferro- phosphorous, graphite, ferro-silicon, and aluminum shots were added to the melt for alloying and de-oxidizing purposes. After melting, the molten metal was cast in a sand mould and allowed to cool for 48 hours. Subsequently, the risers and runners were cut off and the casting was subjected to rough grinding. The dimensions of the solidified plate casting were obtained were 400 mm × 400 mm × 40 mm. The casting was examined for any surface defects. The chemical composition of the casting is given in Table 1. The casting was cut vertically and perpendicular to the bottom of the casting into approximately 10 mm slices to prepare the specimens of requisite dimensions i.e. 8mm×8mm×10mm for the present study. Table 1: Chemical composition of the cast alloy Alloy P C Si Mn Cr Ni Al Cu W Fe Fe-0.3P- 0.14C 0.281 0.145 0.1820.206 0.15 0.026 0.0680.03 0.025 98.887 2.2 Heat Treatment Two sets of samples (each set comprising five samples) were subjected, separately, to a heat treatment schedule at 800 oC in a vertical tubular electr ical furnace for 30 minutes. After the heat treatment, the two sets of samples were subjected to two different rates of cooling i.e. water quench and air cooling. The details are given in Table 2. Table 2: Heat treatment schedule Sample type Temperature Time Rate of cooling Set 1 800 oC 30 minutes Water quench Set 2 800 oC 30 minutes Air cool 2.3 Metallographic Analysis Subsequently, the samples were prepared for metallographic analysis and microhardness evaluation. After final polishing, the samples were etched by using 2% NITAL and the micro-structural examination of the samples was carried out. 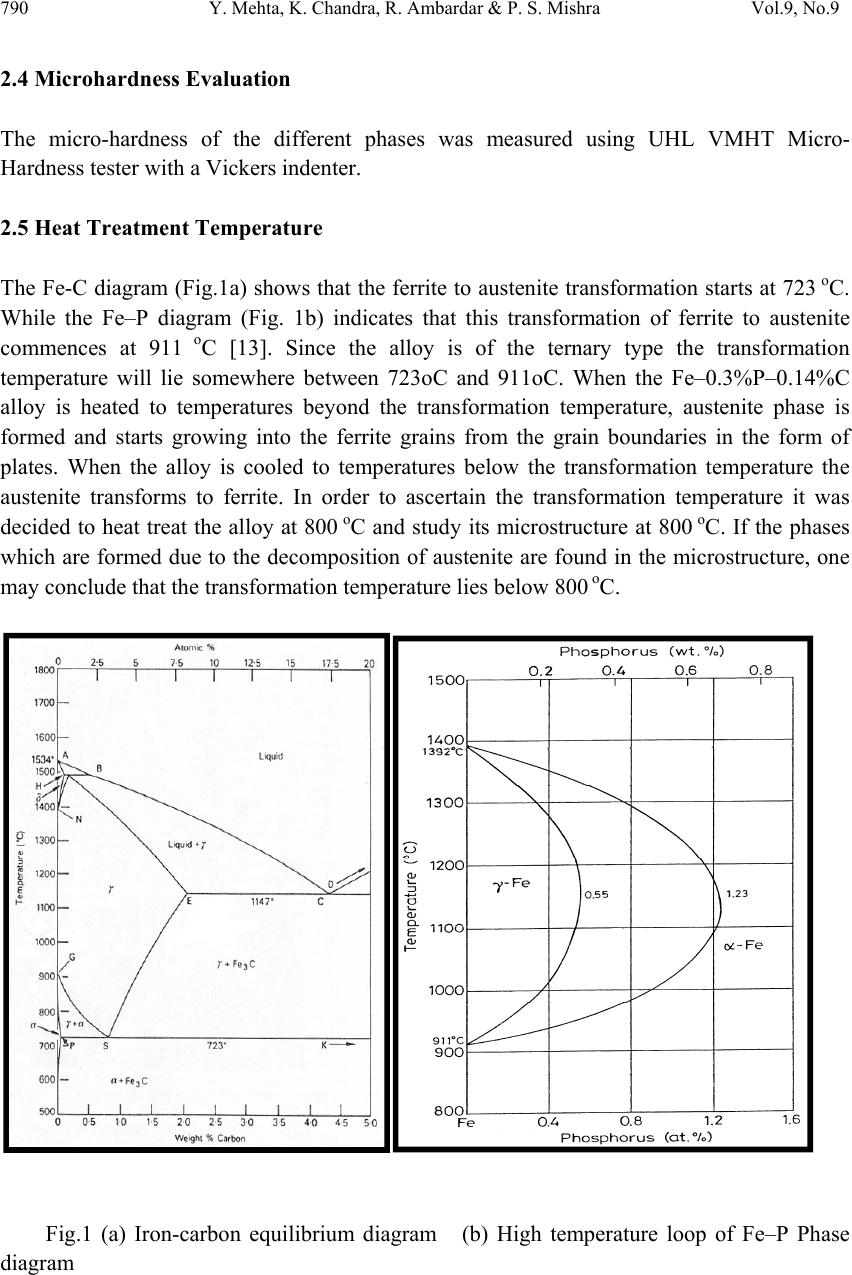 790 Y. Mehta, K. Chandra, R. Ambardar & P. S. Mishra Vol.9, No.9 2.4 Microhardness Evaluation The micro-hardness of the different phases was measured using UHL VMHT Micro- Hardness tester with a Vickers indenter. 2.5 Heat Treatment Temperature The Fe-C diagram (Fig.1a) shows that the ferrite to austenite transformation starts at 723 oC. While the Fe–P diagram (Fig. 1b) indicates that this transformation of ferrite to austenite commences at 911 o C [13]. Since the alloy is of the ternary type the transformation temperature will lie somewhere between 723oC and 911oC. When the Fe–0.3%P–0.14%C alloy is heated to temperatures beyond the transformation temperature, austenite phase is formed and starts growing into the ferrite grains from the grain boundaries in the form of plates. When the alloy is cooled to temperatures below the transformation temperature the austenite transforms to ferrite. In order to ascertain the transformation temperature it was decided to heat treat the alloy at 800 oC and study its microstructure at 800 oC. If the phases which are formed due to the decomposition of austenite are found in the microstructure, one may conclude that the transformation temperature lies below 800 oC. Fig.1 (a) Iron-carbon equilibrium diagram (b) High temperature loop of Fe–P Phase diagram 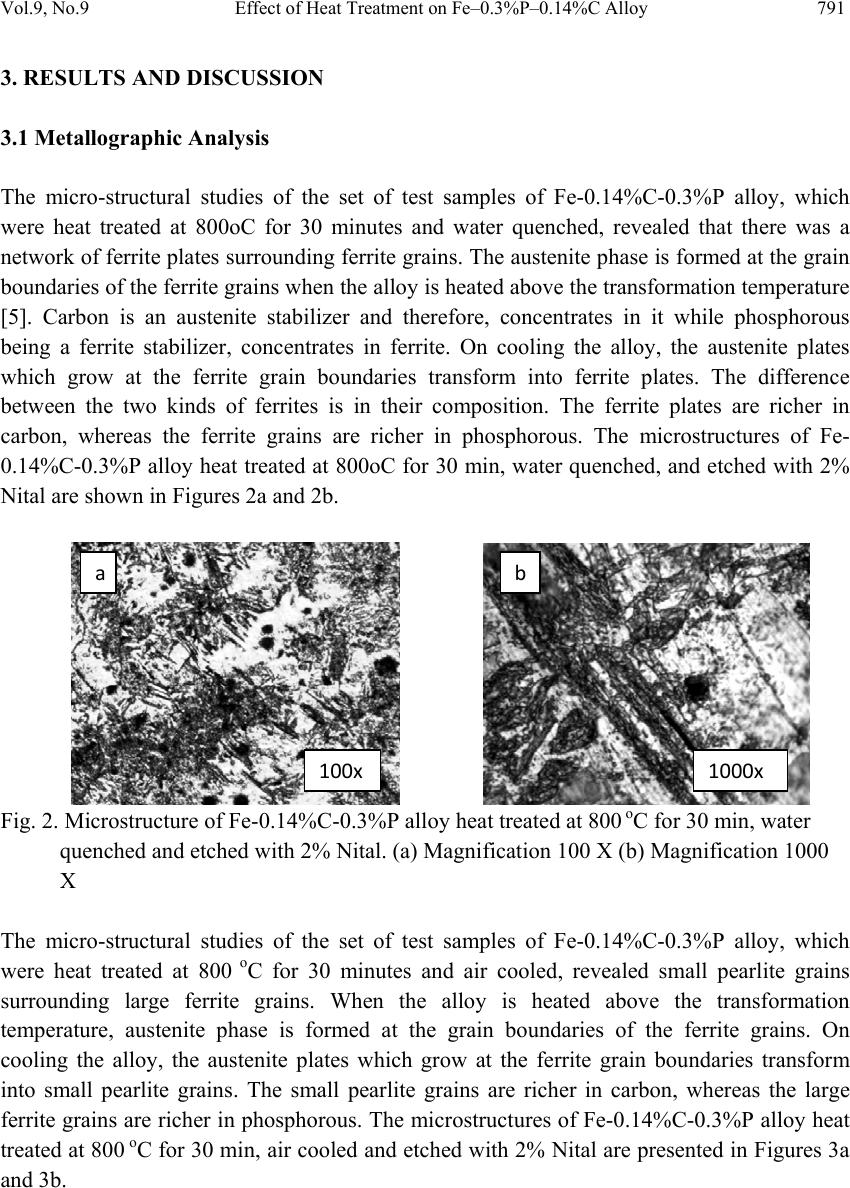 Vol.9, No.9 Effect of Heat Treatment on Fe–0.3%P–0.14%C Alloy 791 3. RESULTS AND DISCUSSION 3.1 Metallographic Analysis The micro-structural studies of the set of test samples of Fe-0.14%C-0.3%P alloy, which were heat treated at 800oC for 30 minutes and water quenched, revealed that there was a network of ferrite plates surrounding ferrite grains. The austenite phase is formed at the grain boundaries of the ferrite grains when the alloy is heated above the transformation temperatur e [5]. Carbon is an austenite stabilizer and therefore, concentrates in it while phosphorous being a ferrite stabilizer, concentrates in ferrite. On cooling the alloy, the austenite plates which grow at the ferrite grain boundaries transform into ferrite plates. The difference between the two kinds of ferrites is in their composition. The ferrite plates are richer in carbon, whereas the ferrite grains are richer in phosphorous. The microstructures of Fe- 0.14%C-0.3%P alloy heat treated at 800oC for 30 min, water quenched, and etched with 2% Nital are shown in Figures 2a and 2b. Fig. 2. Microstructure of Fe-0.14%C-0.3%P alloy heat treated at 800 oC for 30 min, water quenched and etched with 2% Nital. (a) Magnification 100 X (b) Magnification 1000 X The micro-structural studies of the set of test samples of Fe-0.14%C-0.3%P alloy, which were heat treated at 800 o C for 30 minutes and air cooled, revealed small pearlite grains surrounding large ferrite grains. When the alloy is heated above the transformation temperature, austenite phase is formed at the grain boundaries of the ferrite grains. On cooling the alloy, the austenite plates which grow at the ferrite grain boundaries transform into small pearlite grains. The small pearlite grains are richer in carbon, whereas the large ferrite grains are richer in phosphorous. The microstructures of Fe-0.14%C-0.3%P alloy heat treat ed at 800 oC for 30 min, air cooled and etch ed with 2% Nital are presented in Figures 3a and 3b. 100x 1000x a b  792 Y. Mehta, K. Chandra, R. Ambardar & P. S. Mishra Vol.9, No.9 Fig. 3. Microstructure of Fe-0.14%C-0.3%P alloy heat treated at 800 oC for 30 min, air cooled and etched with 2% Nital. (a) Magnification 100 X (b) Magnification 1000 X 3.2 Scanning Electron Microscopy Fig. 4 represents the scanning electron micrograph of the alloy indicating the presence of ferrite plates and ferrite grains. The ferrite plates are formed when aust enite plates transform on cooling. The presence of porosity in the micrograph is due to the improper control of pouring and casting. Fig. 4. SEM micrograph of Fe-0.14%C-0.3%P alloy heat treated at 800 oC for 30 min, water quenched and etched with 2% Nital. 3.3 Microhardness Evaluation The micro-hardness of each phas e in each hea t treated sample was deter mined by using UHL Micro-Hardness tester with a Vickers in denter. On an average 3-4 measurements were taken on different areas of each phase of each sample. The micro-hardness of a specific phase in a specified set of samples which was subjected to a specified rate of cooling has been reported as a range of micro-hardness numbers (Table 3). It is observed that the hardness of the set of water quenched samples is far greater than those of the air cooled samples. Further, the 100x Pore FerritePlates (PriorAustenite) 10µm Ferrite Grain 1000x a b  Vol.9, No.9 Effect of Heat Treatment on Fe–0.3%P–0.14%C Alloy 793 hardness of pearlite grains and ferrite plates (prior austenite) is high er than that of the ferrite grains. Table 3: Ranges of Vickers Micro-Hardness of Various Phases of Fe–0.3%P–0.14%C alloy Sample Type. Type of coolin g Phase Range (Hv) of Micro-hardness Set 1 Water quench Ferrite grains 229-265 Ferrite plates (prior Austenite) 432-461 Set 2 Air cool Ferrite grains 191-218 Pearlite grains 263-297 4. CONCLUSIONS On the basis of the present work the following conclusions can be drawn: i. The ferrite-austenite transformation temperature of Fe-0.3%P-0.14%C ternary alloy lies between 723 oC & 800 oC. ii. Carbon diffuses preferentially into the austenite regions at 800 oC & causes the pearlitic transformation to occur on cooling in air cooled samples. Small pearlite grains are found surrounding the large ferrite grains. iii. In water quenched samples, the austenite regions at 800 o C transform into ferrite plates on cooling. The ferrite plates are found surrounding the large ferrite grains. iv. It is observed that the hardness of the set of water quenched samples is far greater than those of the air cooled samples. v. The hardness of pearlite grains and ferrite plates (prior austenite) is higher than that of the ferrite grains. It is emphasized that a ll the experiments carried out on one specific Fe-P-C alloy and are not necessarily valid for other alloys. ACKNOWLEDGEMENT The authors wish to thank Shri Ajay Aggarwal, owner of Vaishnav Steel Private Limited, Muzaffernagar, India for making the castings of the Fe-0.3P-0.14C alloy for research purpose. REFERENCES [1] G. Wranglen, Corrosion Science, Vol. 10 (1970) 761 [2] R. Balasubramaniam, Delhi iron pillar—New insights, Shimla: Indian Institute of Advanced Study 2002  794 Y. Mehta, K. Chandra, R. Ambardar & P. S. Mishra Vol.9, No.9 [3] R. Baldev, P. Kalyanasundaram, T. Jayakumar , C. B. Rao, B.Venkataraman, U. K. Mudali, A.Joseph, A Kumar and K. V. Rajkumar Current Science, Vol. 88, No. 12, (2005) 1948. [4] R. F. Tylecote and B. Gilmour, The metallography of early ferrous edge tools and edged weapons, Oxford: BAR 155 (1986) [5] J. W. Stewart, J. A. Charles and E. R. Walla ch, Mater. S ci. Technol. 16 (200 0) 275, 283, 291 [6] N. P. Allen, Iron and its dilute solid solutions (eds) C W Spencer and F E Werner, New York: Wiley Interscience, 1963, 271 [7] B. E. Hopkins and H. R. Tipler, J. Iron Steel Inst. 188 (1958) 218 [8] S. Suzuki, M. Obata, K. Abiko and H. Kimura, Trans. ISIJ 25 (1985) 62 [9] J. Percy, Metallurgy—Iron and steel, London: John Murray, 1864 [10] K. B. Gove and J. A. Charles, Met. Technol. 1 (1974) 279 [11] J.L.Haughton, J. Iron &steel Inst., 115 (1927) 417 [12] R.Vogel, Arch. Eisenhuttenwes, 3 (1929) 369 [13] O. Kubaschewski, Iron—Binary phase diagrams, Berlin: Springer Verlag, 1982, 84 |