Paper Menu >>
Journal Menu >>
 Journal of Minerals & Materials Characterization & Engineering, Vol. 9, No.7, pp.593-606, 2010 jmmce.org Printed in the USA. All rights reserved 593 High Temperature Corrosion Behaviour of T-91 and T-22 Bare Steel in 75wt.%Na2SO4+25wt.%NaCl Molten Salt Environment at 900°C Dinesh Gonda*, Vikas Chawlab, D. Puria, S. Prakasha aMetallurgical & Materials Engineering Department, Indian Institute of Technology Roorkee, Roorkee 247667, India bMechanical Engineering Department, L.L.R.I.E.T., Moga, Punjab-152002, India * Corresponding author: dinesh_gond@yahoo.co.in ABSTRACT The oxidation behaviour of T-91 steel and T-22 steel in salt of 75wt.% Na2SO4 + 25wt.% NaCl has been studied under isothermal conditions at a temperature of 900°C in a cyclic manner. Oxidation kinetics was established for the T-91 steel and T-22 steel in salt at 900°C under cyclic conditions for 50 cycles by thermogravimetric technique. Each cycle consisted of 1 hour heating at 900°C followed by 20 min of cooling in air. Both the samples nearly followed the parabolic rate law of oxidation. X-ray diffraction (XRD) and scanning electron microscopy/energy dispersive X-ray (SEM/EDAX) techniques were used to characterise the oxide scales. T-91 steel was found to be more corrosion resistant than T-22 steel under salt oxidation. Keywords: Hot corrosion; T-91; T-22; 75wt.%Na2SO4+25wt.%NaCl at 900°C 1. INTRODUCTION Metals and alloys sometimes experience accelerated oxidation when their surfaces are covered with a thin film of fused salt in an oxidising gas atmosphere at elevated temperatures. This is known as hot corrosion where a porous non-protective oxide scale is formed at the surfaces and sulphides in the substrate [1]. Alloys that are developed for heat and oxidation resistance typically form a protective layer of chromia or alumina. The more rapidly this layer is established, the better protection is offered. As this layer grows or as it reforms over areas from which the original layer was removed, it must withdraw chromium or aluminium from the metal in order to provide for further scale growth [2]. Oxide scale is constituted by a layered structure with compositional and microstructural variations from the substrate to the outer interface [3–8]. 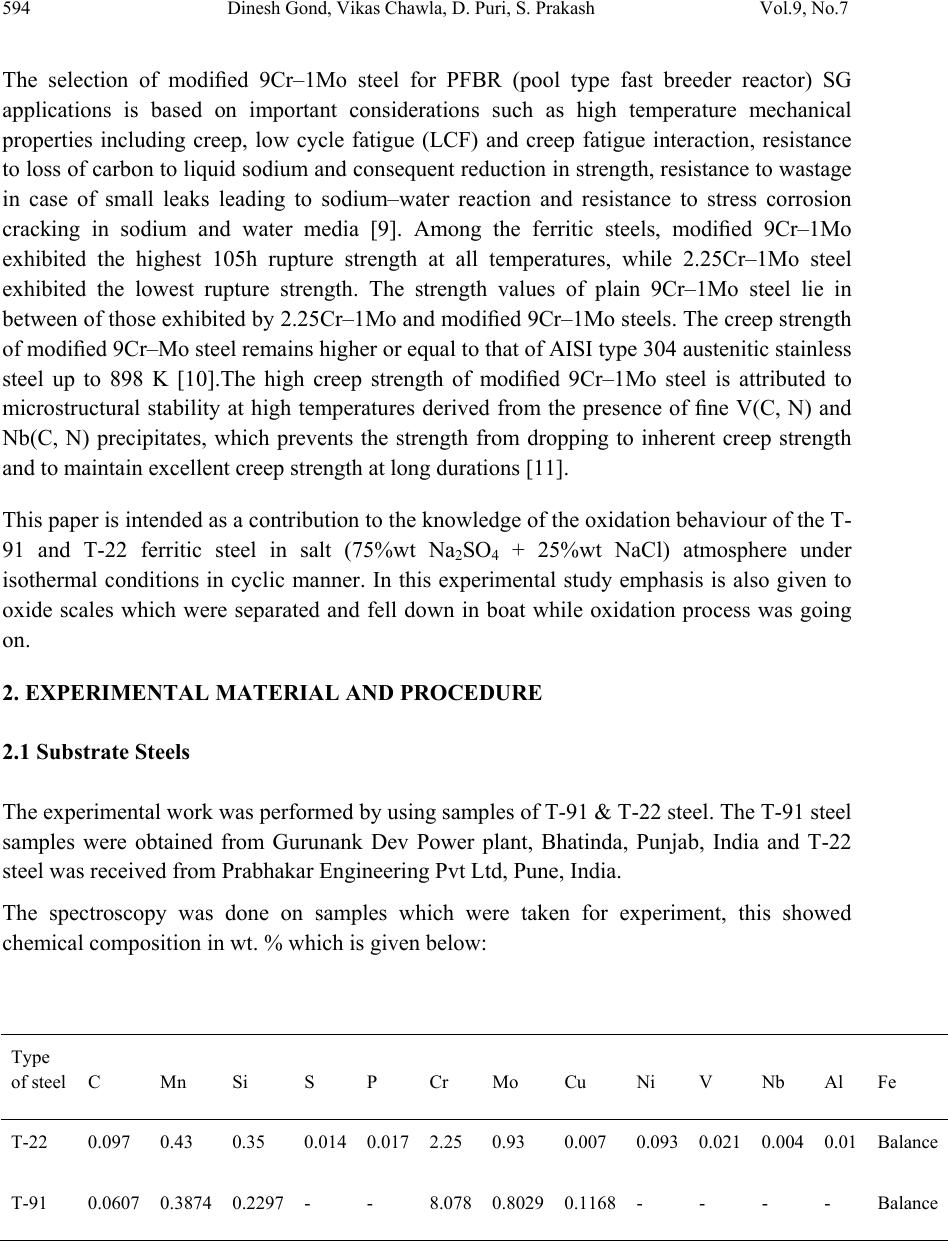 594 Dinesh Gond, Vikas Chawla, D. Puri, S. Prakash Vol.9, No.7 The selection of modified 9Cr–1Mo steel for PFBR (pool type fast breeder reactor) SG applications is based on important considerations such as high temperature mechanical properties including creep, low cycle fatigue (LCF) and creep fatigue interaction, resistance to loss of carbon to liquid sodium and consequent reduction in strength, resistance to wastage in case of small leaks leading to sodium–water reaction and resistance to stress corrosion cracking in sodium and water media [9]. Among the ferritic steels, modified 9Cr–1Mo exhibited the highest 105h rupture strength at all temperatures, while 2.25Cr–1Mo steel exhibited the lowest rupture strength. The strength values of plain 9Cr–1Mo steel lie in between of those exhibited by 2.25Cr–1Mo and modified 9Cr–1Mo steels. The creep strength of modified 9Cr–Mo steel remains higher or equal to that of AISI type 304 austenitic stainless steel up to 898 K [10].The high creep strength of modified 9Cr–1Mo steel is attributed to microstructural stability at high temperatures derived from the presence of fine V(C, N) and Nb(C, N) precipitates, which prevents the strength from dropping to inherent creep strength and to maintain excellent creep strength at long durations [11]. This paper is intended as a contribution to the knowledge of the oxidation behaviour of the T- 91 and T-22 ferritic steel in salt (75%wt Na2SO 4 + 25%wt NaCl) atmosphere under isothermal conditions in cyclic manner. In this experimental study emphasis is also given to oxide scales which were separated and fell down in boat while oxidation process was going on. 2. EXPERIMENTAL MATERIAL AND PROCEDURE 2.1 Substrate Steels The experimental work was performed by using samples of T-91 & T-22 steel. The T-91 steel samples were obtained from Gurunank Dev Power plant, Bhatinda, Punjab, India and T-22 steel was received from Prabhakar Engineering Pvt Ltd, Pune, India. The spectroscopy was done on samples which were taken for experiment, this showed chemical composition in wt. % which is given below: Type of steel C Mn Si S P Cr Mo Cu Ni V Nb Al Fe T-22 0.097 0.43 0.35 0.014 0.017 2.25 0.93 0.007 0.093 0.021 0.004 0.01 Balance T-91 0.0607 0.3874 0.2297 - - 8.078 0.8029 0.1168 - - - - Balance 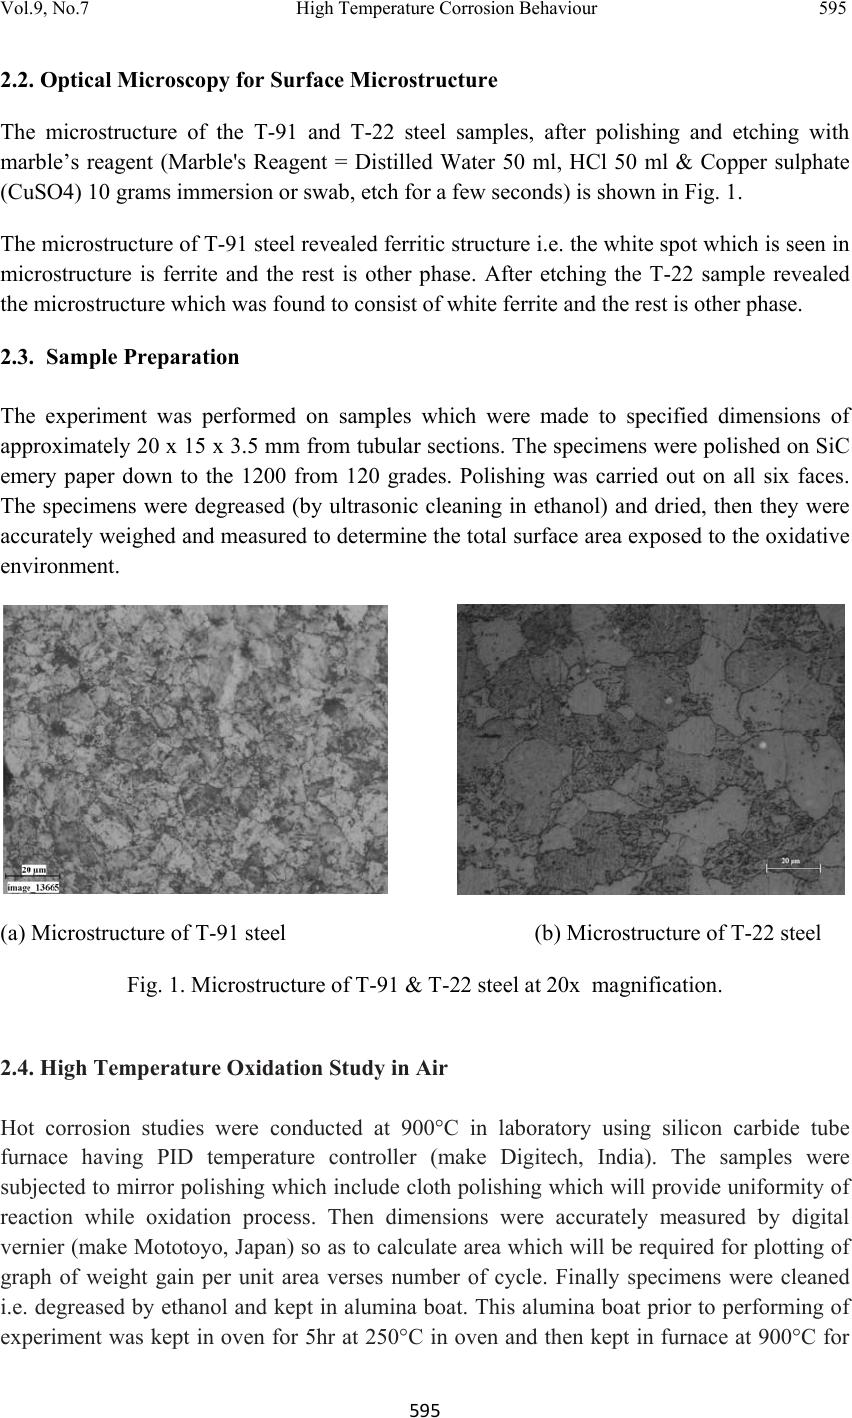 Vol.9, No.7 High Temperature Corrosion Behaviour 595 595 2.2. Optical Microscopy for Surface Microstructure The microstructure of the T-91 and T-22 steel samples, after polishing and etching with marble’s reagent (Marble's Reagent = Distilled Water 50 ml, HCl 50 ml & Copper sulphate (CuSO4) 10 grams immersion or swab, etch for a few seconds) is shown in Fig. 1. The microstructure of T-91 steel revealed ferritic structure i.e. the white spot which is seen in microstructure is ferrite and the rest is other phase. After etching the T-22 sample revealed the microstructure which was found to consist of white ferrite and the rest is other phase. 2.3. Sample Preparation The experiment was performed on samples which were made to specified dimensions of approximately 20 x 15 x 3.5 mm from tubular sections. The specimens were polished on SiC emery paper down to the 1200 from 120 grades. Polishing was carried out on all six faces. The specimens were degreased (by ultrasonic cleaning in ethanol) and dried, then they were accurately weighed and measured to determine the total surface area exposed to the oxidative environment. (a) Microstructure of T-91 steel (b) Microstructure of T-22 steel Fig. 1. Microstructure of T-91 & T-22 steel at 20x magnification. 2.4. High Temperature Oxidation Study in Air Hot corrosion studies were conducted at 900°C in laboratory using silicon carbide tube furnace having PID temperature controller (make Digitech, India). The samples were subjected to mirror polishing which include cloth polishing which will provide uniformity of reaction while oxidation process. Then dimensions were accurately measured by digital vernier (make Mototoyo, Japan) so as to calculate area which will be required for plotting of graph of weight gain per unit area verses number of cycle. Finally specimens were cleaned i.e. degreased by ethanol and kept in alumina boat. This alumina boat prior to performing of experiment was kept in oven for 5hr at 250°C in oven and then kept in furnace at 900°C for 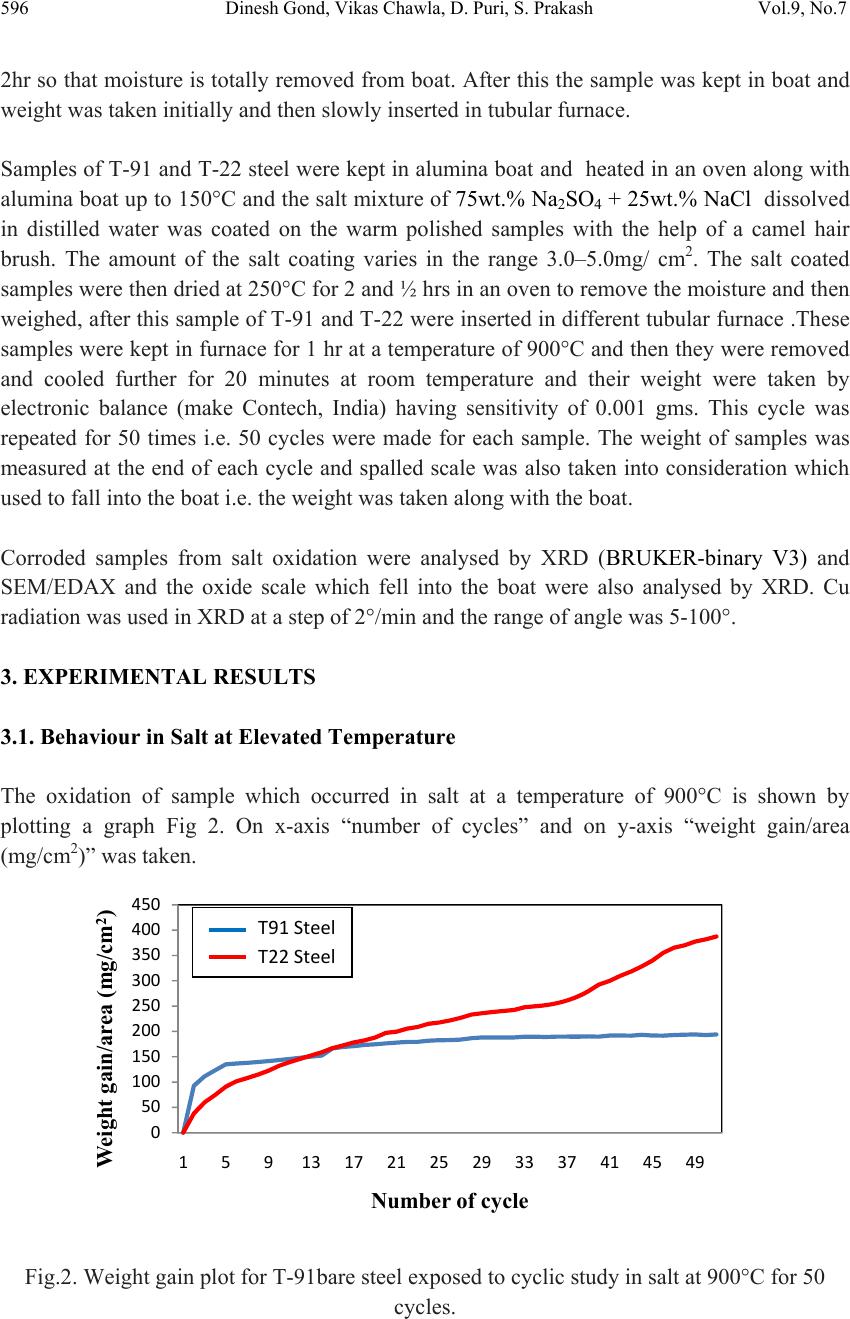 596 Dinesh Gond, Vikas Chawla, D. Puri, S. Prakash Vol.9, No.7 2hr so that moisture is totally removed from boat. After this the sample was kept in boat and weight was taken initially and then slowly inserted in tubular furnace. Samples of T-91 and T-22 steel were kept in alumina boat and heated in an oven along with alumina boat up to 150°C and the salt mixture of 75wt.% Na2SO4 + 25wt.% NaCl dissolved in distilled water was coated on the warm polished samples with the help of a camel hair brush. The amount of the salt coating varies in the range 3.0–5.0mg/ cm2. The salt coated samples were then dried at 250°C for 2 and ½ hrs in an oven to remove the moisture and then weighed, after this sample of T-91 and T-22 were inserted in different tubular furnace .These samples were kept in furnace for 1 hr at a temperature of 900°C and then they were removed and cooled further for 20 minutes at room temperature and their weight were taken by electronic balance (make Contech, India) having sensitivity of 0.001 gms. This cycle was repeated for 50 times i.e. 50 cycles were made for each sample. The weight of samples was measured at the end of each cycle and spalled scale was also taken into consideration which used to fall into the boat i.e. the weight was taken along with the boat. Corroded samples from salt oxidation were analysed by XRD (BRUKER-binary V3) and SEM/EDAX and the oxide scale which fell into the boat were also analysed by XRD. Cu radiation was used in XRD at a step of 2°/min and the range of angle was 5-100°. 3. EXPERIMENTAL RESULTS 3.1. Behaviour in Salt at Elevated Temperature The oxidation of sample which occurred in salt at a temperature of 900°C is shown by plotting a graph Fig 2. On x-axis “number of cycles” and on y-axis “weight gain/area (mg/cm2)” was taken. Fig.2. Weight gain plot for T-91bare steel exposed to cyclic study in salt at 900°C for 50 cycles. 0 50 100 150 200 250 300 350 400 450 159 13172125293337414549 We ight gain/area (mg/cm 2 ) Number of cycle T91Steel T22Steel  Vol.9, No.7 High Temperature Corrosion Behaviour 597 597 The hot corrosion behaviour of T-91 and T-22 steel in salt was parabolic as shown above, but in T-22 steel after 35th cycle there was more weight gain. The above two graph reveals that T- 91 steel is better than T-22 steel in an environment of salt oxidation (for 50 cycles). Every line or curve in graph is having its approximate equation which is given below. For T-91 salt oxidation the approximated curve is Y = -13.78649 + 52.32262*X - 6.51182*X^2 + 0.40256*X^3 - 0.01266*X^4 + 1.94808E- 4*X^5 -1.16293E-6*X^6 For T-22 salt oxidation the approximated curve is Y = -13.78649 + 52.32262*X - 6.51182*X^2 + 0.40256*X^3 -0.01266*X^4 + 1.94808E- 4*X^5 -1.16293E-6*X^6 (Where X is number of cycle and Y is weight gain/area & this equation is calculated by using analysis mode of Origin software) As shown in macrograph T-91 salt oxidised sample did not showed much more crack or extrusion of material from beneath but T-22 steel had more corrosion effect as shown in macrograph, its layer got separated from its substrate as is evident from Fig 3 and the oxide layer formed on T-22 sample is also thick as shown in Fig 8. (a) (b) Fig. 3. Macrograph of (a) T-91 salt oxidised (b) T-22 salt oxidised samples. 3.2. X-Ray Diffraction Analysis The samples after oxidation were removed from boat and their oxide scales which were separated from surface were also removed. Then they were analysed separately by XRD and after that only oxidised sample were analysed by SEM / EDAX. The re sults of XRD an alysis contained graph indicating peak values (i.e. d values) which were used to identify various phases with the help of inorganic X-ray Diffraction data card from Po wder diffracti on file of JCPDS. Help of software named Philips X’pert High score and Eva was also taken for finding out compounds at respective peaks.  598 Dinesh Gond, Vikas Chawla, D. Puri, S. Prakash Vol.9, No.7 3.2.1. XRD result for T-91 and T22 sample From the X-Ray Diffraction analysis it is found that ferrous oxide (Fe2O3), chromium ferrous oxide (Cr, Fe)2O3 are mainly formed along with Cr2O3, in T-91 salt oxidised sample but in T-22 sample NiO is also formed in addition to Fe2O3 , (Cr, Fe)2O3, Cr2O3. Fe2O3, Cr2O3 form a protective oxide layer at surface due to which further oxidation is prevented as it acts as barrier for further corroding media to interact with substrate but as in case of T-22 steel, Nickel oxide (NiO) is formed which are not protective, rather than that NiO is said to be loose structured and thus lead to more pore size and thus results in more corrosion [12-14]. Fig 4. XRD graph for T-91, T-22 sample and its oxide scales in salt oxidised environment at 900°C. 3.3. Energy Dispersive X-ray (EDAX) Studies 3.3.1. Surface scale The SEM/EDAX analysis for T-91 & T-22 sample after oxidation in salt for 50 cycle at 900°C is shown in Fig 5 & 6. Surface morphology of T-91 salt oxidised sample Fig 5(a & b) reveals that the oxide formed is layer wise but at higher magnification it revealed that the layer contain granules. Analysis of these granules revealed that they were formed when the amount of chromium oxide was less in it i.e. at about 1-2%.and it showed some cracking in 20 30 40 50 60 70 T-22 Sputtered Ox ide Scale T-22 Salt Oxidised T-91 Sputtered Oxide Scale T-91 Salt Oxidised a a a a,c a,b a,c da a a a c a,b,c c c c c c c c c a,b a,b,c a,b, c a= Fe 2 O 3 b= Cr 2 O 3 c= (Cr,Fe) 2 O 3 d= NiO In te n s ity (Ar b itr a r y Con sta nt) Diffraction Angle (2 Theta)  Vol.9, No.7 High Temperature Corrosion Behaviour 599 599 oxide layer. In this there is more amount of Mo2O3 and this is also one reason that the oxide layer formed in this case are strong as when they react with salt. Surface morphology of T-22 salt oxidised sample Fig 6 (a & b) revealed some fibrous structure at higher magnification which mainly comprised of Fe2O3 and the rest other compounds were Mo2O3, Cr2O3 and NiO and at very middle nodule of aluminium oxide was also found. As compared to T-91 steel T-22 steel formed very less amount chromium oxide which is mainly responsible for corrosion protection and in this some NiO oxide is also formed and as sa i d before in description of XRD analysis NiO is loose structured, hence there are two main reason for less corrosion protection for T-22 steel is that less amount of Cr2O3 formed and presence of NiO. (a) T-91 salt oxidised sample at scale of 500 µm (b) T-91 salt oxidised sample at scale of 100µm Fig 5. Surface scale morphology and EDAX analysis (wt.%) for T-91 steel sample subjected to the cyclic oxidation at 900°C for 50 cycles in salt environment.  600 Dinesh Gond, Vikas Chawla, D. Puri, S. Prakash Vol.9, No.7 (a) T-22 salt oxidised sample at scale of 500 µm (b) T-22 salt oxidised sample at scale of 100µm Fig 6 (a-b). Surface scale morphology and EDAX analysis (wt.%) for T-22 steel sample subjected to the cyclic oxidation at 900°C for 50 cycles in salt environment 3.3.2. Cross-sectional scale The BSEI micrograph shown in Fig. 8 reveals the condition of scale of T-91 and T-22 steel sample exposed to the cyclic oxidation for 50 cycles at 900°C.Elemental variation for corroded cross-section of T-91 and T-22 is also shown along with in form of point wise analysis. Fig.7 shows the macrograph of cross section which were cut from the samples. In T- 91 salt oxidised sample Fig 8(a) at point 9 i.e. at outer edge, ferrous oxide is formed along with molybdenum oxide but at point 5 where there is void ferrous oxide seems to be decreasing as compare to other points and rate of molybdenum oxide is nearly constant and its direct effect is seen at point 6 where ferrous oxide is very less. In this two distinct layer can be seen in which layer near the substrate is rich in ferrous and the second layer is rich in chromium as compared to first layer.  Vol.9, No.7 High Temperature Corrosion Behaviour 601 601 (a) (b) Fig.7. Cross-sectional macrograph of (a) T-91 salt oxidised (b) T-22 salt oxidised samples. In T-22 salt oxidised sample Fig.8(b) after point 3 where the oxide layer has got separated from substrate shows decrease in elemental composition but at outer side i.e. at point 9 there is more ferrous oxide and at point 1 there is no oxygen but high amount of ferrous as it is substrate material and at point 4 where there is void less amount of ferrous oxide has formed as compared to other points. In this outer oxide layer seems to be thick and in T-91 salt oxidised sample middle layer seems to be more protective than outer one. (a) T-91 salt oxidised sample (b) T-22 salt oxidised sample Fig.8. Oxide scale morphology and elemental composition variation across the cross section of T-91 steel exposed to salt environment at 900°C for 50 cycles. Substrate Oxide Substrate Oxide  602 Dinesh Gond, Vikas Chawla, D. Puri, S. Prakash Vol.9, No.7 4. DISCUSSION The results which were seen till now resemble that corrosion resistance property of T-91 steel is better than T-22 steel as weight gain of T-22 steel is more. Internal oxidation further led to the cracking of the scale due to the different thermal expansion coefficients of oxides in the scale from that of coating as suggested by P. Niranatlumpong [13]. As there are various elements and each have different thermal coefficient of expansion hence there will be more stress generated which will lead to more cracking. Through these cracks, corrosive gases can penetrate to the base material and will thus allow significant grain boundary corrosion attack [15–17]. Comparatively higher weight gain values in case of T-22 steels might be attributed to the presence of molybdenum in this substrate steel. The better corrosion resistance of T-91 steels may also be attributed to the absence of a NiO layer in the scale. During investigation, the NiO layer was observed in the oxide scale of T-22 steel. This layer has been suggested to be loose- structured by X. Wu [12], which may not be able to provide effective protection. P. Niranatlumpong [13] have also suggested increase in the pore size of Ni and Cr scale with increase in exposure time, which allows the degrading species to penetrate through the coating thereby resulting in the oxidation of substrate steels. It could be seen from Fig. 2 that the over-all weight gains was conceived only during the initial cycles of the oxidation study in T-91 salt oxidation case. This may be due to the rapid formation of the oxides at the grain boundaries and within open pores due to the penetration of the oxidizing species along the grain boundaries/open pores during the early cycles of the study, as has been proposed by Choi [18] and Niranatlumpong [13]. However, once the oxides are formed at the places of the porosity and the grain boundaries, the oxide layer becomes dense and the diffusion of the oxidizing species to the internal portions of the substrate gets slowed down and the growth of the oxides becomes limited mainly to the surface of the specimens. When the oxide layer was removed by using orbital shaking machine from the substrate in case of salt applied sample it revealed that pitting action occurred due salt on the surface Fig 11(a & b). In case of T-91 steel Fig 11(a) the pits formed were very small in size and were uniform all over the surface whereas in case of T-22 steel the pits formed were not uniformly distributed all over the surface but they occurred in specific pattern as shown in figure Fig 11(b) and were very large and deep as compared to T-91 steel pits. SubstrateOxide  Vol.9, No.7 High Temperature Corrosion Behaviour 603 603 Fig. 9 BSEI and elemental X-ray mapping of the cross-section of T-91 sample exposed to cyclic hot corrosion at 900°C for 50 cycles in salt of 75%wt Na2SO4 + 25%wt NaCl Substrate Oxide Fe O Cr Mn Mo BSEI  604 Dinesh Gond, Vikas Chawla, D. Puri, S. Prakash Vol.9, No.7 Fig. 10. BSEI and elemental X-ray mapping of the cross-section of T-22 sample exposed to cyclic hot corrosion in at 900°C for 50 cycles in salt of 75%wt Na2SO4 + 25%wt NaCl. Substrate Oxide BSEI Cr Ni Fe O Mn Mo  Vol.9, No.7 High Temperature Corrosion Behaviour 605 605 (a) Micrograph of pitting on T-91 salt oxidised sample at scale of 500µm and 200µm. (b) Micrograph of pitting on T-22 salt oxidised sample at scale of 500µm and 200µm. Fig.11. Micrograph of pitting occurred on salt oxidised sample (a) T-91 and (b)T-22 steel 5. CONCLUSION The cyclic oxidation of this T-91 steel in salt follows parabolic law but in T-22 steel after 35th cycle it showed steep increase in weight gain. In case of T-91 the weight gain (0.617 gms) was much less as compared to T-22 steel (1.292 gms) because T-91 steel has formed chromium iron oxide (Cr, Fe)2O3 , chromium oxide Cr2O3 and hematite (Fe2O3) at top surface while T-22 formed nickel oxide (NiO) which is said to be loose structured and not able to provide effective protection. It also increases the pore size of Ni and Cr scale, which allows the degrading species to penetrate through the coating thereby resulting in the oxidation of substrate [12-14]. Hence T-91 is found to be superior to T-22 steel and as per the cross section morphology the scale thickness of T-91 is comparatively smaller than T-22 steel. REFERENCES [1] Harpreet Singh, D. Puri, S. Prakash, Some studies on hot corrosion performance of plasma sprayed coatings on a Fe-based superalloy, Surface & Coatings Technology 192, 25 May 2004,pp.27– 38. [2] R.J. Link, N. Birks, F.S. Pettit, F. Dethorey, The response of alloys to erosion– corrosion at high temperatures, Oxid. Met. 49 (3–4) (1998) pp.213–236.  606 Dinesh Gond, Vikas Chawla, D. Puri, S. Prakash Vol.9, No.7 [3] I. Saeki, T. Saito, R. Furuichi, M. Itoh, Growth process of protective oxides formed on type 304 and 430 stainless steels at 1273°K, Corros. Sci. 40 (8) (1998) p.1295. [4] S. Jianian, Z. Longjiang, L. Tiefan, High temperature oxidation of Fe–Cr alloys in wet oxygen, Oxid. Met. 48 (3, 4) (1997) p.347. [5] Z. Tokei, H. Viefhaus, H.J. Grabke, Initial stages of oxidation of a 9CrMoV steel: role of segregation and martensite laths, Appl. Surf. Sci. 165 (1) (2000) p.23. [6] A. P. Greeff, C.W. Louw, H.C. Swart, The oxidation of industrial FeCrMo steel, Corros. Sci. 42 (10) (2000) p.1725. [7] A. Arztegui, T. Gomez-Acebo, F. Castro, Steam oxidation of ferritic steels: kinetics and microstructure, Bol. Soc. Esp. Ceram. Vidr. 39 (3) (2000). p.305. [8] A.S. Khanna, P. Rodriguez, J.B. Gananamoorthy, Oxidation kinetics, breakaway oxidation, and inversion phenomenon in 9Cr–1Mo steels, Oxid. Met. 26 (3, 4) (1986) p.171. [9] Mathew MD, Choudhary BK, Albert SK. Selection of materials for PFBR nuclear steam supply system components. Report-PFBR/MDG/2002/001, IGCAR Kalpakkam. [10] Baldev Raj, B.K. Choudhary, R.K. Singh Raman, Pressure Vessels and Piping 81 (2004) 521– 534. [11] Kimura K, Kushima H, Abe F, Yagi K, Irie H. In: Strang A, Banks WM, Conroy RD, Goulette MJ, editors. Advances in turbine materials, design and manufacturing. London: The Institute of Materials; 1997. pp. 257–69. [12] X. Wu, D. Weng, Z. Chen, L. Xu, Surface Coating Technology, 140 (2001), p.231. [13] P. Niranatlumpong, C.B. Ponton, H.E. Evans, Oxid. Met, 53 (3–4) (2000), pp. 241- 258. [14] Buta Singh Sidhu, S. Prakash , Performance of NiCrAlY, Ni–Cr, Stellite-6 and Ni3Al coatings in Na2SO4–60% V2O5 environment at 900°C under cyclic conditions, Surface & Coatings Technology 201,17 April 2006, pp.1643–1654. [15] S. Danyluk, J.Y. Park, Corrosion 35 (12) (1979) p.575. [16] D. Wang, Surf. Coat. Technol. 36 (1988) p.49. [17] S.E. Sadique, A.H. Mollah, M.S. Islam, M.M. Ali, M.H.H. Megat, S.Basri, Oxid. Met. 54 (5–6), (2000) p.385. [18] H. Choi, B. Yoon, H. Kim, C. Lee, Surf. Coat. Technol. 150 (2–3) (2002) pp.297–308. |