Paper Menu >>
Journal Menu >>
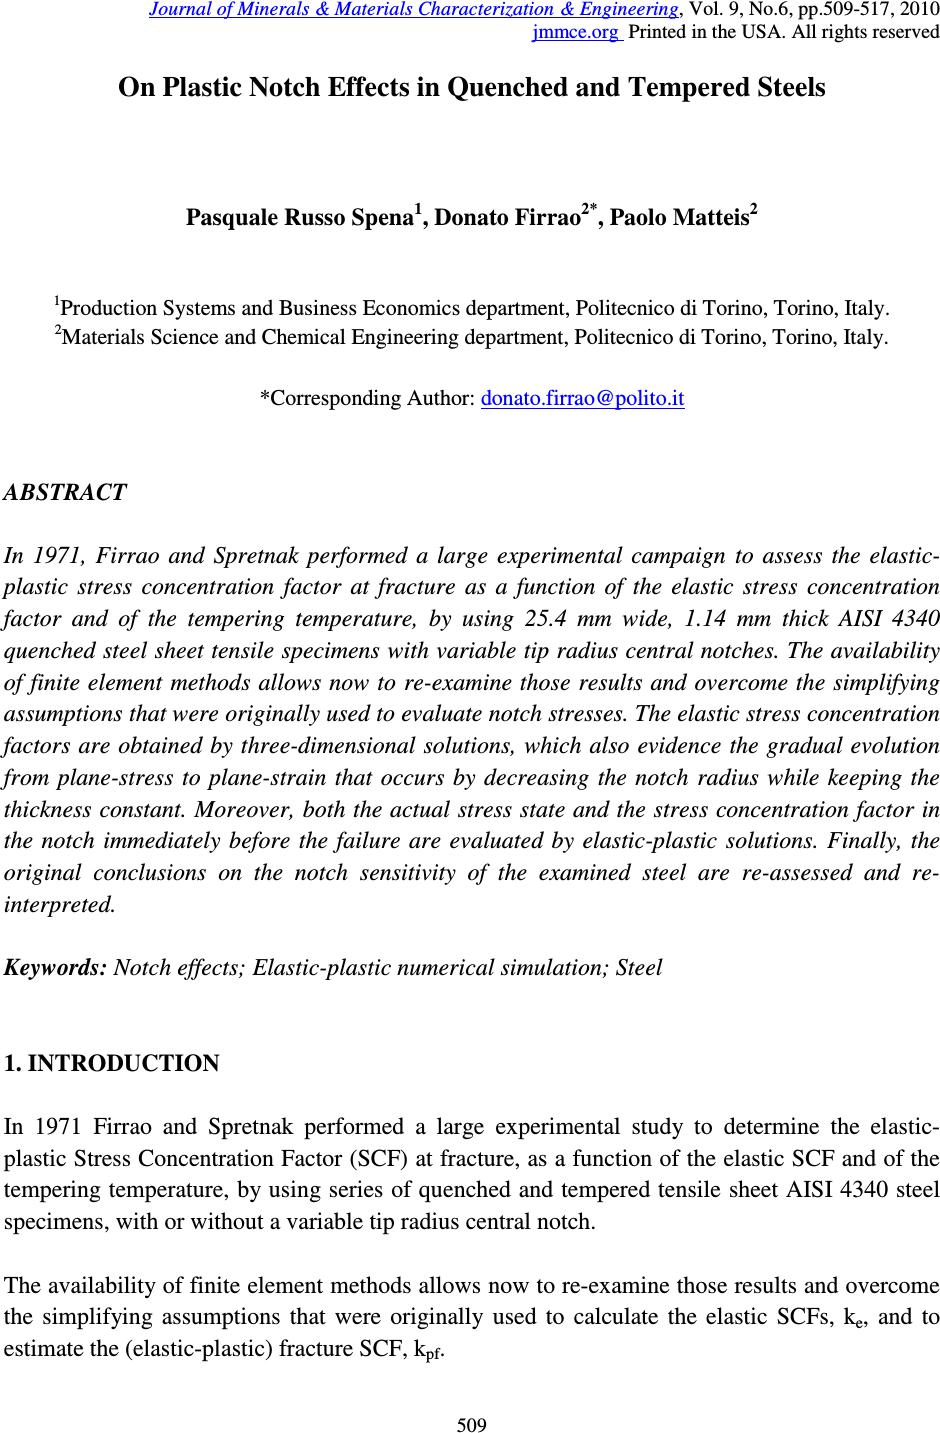 Journal of Minerals & Materials Characterization & Engineering, Vol. 9, No.6, pp.509-517, 2010 jmmce.org Printed in the USA. All rights reserved 509 On Plastic Notch Effects in Quenched and Tempered Steels Pasquale Russo Spena 1 , Donato Firrao 2* , Paolo Matteis 2 1 Production Systems and Business Economics department, Politecnico di Torino, Torino, Italy. 2 Materials Science and Chemical Engineering department, Politecnico di Torino, Torino, Italy. *Corresponding Author: donato.firrao@polito.it ABSTRACT In 1971, Firrao and Spretnak performed a large experimental campaign to assess the elastic- plastic stress concentration factor at fracture as a function of the elastic stress concentration factor and of the tempering temperature, by using 25.4 mm wide, 1.14 mm thick AISI 4340 quenched steel sheet tensile specimens with variable tip radius central notches. The availability of finite element methods allows now to re-examine those results and overcome the simplifying assumptions that were originally used to evaluate notch stresses. The elastic stress concentration factors are obtained by three-dimensional solutions, which also evidence the gradual evolution from plane-stress to plane-strain that occurs by decreasing the notch radius while keeping the thickness constant. Moreover, both the actual stress state and the stress concentration factor in the notch immediately before the failure are evaluated by elastic-plastic solutions. Finally, the original conclusions on the notch sensitivity of the examined steel are re-assessed and re- interpreted. Keywords: Notch effects; Elastic-plastic numerical simulation; Steel 1. INTRODUCTION In 1971 Firrao and Spretnak performed a large experimental study to determine the elastic- plastic Stress Concentration Factor (SCF) at fracture, as a function of the elastic SCF and of the tempering temperature, by using series of quenched and tempered tensile sheet AISI 4340 steel specimens, with or without a variable tip radius central notch. The availability of finite element methods allows now to re-examine those results and overcome the simplifying assumptions that were originally used to calculate the elastic SCFs, k e , and to estimate the (elastic-plastic) fracture SCF, k pf . 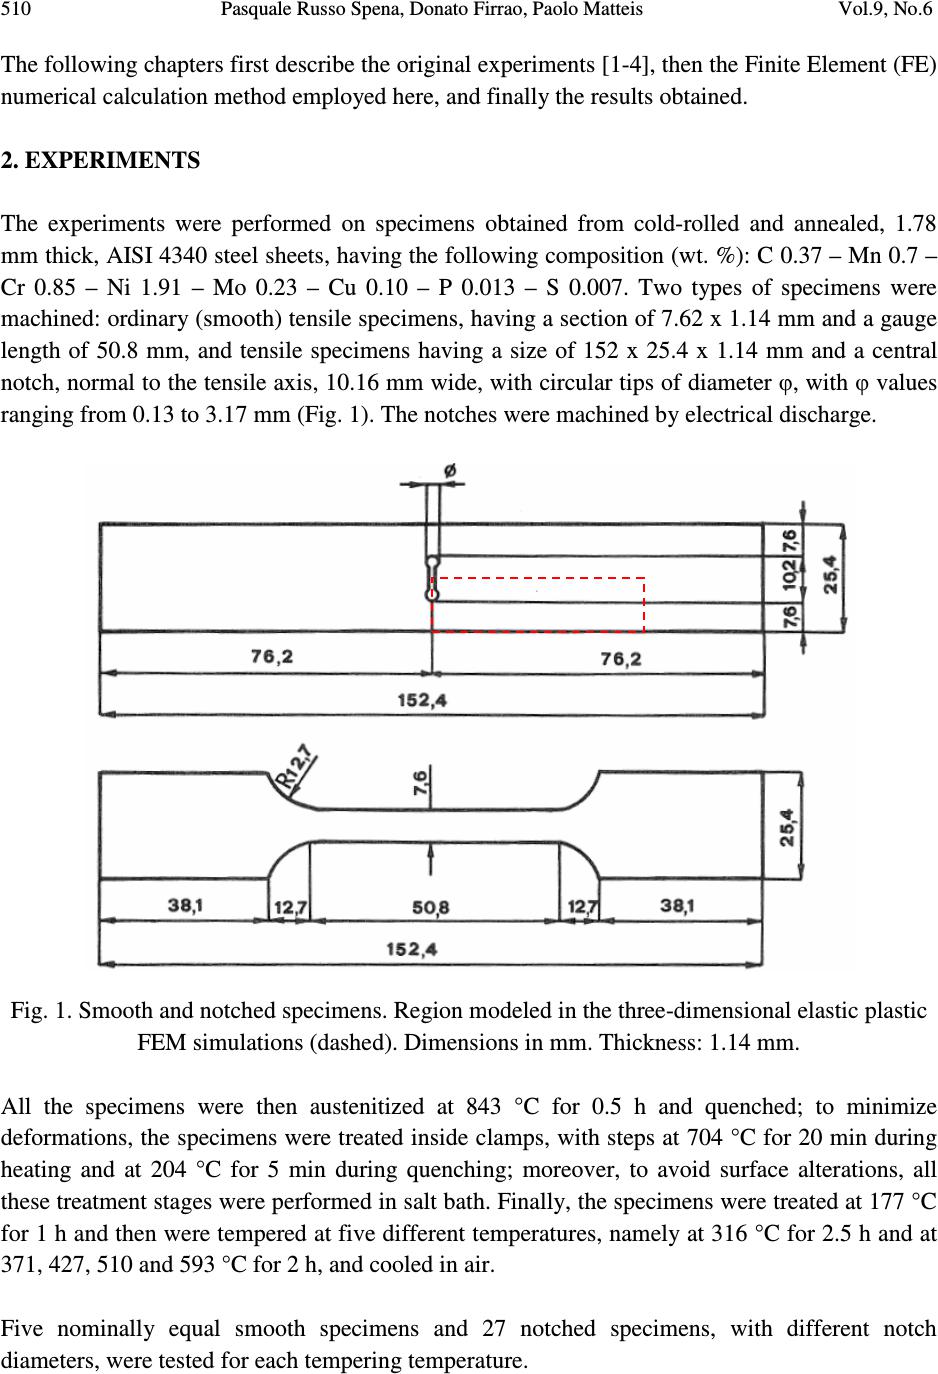 510 Pasquale Russo Spena, Donato Firrao, Paolo Matteis Vol.9, No.6 The following chapters first describe the original experiments [1-4], then the Finite Element (FE) numerical calculation method employed here, and finally the results obtained. 2. EXPERIMENTS The experiments were performed on specimens obtained from cold-rolled and annealed, 1.78 mm thick, AISI 4340 steel sheets, having the following composition (wt. %): C 0.37 – Mn 0.7 – Cr 0.85 – Ni 1.91 – Mo 0.23 – Cu 0.10 – P 0.013 – S 0.007. Two types of specimens were machined: ordinary (smooth) tensile specimens, having a section of 7.62 x 1.14 mm and a gauge length of 50.8 mm, and tensile specimens having a size of 152 x 25.4 x 1.14 mm and a central notch, normal to the tensile axis, 10.16 mm wide, with circular tips of diameter φ, with φ values ranging from 0.13 to 3.17 mm (Fig. 1). The notches were machined by electrical discharge. Fig. 1. Smooth and notched specimens. Region modeled in the three-dimensional elastic plastic FEM simulations (dashed). Dimensions in mm. Thickness: 1.14 mm. All the specimens were then austenitized at 843 °C for 0.5 h and quenched; to minimize deformations, the specimens were treated inside clamps, with steps at 704 °C for 20 min during heating and at 204 °C for 5 min during quenching; moreover, to avoid surface alterations, all these treatment stages were performed in salt bath. Finally, the specimens were treated at 177 °C for 1 h and then were tempered at five different temperatures, namely at 316 °C for 2.5 h and at 371, 427, 510 and 593 °C for 2 h, and cooled in air. Five nominally equal smooth specimens and 27 notched specimens, with different notch diameters, were tested for each tempering temperature.  Vol.9, No.6 On Plastic Notch Effects 511 The relevant dimensions of all the specimens were measured individually; in particular the tip radii were measured with an optical microscope. The specimens were then tested in displacement control, with a speed of 0.5 mm/min, up to fracture. The engineering stress (defined in respect to the minimum specimens cross section at the beginning of the test) at fracture, σ f , of the notched specimens, and the engineering tensile curves and ultimate tensile stress (UTS) of the smooth specimens, were recorded. In particular, the latter curves were recorded by glued electrical strain-gages up to 0.016 strain and are shown in Fig. 2, and the average UTS was 1560, 1425, 1327, 1129 and 1120 MPa, after tempering at 316, 371, 427, 510 and 593 °C, respectively. The fracture of the smooth specimens always occurred by a strain localization on a surface inclined of about 35° from the tensile axis [4], without a significant contribution to the total elongation due to necking. 0 200 400 600 800 1000 1200 1400 1600 0.000 0.002 0.004 0.006 0.008 0.010 0.012 0.014 0.016 Eng. Stress [MPa] Eng. Strain 316 °C 371 °C 427 °C 510 °C 593 °C Fig. 2. Tensile curves of the steel AISI 4340 quenched and tempered at different temperatures (recorded up to 0.016 strain). 3. NUMERICAL SIMULATION METHODS Series of FE numerical simulations were performed in order to determine the stress state caused by the above described experiments close to the notch tips, in case of either elastic (initial) or elastic-plastic (actual) material behavior. Three-dimensional elastic calculations were performed with elastic modulus E = 200 GPa and Poisson ratio υ = 0.33, by modeling 1/8 of the specimen central region (of total length 100 mm) with tetrahedral elements, by exploiting the 3 symmetry planes, as outlined in Fig. 1. The element size in the notch region was comprised between about 20 and 50 µm, for different notch  512 Pasquale Russo Spena, Donato Firrao, Paolo Matteis Vol.9, No.6 diameters, whereas elsewhere it was about 1 mm. Moreover, three-dimensional elastic-plastic calculations were performed with the same geometry, FE mesh, and elastic constants, and with the following plastic behavior model: Von Mises yielding criterion, associated plastic flow law, isotropic hardening, and plastic flow stress obtained from the above reported tensile curves (Fig. 2), as a function of the equivalent plastic strain, for each examined tempering temperature. The plastic flow stress vs. equivalent plastic strain curves were extrapolated, and the maximum computed equivalent plastic strain was comprised between 0.1 and 0.6, for different notch diameters and tempering temperatures. All the calculations were performed with a remote stress boundary condition; in particular, in the elastic-plastic calculations the engineering stress σ (defined in respect to the minimum specimens cross section at the beginning of the test) was increased from 10 to 1660, 1510, 1510, 1210 and 1210 MPa, for the material tempered at 316, 371, 427, 510 and 593 °C, respectively, with 75 MPa steps. For each tempering temperature, the largest examined stress was somewhat higher than the largest experimental fracture stress, σ f . Each calculation was repeated for nine different notch diameters φ, namely: 0.125 – 0.15 – 0.19 – 0.36 – 0.41 – 0.56 – 0.92 – 1.5 – 3.18 mm; each of these values is close to a set of actual (measured) notch diameters, and all the actual notch diameters are comprised into the 0.125 to 3.18 mm range. 4. NUMERICAL RESULTS 4.1 Stress Concentration Factors The elastic SCF at the notch tip, k e , is defined as the ratio between the axial stress σ yy (which is also the first principal stress) and the abovementioned nominal stress σ (which is defined in respect to the initial minimum net section). The k e factor was originally determined by Firrao and Spretnak by using the following analytical formula, due to Dixon [5], based on the plane stress hypothesis: k e = σ yy / σ = ( 1 + 2 (a/(φ/2)) 1/2 ) ( (1 - 2 a/W) / ( 1 + 2 a/W ) ) 1/2 , where a is the notch half-width (5.08 mm) and W is the specimen width (25.4 mm). In Fig. 3 this formula is compared with the results of the three-dimensional FE calculations; the latter are plotted for two different points along the crack tip, on the specimen outer surface and at mid-thickness, either for elastic or elastic-plastic loading. The elastic-plastic results are plotted for two different tempering temperatures, by considering in each case the largest investigated nominal stresses, which is slightly higher than σ f . In the specimens center plane, the elastic stress 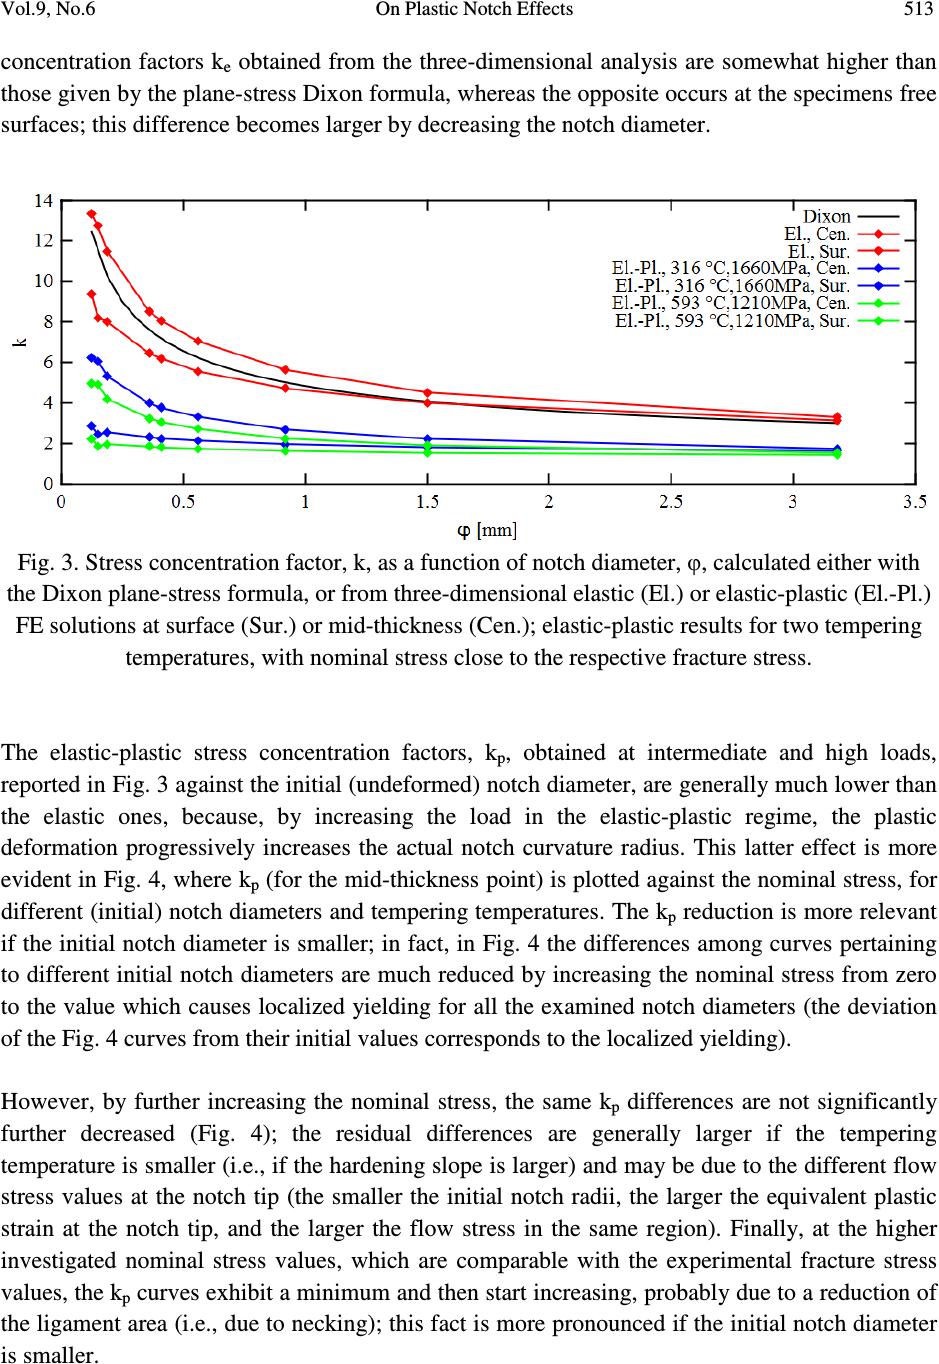 Vol.9, No.6 On Plastic Notch Effects 513 concentration factors k e obtained from the three-dimensional analysis are somewhat higher than those given by the plane-stress Dixon formula, whereas the opposite occurs at the specimens free surfaces; this difference becomes larger by decreasing the notch diameter. Fig. 3. Stress concentration factor, k, as a function of notch diameter, φ, calculated either with the Dixon plane-stress formula, or from three-dimensional elastic (El.) or elastic-plastic (El.-Pl.) FE solutions at surface (Sur.) or mid-thickness (Cen.); elastic-plastic results for two tempering temperatures, with nominal stress close to the respective fracture stress. The elastic-plastic stress concentration factors, k p , obtained at intermediate and high loads, reported in Fig. 3 against the initial (undeformed) notch diameter, are generally much lower than the elastic ones, because, by increasing the load in the elastic-plastic regime, the plastic deformation progressively increases the actual notch curvature radius. This latter effect is more evident in Fig. 4, where k p (for the mid-thickness point) is plotted against the nominal stress, for different (initial) notch diameters and tempering temperatures. The k p reduction is more relevant if the initial notch diameter is smaller; in fact, in Fig. 4 the differences among curves pertaining to different initial notch diameters are much reduced by increasing the nominal stress from zero to the value which causes localized yielding for all the examined notch diameters (the deviation of the Fig. 4 curves from their initial values corresponds to the localized yielding). However, by further increasing the nominal stress, the same k p differences are not significantly further decreased (Fig. 4); the residual differences are generally larger if the tempering temperature is smaller (i.e., if the hardening slope is larger) and may be due to the different flow stress values at the notch tip (the smaller the initial notch radii, the larger the equivalent plastic strain at the notch tip, and the larger the flow stress in the same region). Finally, at the higher investigated nominal stress values, which are comparable with the experimental fracture stress values, the k p curves exhibit a minimum and then start increasing, probably due to a reduction of the ligament area (i.e., due to necking); this fact is more pronounced if the initial notch diameter is smaller.  514 Pasquale Russo Spena, Donato Firrao, Paolo Matteis Vol.9, No.6 Fig. 4. Evolution of the center-plane elastic-plastic stress concentration factor (resulting from three-dimensional elastic-plastic FE simulations) as a function of the applied nominal stress σ, for different notch diameters (legends, mm) and tempering temperatures. 4.2 Notch Tip Stress States The three-dimensional FE solutions allow to appreciate how the notch tip stress state varies by decreasing the ratio between the notch tip diameter and the specimen thickness (from 2.8 to 0.11). In fact, in the elastic case (Fig. 5), the triaxiality ratio σ zz / (σ xx + σ yy ) (being z the specimen thickness direction and y the tensile axis) increases by decreasing the notch diameter, with values ranging from 0.02 for the larger notch diameter to 0.26 for the smaller one; since this ratio theoretically is 0 for the plane stress condition and is equal to the Poisson ratio ν = 0.33 for the plane strain one, it is apparent that the notch tip stress state progressively evolves from the former to the latter condition by decreasing the notch diameter. The triaxiality ratio then evolves in a complex manner in the successive elastic-plastic loading, with values even higher than ν in some instances.  Vol.9, No.6 On Plastic Notch Effects 515 Fig. 5. Notch tip triaxiality ratio (resulting from elastic FE calculations), as a function of the distance z from the specimen central plane, for different notch diameters (legend, mm). 5. EXPERIMENTAL RESULTS The experimental results were originally elaborated by using the Dixon formula to calculate k e , and by hypothesizing that the elastic-plastic stress concentration factor at fracture, named k pf , was equal to UTS / σ f (being UTS the average ultimate tensile stress of the smooth specimens and σ f the nominal fracture stress of the given notched specimen); then the steel notch sensitivity for each tempering temperature was evaluated by plotting k pf against k e . The same experimental results are here reviewed on the basis of the above described numerical simulations: both k e and k pf are obtained by interpolating the above described elastic and elastic- plastic FE solutions, for the relevant tempering temperature and by considering always the mid- thickness case, in respect to the experimental notch diameter φ and fracture stress σ f of each specimen. The original and reviewed results are compared in Fig. 6. Whereas the original Firrao and Spretnak method yielded k pf values always close to 1, and slightly larger than 1 only for the largest k e values and the lowest tempering temperature, the present method shows that k pf increases almost linearly by increasing k e , with a slope which is generally larger for the lower tempering temperatures. In particular, the notch sensitivity (as evaluated from the k pf value for a given k e value) decreases sharply by increasing the tempering temperature from 371 to 510 °C, whereas the results of the material tempered at 316 and 593 °C are almost equal to those obtained by tempering at 371 and 510 °C, respectively.  516 Pasquale Russo Spena, Donato Firrao, Paolo Matteis Vol.9, No.6 Fig. 6. Experimental results elaborated on the basis of either the original method (left), or the present FE calculations (right), for different tempering temperatures (legend, °C). 6. DISCUSSION AND CONCLUSIONS A series of notched tensile tests, with different stress concentration factors, performed in 1971 by Firrao and Spretnak, have been reviewed with the aid of new FE simulations. The comparison between the original experimental results and the new numerical calculations allows to conclude that (contrary to the original hypotheses): 1) the notch tip stress state is not similar in the whole test series, but rather it varies from an almost byaxial stress state (close to plane stress) for the samples having the smaller elastic stress concentration factors (i.e. the larger notch radii), to a significantly triaxial stress state (close to plane stress) in the opposite case, notwithstanding the constant specimen thickness, due to the different ratio of the notch radii to the specimen thickness; 2) the elastic-plastic stress concentration factor at fracture is significantly larger than 1 (up to 4.5 in some instances) and the first principal stress at the notch tip at fracture is significantly larger than the UTS; 3) the steel tempered at different temperatures exhibit different behaviors; in particular, the notch sensitivity decreases sharply by increasing the tempering temperature from 371 to 510 °C. The point 1) was confirmed not only by the elastic-plastic simulations, but also by the elastic ones, hence it is not affected by the uncertainties correlated with the adopted plastic behavior model, and it is considered certain. As it regards point 2), it should be noted that even in standard (smooth) tensile tests the actual tensile stress at fracture is larger than the UTS, because the latter is defined in respect to the undeformed cross-section and by neglecting the stress triaxiality which arises from the necking;  Vol.9, No.6 On Plastic Notch Effects 517 in the present case, in the specimens with the smaller notch radii, first principal stress values much larger than the UTS may also be allowed by the triaxial stress state. However, it must be noted that the elastic-plastic numerical results reported here are affected by the uncertainty due to the large extrapolation of the stress – strain curves, which were originally recorded with strain gages only up to a strain of 0.016. REFERENCES [1] D. Firrao, J.W. Spretnak, 1971, "An evaluation of the Gerard-Papirno ductility ratio characterization of notch ductility in high strength AISI 4340 Steel", Ohio State University Research Foundation Report No. COO-2048-2 to the U.S. Atomic Energy Commission, Columbus, OH, U.S.A., pp. 1-73. [2] D. Firrao, J.W. Spretnak, 1971, "Characterization of notch ductility", abstract in Proceedings of the International Conference on Mechanical Behavior of Materials (ICM) – Kyoto, Japan, Vol. 3, pp. 987-988. [3] D. Firrao, B. De Benedetti, 1997, "Influenza della posizione e dell'acutezza dell'intaglio sulla resistenza a trazione di provini piatti di acciaio da bonifica al Ni-Cr-Mo", Atti V° Convegno Nazionale A.I.A.S., Bari, Italy, pp. 36.1-36.22. [4] J.W. Spretnak, D. Firrao, 1980, "Considerazioni sul ruolo dell'instabilità plastica nella formazione di fratture di tipo duttile", Metallurgia Italiana, No. 72, pp. 525-534. [5] J.R. Dixon, 1960, "Stress distribution around a central crack in a plate loaded in tension; effect of finite width of plate", Journal of the Royal Aeronautical Society, No. 64, pp. 141- 145. |