Paper Menu >>
Journal Menu >>
 Journal of Minerals & Materials Characterization & Engineering, Vol. 9, No.4, pp.331-341, 2010 jmmce.org Printed in the USA. All rights reserved Model for Quantitative Analysis of Phosphorus Removed during Leaching of Iron Oxide Ore in Oxalic Acid Solution C. I. Nwoye1*, C. N. Mbah2, C. C. Nwakwuo3 and A. I. Ogbonna1 1Department of Materials and Metallurgical Engineering, Federal University of Technology, P. M. B 1526, Owerri, Imo State, Nigeria. 2Department of Materials and Metallurgical Engineering. Enugu State University of Science and Technology, P. M. B 01660, Enugu State, Nigeria. 3Department of Material Science, Oxford University, United Kingdom. *Corresponding Author: chikeyn@yahoo.com ABSTRACT Model for quantitative analysis of the concentration of phosphorus removed (relative to the final pH of the leaching solution) during leaching of iron oxide ore in oxalic acid solution has been derived. It was observed that the validity of the model is rooted in the expression lnP = (γ +Nlnγ) where P is the concentration of phosphorus removed during the leaching process, N is 0.57;dissolution coefficient of phosphorus in oxalic acid solution, and γ is the final pH of the leaching solution at the time t, when the concentration of phosphorus is evaluated, and both sides of the expression are correspondingly approximately equal. The model; P = e( γ + 0.57 lnγ) depends on the value of the final pH of the leaching solution which varies with leaching time. The maximum deviation of the model-predicted concentration of removed phosphorus from the corresponding concentration obtained from the experiment was less than 22%. The concentrations of phosphorus removed per unit mass of iron oxide ore added as obtained from experiment and derived model are 3.8329 and 4.0614 mg/kg/g respectively which are in proximate agreement. Keywords: Model, Quantitative Analysis, Phosphorus Removed, Oxalic Acid, Iron Oxide Ore, Leaching.  332 C. I. Nwoye, C. N. Mbah, C. C. Nwakwuo and A. I. Ogbonna Vol.9, No.4 1. INTRODUCTION Several works [1-6] have been carried out to remove phosphorus from steel during steel making. All these works carried out, pointed out low treatment temperature and high oxygen activity as the only essential and unavoidable process conditions which can enhance the rate of dephosphorization. High activity of CaO; a product of decomposition of CaCO3 and a slag forming material is required for enhancement of the dephosphorization process with the phosphorus forming part of the slag. This process involves pyrometallurgy and is capital intensive. It has been reported [7] that the removal of phosphorus from iron can be achieved only by oxidation during steel making, under a basic slag. Nwoye [8] derived a model for predicting the time for dissolution of pre-quantified concentration of phosphorus during leaching of iron oxide ore in oxalic acid solution as: τ = Log P1/4 (1) 1.8 LogT Where T= Leaching temperature ( 0C) in the experiment [9], taken as specified leaching temperature ( 0C) aiding the expected dissolution of phosphorus . N= 1.8 (Dissolution coefficient of phosphorus in oxalic acid solution during leaching of iron oxide ore) determined in the experiment [9]. P = Concentration of dissolved phosphorus (mg/Kg) in the experiment [9], taken as pre-quantified concentration of phosphorus expected to dissolve after a leaching time t (mg/Kg) in the model. τ = Leaching time (sec.) in the experiment [9], taken as time for dissolution of the pre- quantified concentration of phosphorus (hrs) in the model. The model was found to depend on a range of specified leaching temperatures (45-700C) for its validity. It was found [9] that the time for dissolution of any given concentration of phosphorus decreases with increase in the leaching temperature (up to 700C), at initial pH 5.5 and average grain size of 150μm. Nwoye et al. [10] also formulated a model for predicting the concentration of phosphorus removed during leaching of iron oxide ore in oxalic acid solution. The model is expressed as; P = 150.5/μ α (2) It was found to predict the removed phosphorus concentration, with utmost dependence on the final pH of the leaching solution and weight input of the iron oxide ore. The model indicates that the concentration of phosphorus removed is inversely proportional to the product of the weight input of the iron oxide ore and the final pH of the leaching solution. Process conditions considered during the formulation of the model [10] include: leaching temperature of 250C, initial solution pH 5.5 and average ore grain size; 150μm).  Vol.9, No.4 Model for Quantitative Analysis of Phosphorus Removed 333 Nwoye [11] derived a model for the evaluation of the concentration of dissolved phosphorus (relative to the final pH of the leaching solution) during leaching of iron oxide ore in oxalic acid solution. It was observed that the validity of the model is rooted in the relationship lnP = N/α where both sides of the expression are approximately equal to 4. The model expressed as; P = e(12.25/α) (3) depends on the value of the final pH of the leaching solution which varies with leaching time. In all, the positive or negative deviation of the model-predicted phosphorus concentration from its corresponding value obtained from the experiment was found to be less than 22%. Nwoye [12] also derived a model for predicting the concentration of phosphorus removed during leaching of iron oxide ore in oxalic acid solution. The model is expressed as; P = [(1.8(T)τ)]4 (4) was found to be dependent on leaching temperature ranging from 45-700C and specified leaching time of 0.1381hr (497secs.) recorded during experiment, for its validity. It was found that the validity of the model is rooted in the expression (P1/4)/N = (T)τ where both sides of the expression are correspondingly almost equal. The maximum deviation of the model-predicted values of P from the corresponding experimental values was found to be less than 29% which is quite within the range of acceptable deviation limit of experimental results. Model for predictive analysis of the concentration of phosphorus removed (relative to the initial and final pH of the leaching solution) during leaching of iron oxide ore in sulphuric acid solution has been derived by Nwoye and Ndlu [13]. It was observed that the validity of the model is rooted in the mathematical expression; (P/N)1/3 = (eγ/α) where both sides of the relationship are almost equal. The model; P = 4.25(eγ/α)3 (5) shows that the concentration of phosphorus removed is dependent on the values of the initial and final pH of the leaching solution. Biological processes for phosphorus removal have also been evaluated based on the use of several types of fungi, some being oxalic acid producing. Anyakwo and Obot [14] recently presented their results of a study on the use of Aspergillus niger and their cultural filtrates for removing phosphorus from Agbaja (Nigeria) iron oxide ore. The results of this work [14] show that phosphorus removal efficiencies at the end of the 49 days of the leaching process are 81, 63 and 68% for 5, 100 and 250 mesh grain sizes respectively. An attempt has been made in the past [15] to leach Itakpe iron oxide ore using oxalic acid solution in order to determine the maximum concentration of phosphorus that is removable. Results of chemical analysis of the ore indicate that the percentage of phosphorus in the ore is about 1.18%, which from all indication is quite high and likely to affect adversely the mechanical properties of the steel involved; hence the need for dephosphorization. It was reported [15] that phosphorus can be removed from this iron oxide ore through a process associated with hydrometallurgy. Phosphorus was removed at a temperature of 250C and initial solution pH 2.5, leading to the dissolution of the phosphorus oxide formed. This involved using  334 C. I. Nwoye, C. N. Mbah, C. C. Nwakwuo and A. I. Ogbonna Vol.9, No.4 acid leaching process to remove phosphorus from the iron oxide ore in readiness for steel making process. The aim of this work is to derive a model for quantitative analysis of the concentration of phosphorus removed relative to the final pH of the solution during leaching of Itakpe (Nigerian) iron oxide ore using oxalic acid solution. This derivation is embarked on in furtherance of the previous work [15]. 2. MODEL The solid phase (ore) is assumed to be stationary, contains the un-leached iron remaining in the ore. Hydrogen ions from the oxalic acid attack the ore within the liquid phase in the presence of oxygen. 2.1 Model Formulation Experimental data obtained from research work [15] carried out at SynchroWell Research Laboratory, Enugu were used for this work. Results of the experiment as presented in report [15] and used for the model formulation are as shown in Table 1. Computational analysis of the experimental data [15] shown in Table 1, resulted to Table 2 which indicate that; lnP = (γ +Nlnγ) (approximately) (6) P = e(γ +Nlnγ) (7) Introducing the value of N into equation (7) P = e( γ + 0.57 lnγ) (8) Where P = Concentration of phosphorus removed during leaching of iron oxide ore using oxalic acid (mg/Kg) N= 0.57; (Dissolution coefficient of phosphorus in oxalic acid solution) determined in the experiment. [15] γ = Final pH of the leaching solution at the time t, when the concentration of phosphorus is evaluated. Equation (8) is the derived model. 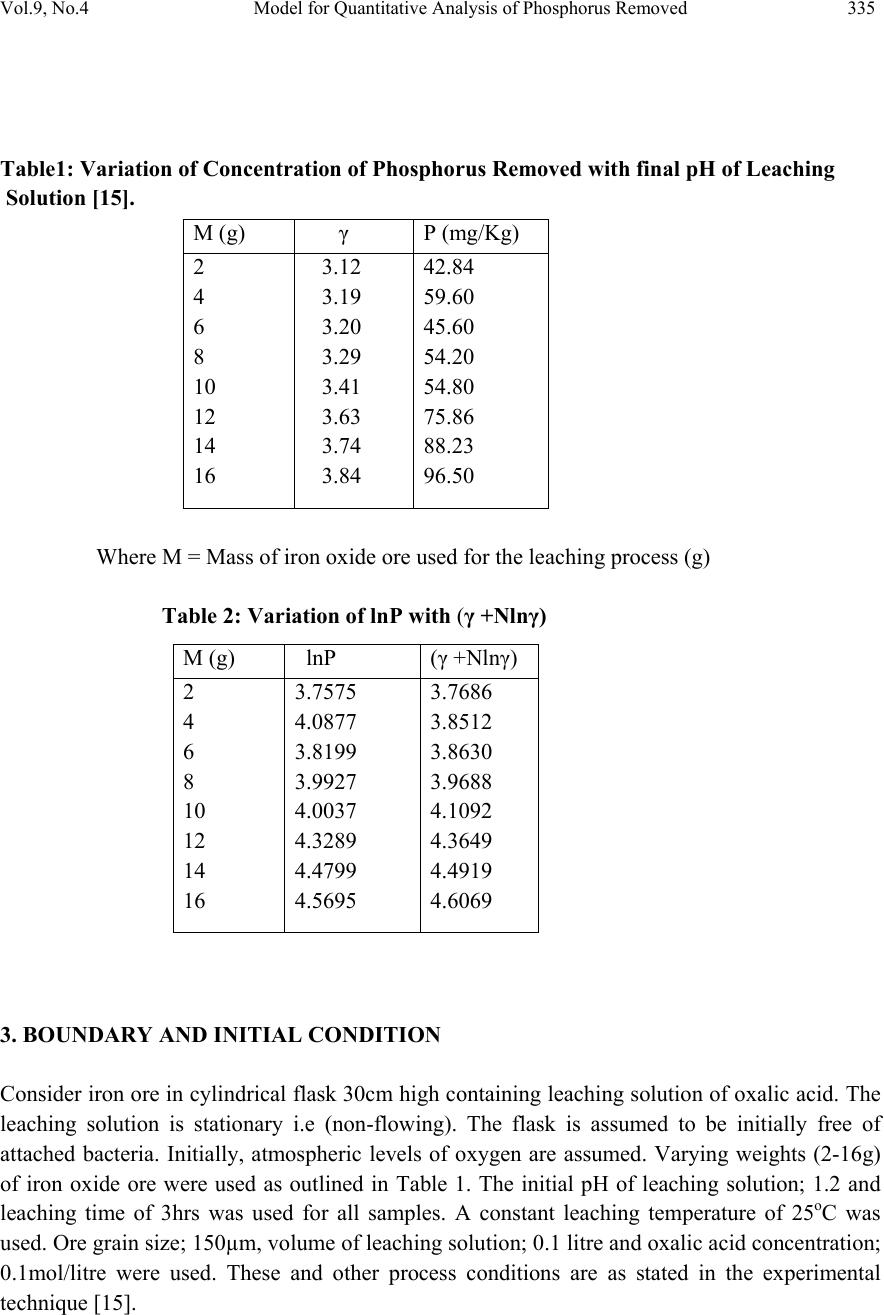 Vol.9, No.4 Model for Quantitative Analysis of Phosphorus Removed 335 Table1: Variation of Concentration of Phosphorus Removed with final pH of Leaching Solution [15]. Where M = Mass of iron oxide ore used for the leaching process (g) Table 2: Variation of lnP with (γ +Nlnγ) 3. BOUNDARY AND INITIAL CONDITION Consider iron ore in cylindrical flask 30cm high containing leaching solution of oxalic acid. The leaching solution is stationary i.e (non-flowing). The flask is assumed to be initially free of attached bacteria. Initially, atmospheric levels of oxygen are assumed. Varying weights (2-16g) of iron oxide ore were used as outlined in Table 1. The initial pH of leaching solution; 1.2 and leaching time of 3hrs was used for all samples. A constant leaching temperature of 25oC was used. Ore grain size; 150µm, volume of leaching solution; 0.1 litre and oxalic acid concentration; 0.1mol/litre were used. These and other process conditions are as stated in the experimental technique [15]. M (g) γ P (mg/Kg) 2 4 6 8 10 12 14 16 3.12 3.19 3.20 3.29 3.41 3.63 3.74 3.84 42.84 59.60 45.60 54.20 54.80 75.86 88.23 96.50 M (g) lnP (γ +Nlnγ) 2 4 6 8 10 12 14 16 3.7575 4.0877 3.8199 3.9927 4.0037 4.3289 4.4799 4.5695 3.7686 3.8512 3.8630 3.9688 4.1092 4.3649 4.4919 4.6069 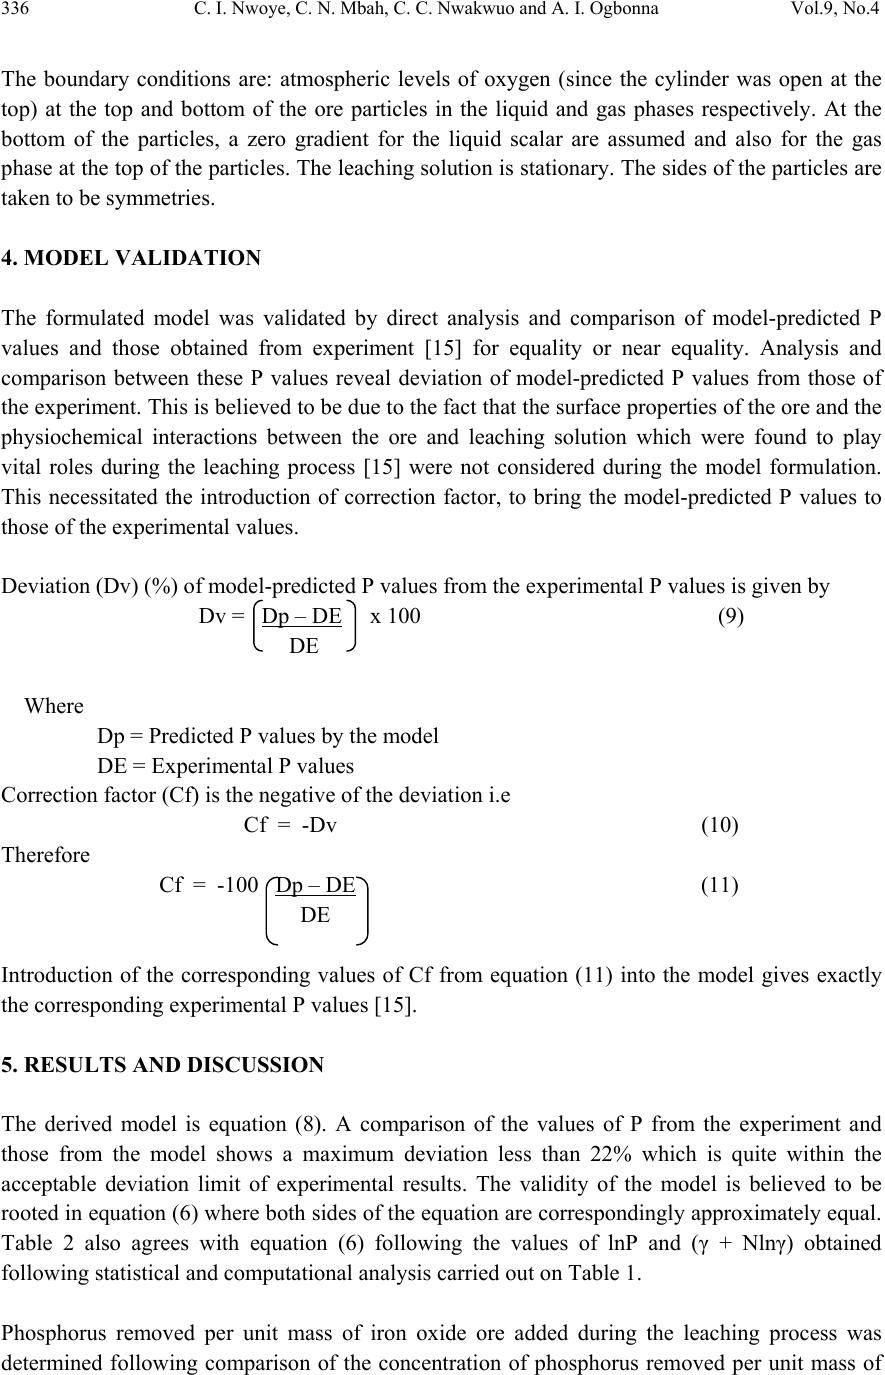 336 C. I. Nwoye, C. N. Mbah, C. C. Nwakwuo and A. I. Ogbonna Vol.9, No.4 The boundary conditions are: atmospheric levels of oxygen (since the cylinder was open at the top) at the top and bottom of the ore particles in the liquid and gas phases respectively. At the bottom of the particles, a zero gradient for the liquid scalar are assumed and also for the gas phase at the top of the particles. The leaching solution is stationary. The sides of the particles are taken to be symmetries. 4. MODEL VALIDATION The formulated model was validated by direct analysis and comparison of model-predicted P values and those obtained from experiment [15] for equality or near equality. Analysis and comparison between these P values reveal deviation of model-predicted P values from those of the experiment. This is believed to be due to the fact that the surface properties of the ore and the physiochemical interactions between the ore and leaching solution which were found to play vital roles during the leaching process [15] were not considered during the model formulation. This necessitated the introduction of correction factor, to bring the model-predicted P values to those of the experimental values. Deviation (Dv) (%) of model-predicted P values from the experimental P values is given by Dv = Dp – DE x 100 (9) DE Where Dp = Predicted P values by the model DE = Experimental P values Correction factor (Cf) is the negative of the deviation i.e Cf = -Dv (10) Therefore Cf = -100 Dp – DE (11) DE Introduction of the corresponding values of Cf from equation (11) into the model gives exactly the corresponding experimental P values [15]. 5. RESULTS AND DISCUSSION The derived model is equation (8). A comparison of the values of P from the experiment and those from the model shows a maximum deviation less than 22% which is quite within the acceptable deviation limit of experimental results. The validity of the model is believed to be rooted in equation (6) where both sides of the equation are correspondingly approximately equal. Table 2 also agrees with equation (6) following the values of lnP and (γ + Nlnγ) obtained following statistical and computational analysis carried out on Table 1. Phosphorus removed per unit mass of iron oxide ore added during the leaching process was determined following comparison of the concentration of phosphorus removed per unit mass of  Vol.9, No.4 Model for Quantitative Analysis of Phosphorus Removed 337 iron oxide ore (added) obtained by calculations involving experimental results as well as derived model. 5.1 Determination of the Concentration of Phosphorus Removed per Unit Mass of Iron Oxide Ore Added Concentration of phosphorus removed during leaching in oxalic acid solution per unit mass Pm (mg/kg/g) is calculated from the equation; Pm = P/m (12) Therefore, a plot of concentration of phosphorus removed against mass of iron oxide ore added (as in Fig.1) gives a slope, S at points (96.5, 16) and (42.84, 2) following their substitution into the mathematical expression; S = ΔP/Δm (13) Eqn. (13) is detailed as S = P 2 - P 1 / m 2 - m 1 (14) Where ΔP = Change in the concentrations of phosphorus removed P 2 , P 1 at mass values m 2 , m 1 . Considering the points (96.5, 16) and (42.84, 2) for (P 2 , m 2 ) and (P 1 , m 1 ) respectively, and substituting them into eqn. (14), gives the slope as 3.8329 mg/kg/g which is the concentration of phosphorus removed per unit mass added during the actual experimental leaching process . R 2 = 0.80 1 0 20 40 60 80 10 0 12 0 0510152 0 Mass of iron o xide o re added (g) Fig.1-Effect of mass of iron oxide ore (added) on the concentration of phosphorus removed as obtained from experiment [15]. R 2 = 0.9136 0 20 40 60 80 10 0 12 0 33.54 Fina l pH of le a c hing s o lu t io n Fig.2-Effect of final pH on the concentration of phosphorus removed as obtained from experiment [15],  338 C. I. Nwoye, C. N. Mbah, C. C. Nwakwuo and A. I. Ogbonna Vol.9, No.4 Also similar plot (as in Fig. 2) using model-predicted results gives a slope. Considering points (100.18, 16) and (43.32, 2) for (P 2 , m 2 ) and (P 1 , m 1 ) respectively and substituting them into eqn. (14) gives the value of slope, S as 4.0614 mg/kg/g. This is the model-predicted concentration of phosphorus removed per unit mass of iron oxide ore used for the leaching process. A comparison of these two values of removed phosphorus concentrations per unit mass of iron oxide ore used shows proximate agreement. This indicates a very high degree of validity for the model. An ideal comparison of the concentration of phosphorus removed per unit mass of iron oxide ore used as obtained from experiment and as predicted by the model for the purpose of testing the validity of the model is achieved by considering the R2 values. The values of the correlation coefficient, R calculated from the equation; R = √R2 (15) using the r-squared values (coefficient of determination) from Figs.1-4 show a very close correlation;(0.8950),(0.9558) for Figs. 1 & 2 and (0.9108),(0.9673) for Figs. 3 & 4 between values of the concentration of phosphorus removed obtained from experiment and derived model respectively. This also shows that the model-predicted concentrations of phosphorus removed are very much in proximate agreement with the corresponding concentration of phosphorus removed obtained from experiment [15]. Fig.4 shows that final pH contributed more significantly to the validity of the model compared with the mass of iron oxide ore added (Fig.3). This is shown in their respective R2 values. R 2 = 0.8296 0 20 40 60 80 10 0 12 0 0510 15 20 Mass of iron oxide ore added (g) Fig.3-Effect of mass of iron oxide ore (added) on the concentration of phosphorus removed as predicted by derived model R2 = 0.9356 0 20 40 60 80 10 0 12 0 33.54 Fina l pH of le a c hing s olut ion Fig.4-Effect of final pH on the concentration of phosphorus removed as predicted by derived model 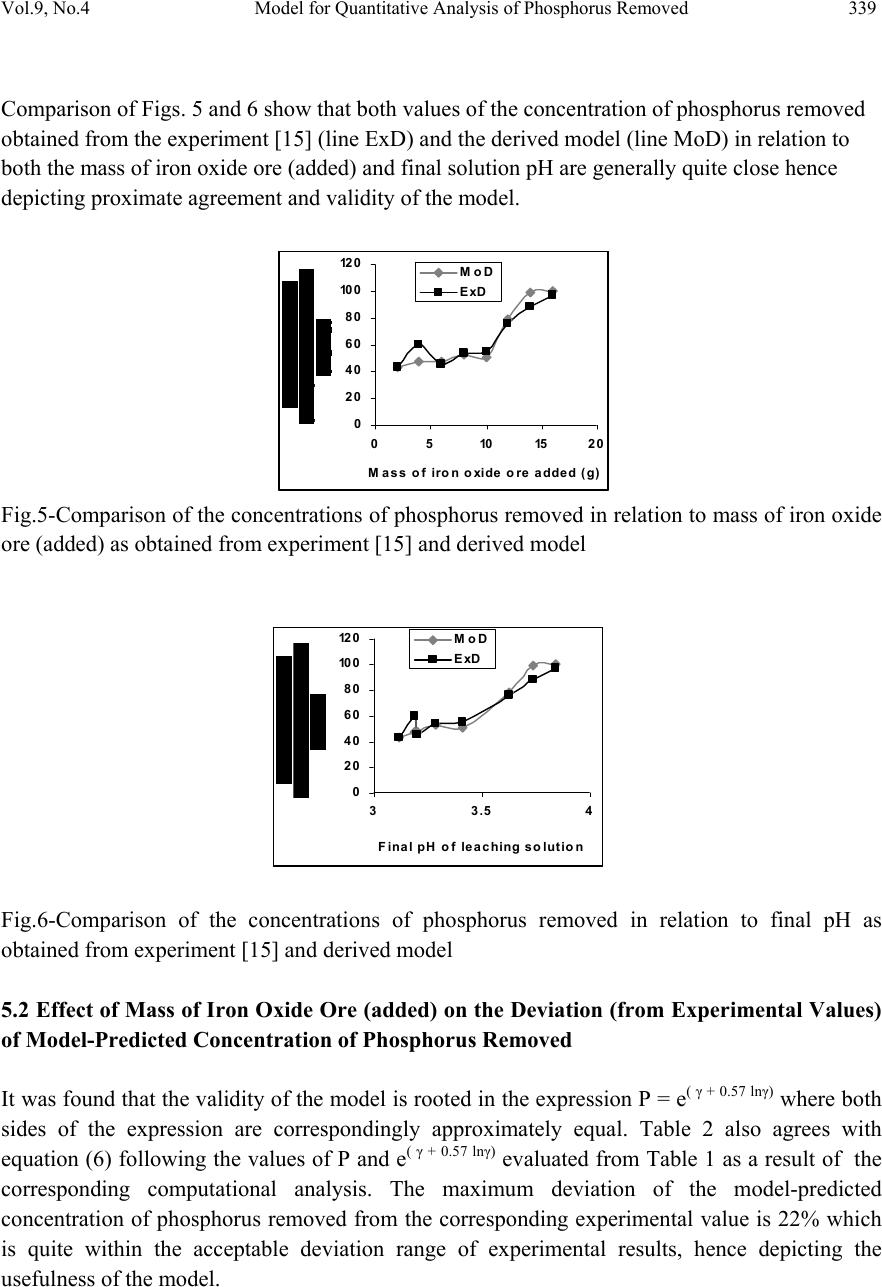 Vol.9, No.4 Model for Quantitative Analysis of Phosphorus Removed 339 Comparison of Figs. 5 and 6 show that both values of the concentration of phosphorus removed obtained from the experiment [15] (line ExD) and the derived model (line MoD) in relation to both the mass of iron oxide ore (added) and final solution pH are generally quite close hence depicting proximate agreement and validity of the model. 0 20 40 60 80 10 0 12 0 05101520 Mass of iron oxide ore added (g) MoD ExD Fig.5-Comparison of the concentrations of phosphorus removed in relation to mass of iron oxide ore (added) as obtained from experiment [15] and derived model 0 20 40 60 80 10 0 12 0 33.54 Fina l pH of le a c hing s olution MoD ExD Fig.6-Comparison of the concentrations of phosphorus removed in relation to final pH as obtained from experiment [15] and derived model 5.2 Effect of Mass of Iron Oxide Ore (added) on the Deviation (from Experimental Values) of Model-Predicted Concentration of Phosphorus Removed It was found that the validity of the model is rooted in the expression P = e( γ + 0.57 lnγ) where both sides of the expression are correspondingly approximately equal. Table 2 also agrees with equation (6) following the values of P and e( γ + 0.57 lnγ) evaluated from Table 1 as a result of the corresponding computational analysis. The maximum deviation of the model-predicted concentration of phosphorus removed from the corresponding experimental value is 22% which is quite within the acceptable deviation range of experimental results, hence depicting the usefulness of the model. 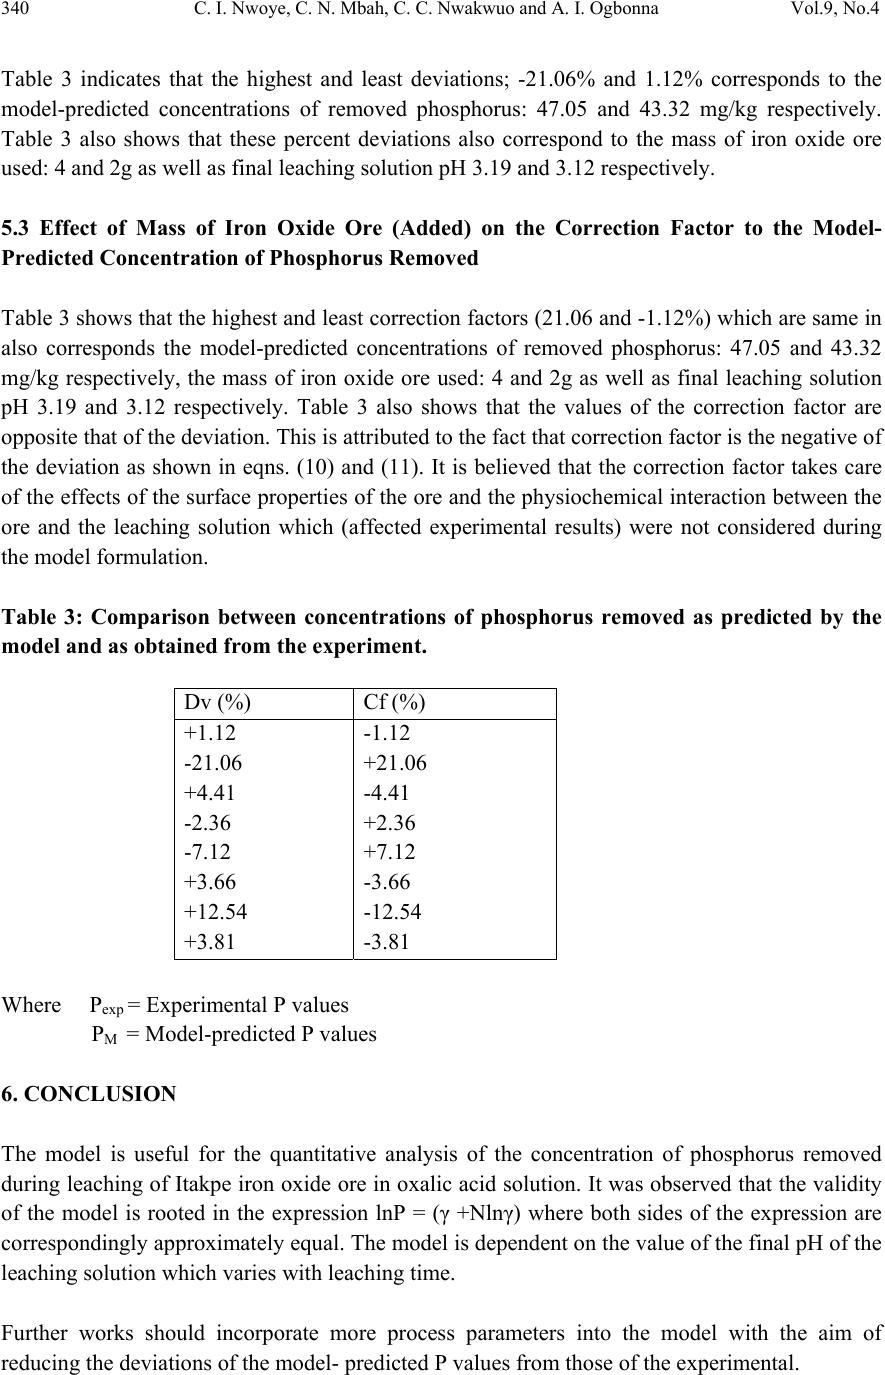 340 C. I. Nwoye, C. N. Mbah, C. C. Nwakwuo and A. I. Ogbonna Vol.9, No.4 Table 3 indicates that the highest and least deviations; -21.06% and 1.12% corresponds to the model-predicted concentrations of removed phosphorus: 47.05 and 43.32 mg/kg respectively. Table 3 also shows that these percent deviations also correspond to the mass of iron oxide ore used: 4 and 2g as well as final leaching solution pH 3.19 and 3.12 respectively. 5.3 Effect of Mass of Iron Oxide Ore (Added) on the Correction Factor to the Model- Predicted Concentration of Phosphorus Removed Table 3 shows that the highest and least correction factors (21.06 and -1.12%) which are same in also corresponds the model-predicted concentrations of removed phosphorus: 47.05 and 43.32 mg/kg respectively, the mass of iron oxide ore used: 4 and 2g as well as final leaching solution pH 3.19 and 3.12 respectively. Table 3 also shows that the values of the correction factor are opposite that of the deviation. This is attributed to the fact that correction factor is the negative of the deviation as shown in eqns. (10) and (11). It is believed that the correction factor takes care of the effects of the surface properties of the ore and the physiochemical interaction between the ore and the leaching solution which (affected experimental results) were not considered during the model formulation. Table 3: Comparison between concentrations of phosphorus removed as predicted by the model and as obtained from the experiment. Where Pexp = Experimental P values PM = Model-predicted P values 6. CONCLUSION The model is useful for the quantitative analysis of the concentration of phosphorus removed during leaching of Itakpe iron oxide ore in oxalic acid solution. It was observed that the validity of the model is rooted in the expression lnP = (γ +Nlnγ) where both sides of the expression are correspondingly approximately equal. The model is dependent on the value of the final pH of the leaching solution which varies with leaching time. Further works should incorporate more process parameters into the model with the aim of reducing the deviations of the model- predicted P values from those of the experimental. Dv (%) Cf (%) +1.12 -21.06 +4.41 -2.36 -7.12 +3.66 +12.54 +3.81 -1.12 +21.06 -4.41 +2.36 +7.12 -3.66 -12.54 -3.81 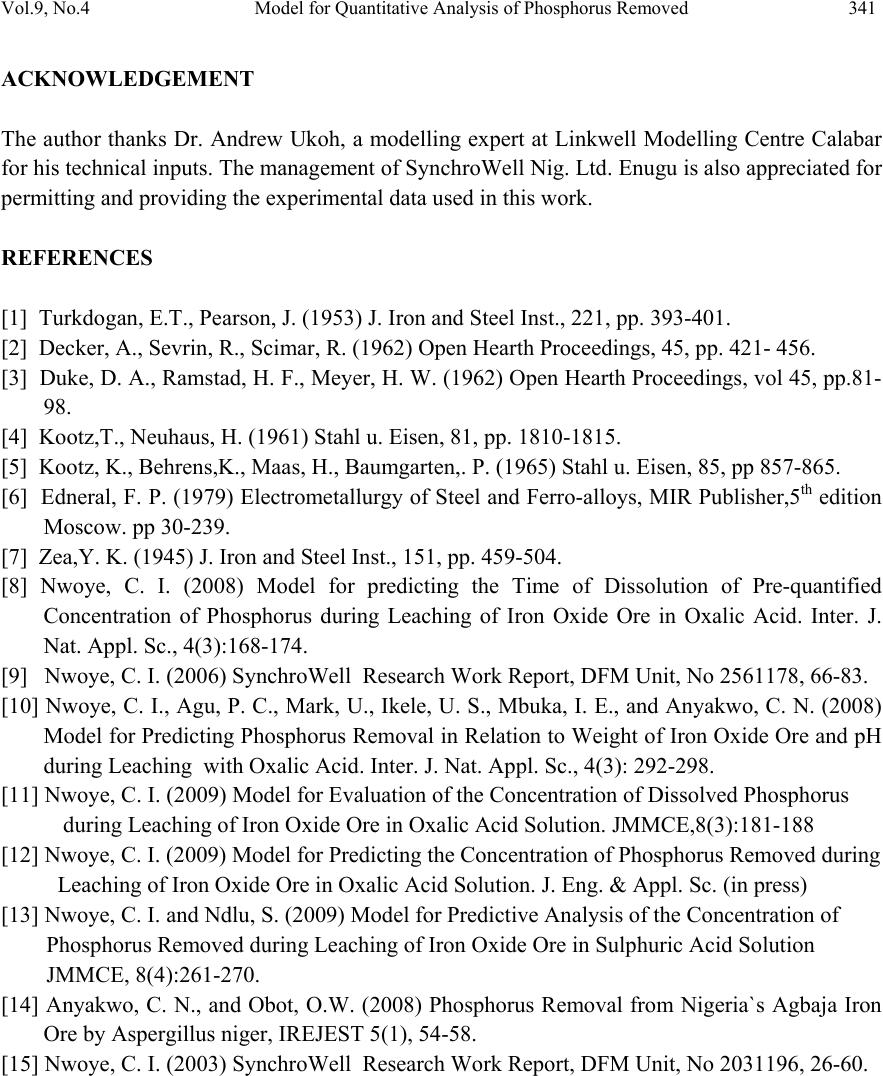 Vol.9, No.4 Model for Quantitative Analysis of Phosphorus Removed 341 ACKNOWLEDGEMENT The author thanks Dr. Andrew Ukoh, a modelling expert at Linkwell Modelling Centre Calabar for his technical inputs. The management of SynchroWell Nig. Ltd. Enugu is also appreciated for permitting and providing the experimental data used in this work. REFERENCES [1] Turkdogan, E.T., Pearson, J. (1953) J. Iron and Steel Inst., 221, pp. 393-401. [2] Decker, A., Sevrin, R., Scimar, R. (1962) Open Hearth Proceedings, 45, pp. 421- 456. [3] Duke, D. A., Ramstad, H. F., Meyer, H. W. (1962) Open Hearth Proceedings, vol 45, pp.81- 98. [4] Kootz,T., Neuhaus, H. (1961) Stahl u. Eisen, 81, pp. 1810-1815. [5] Kootz, K., Behrens,K., Maas, H., Baumgarten,. P. (1965) Stahl u. Eisen, 85, pp 857-865. [6] Edneral, F. P. (1979) Electrometallurgy of Steel and Ferro-alloys, MIR Publisher,5th edition Moscow. pp 30-239. [7] Zea,Y. K. (1945) J. Iron and Steel Inst., 151, pp. 459-504. [8] Nwoye, C. I. (2008) Model for predicting the Time of Dissolution of Pre-quantified Concentration of Phosphorus during Leaching of Iron Oxide Ore in Oxalic Acid. Inter. J. Nat. Appl. Sc., 4(3):168-174. [9] Nwoye, C. I. (2006) SynchroWell Research Work Report, DFM Unit, No 2561178, 66-83. [10] Nwoye, C. I., Agu, P. C., Mark, U., Ikele, U. S., Mbuka, I. E., and Anyakwo, C. N. (2008) Model for Predicting Phosphorus Removal in Relation to Weight of Iron Oxide Ore and pH during Leaching with Oxalic Acid. Inter. J. Nat. Appl. Sc., 4(3): 292-298. [11] Nwoye, C. I. (2009) Model for Evaluation of the Concentration of Dissolved Phosphorus during Leaching of Iron Oxide Ore in Oxalic Acid Solution. JMMCE,8(3):181-188 [12] Nwoye, C. I. (2009) Model for Predicting the Concentration of Phosphorus Removed during Leaching of Iron Oxide Ore in Oxalic Acid Solution. J. Eng. & Appl. Sc. (in press) [13] Nwoye, C. I. and Ndlu, S. (2009) Model for Predictive Analysis of the Concentration of Phosphorus Removed during Leaching of Iron Oxide Ore in Sulphuric Acid Solution JMMCE, 8(4):261-270. [14] Anyakwo, C. N., and Obot, O.W. (2008) Phosphorus Removal from Nigeria`s Agbaja Iron Ore by Aspergillus niger, IREJEST 5(1), 54-58. [15] Nwoye, C. I. (2003) SynchroWell Research Work Report, DFM Unit, No 2031196, 26-60. |

