Open Journal of Statistics, 2012, 2, 346-351
http://dx.doi.org/10.4236/ojs.2012.23042 Published Online July 2012 (http://www.SciRP.org/journal/ojs)
Research Performance Assessment Based on T-Indicator
Ling Zhang, Xin Tan, Qing Du, Juan Wang
Human Resources Department, Tianjin University, Tianjin, China
Email: rscwangjuan@tju.edu.cn, lingzhang@tju.edu.cn
Received April 12, 2012; revised May 16, 2012; accepted May 29, 2012
ABSTRACT
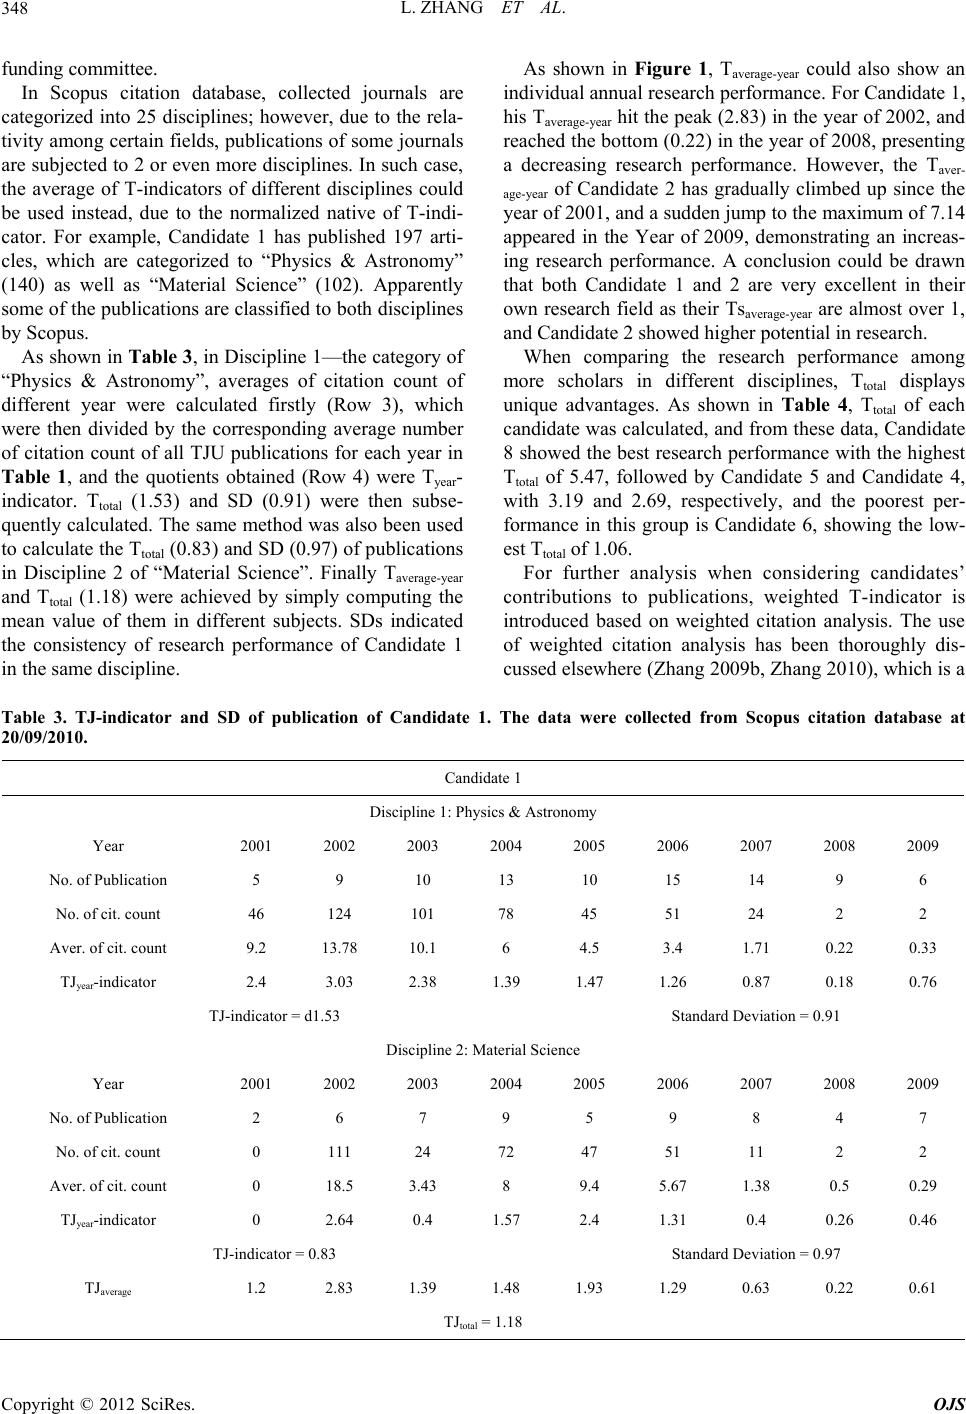
A novel indicator named after Tianjin University (TJU)-T-indicator-was investigated as an effective supplement of es-
tablished Article Assessment System of Tianjin University, aiming to correct differences among fields. Based on nor-
malized citation counts, T-indicator could give the order of research performance of researchers or groups in different
disciplines. Weighted citation analysis was also introduced in this method to judge the contribution of researchers to
their research outcomes. A given example was used to thoroughly discuss this evaluation method, via the application of
derivative indices, including Tyear, Taverage, Ttotal and weighted-Ttotal.
Keywords: Research Performance Assessment; TJ-Indicator; Normalization; Citation Counts
1. Introduction
Research performance assessment (RPA) plays important
roles in universities and research institutions, especially
in the process of recruitment, academic promotion, of-
fering tenure, granting, etc. The general indices of RPA
include publications, patents, awards, and grants. It is
hard to evaluate the quality level of patents, awards, and
grants among different institutions and countries as there
is no same standard. However, journal publication, mos tly
published after peer reviews, is a good and unique index
for internal and external comparison. Nowadays, journal
publication has been widely used officially or subcon-
sciously in the process of RPA.
An article assessment system has been successfully
established based on both Tianjin University and nine
key Chinese Universities’ academic disciplinary bench-
marks [1]. With this scientific benchmarking system, the
quality of a researcher’s papers could be easily located in
a percentile scale in corresponding field and within cer-
tain groups. Several factors, including total number of
papers, order of authors, impact factor of journals, cita-
tion count, h-index [2], e-index [3], a-index [4], m-quo-
tient [2], as well as weighted citation analysis [5], were
also utilized for both quantity and quality analysis.
This article assessment system has played a significant
role as an important part of RPA in Tianjin University.
However, with unique advantages in comparing re-
searchers or groups in a same field, it is hard to tell their
RPA in different fields. To improve this article assess-
ment system, citation counts were normalized for cor-
recting differences among fields. Breaking the boundary
of disciplines, this modified citation-based article as-
sessment system could easily give the order of research
performance of researchers or groups even in different
disciplines.
2. Methods
The average number of citation count of all TJU publica-
tions from Scopus citation database are obtained for each
discipline and for each year from the year of 2001 to the
year of 2009, based on the accumulation of citations
from the year of publication to the current year (Equation
(1)).
,
1
1j
j
n
A
y
ij
i
j
CC
n
C
(1)
where ,ij
are the citations received by the ith paper in
the year j, and
j
n is number of papers published in the
year j. On the left hand of Equation (1),
j
A
C represents
the average number of citations received in the period
from year j to 2009 by papers published in the year j.
To obtain the total T-indicator (Ttotal), annual T-indi-
cator (Tyear) are required to be calculated firstly: the sum
of a researcher or group’s actual number of citations of
all publications is divided by the above average number
for each year in the same discipline (Equation (2)).
,
1
1
j
j
j
m
ij
i
yjy
C
TJ mAC
(2)
where
j
m is the number of papers published by an in-
dividual researcher or a group of researchers in the year j,
and
y
j
TJ is the ratio of the average citations received
C
opyright © 2012 SciRes. OJS
L. ZHANG ET AL. 347
for an individual researcher or a group of researchers in
the year j, over the average number of citations received
in the year j of the whole university, both in the same
discipline.
The average number of Tyear is the T-indicator (Equa-
tion (3)), and the standard deviation (SD) is also calcu-
lated to show the stability of research performance
(Equation (4)).

2
1
21
total 1
j
y
y
jy
TJ
yy


TJ (3)
2
1
y
jy
TJ
TJ
SD
2
total
21
1
j
yTJ
yy
 (4)
where y1 is the first year of the period in which the re-
search performance of an individual researcher or a
group of researchers are required to be analyzed, and y2
is last year of this period required to be analyzed.
3. Results and Discussion
Table of Mean of Citation Count of all TJU Publications
is prepared (Table 1) for 25 disciplines from the year of
2001 to the year of 2009. Total number of TJU publica-
tions over 9 years and of each year, as well as the annual
mean citation count were all included for every category
in this table. For example, in category of “Agricultural
and Biological”, total number of TJU publication is 388;
the number of publications in the year of 2001 and the
mean citation coun t is 11 and 14.18, respectively.
The following example is taken to discuss the applica-
tion of T-indicator. Tianjin University announced the
competition for a 3-level award funding for research
performance, and there are 8 candidates entered the last
round. In the process of research publication assessment,
as shown in Table 2, all of them are excellent in their
research fields, and some of them have similar number of
publications (Cand idate 3 and Candidate 5), total citation
count (Candidate 3 and Candidate 8), and average cita-
tion count (Candidate 1 and Candidate 5) as well. Fur-
thermore, considering the property of citation frequency
in different research areas, it is very hard to simply com-
pare them via the common indices, including citation
count, h-index, e-index, etc., as mentioned above. How-
ever, T-indicator, based on normalized citation count,
could be conveniently used here to give the order of re-
search performance as a helpful reference to the award
Table 1. The mean of citation count of all TJU publications. The data were collected from Scopus citation database at
10/08/2010. (The table is too big to present entirely here; for details please refer to the Appendix).
2001 2002 2003
Subject Total Pub.
No. Mean No. Mean No. Mean
Agricultural and Biologic a l S c ie n c e s 32 11 14.2 5 13 16 7.94
Arts and Humanities 0 0 0 0 0 0 0
Biochemistry, Genetics and Molecular Biology 219 36 14.6 50 19.28 133 9.92
Business, Management and Accounting 6 0 0 2 15.5 4 0.25
Chemical Engineering 460 126 5.32 162 7.72 172 6.73
Table 2. Publication details of 8 candidates for the award funding for research performance. The data were collected from
Scopus citation database at 20/09/2010.
No. College Total pub. Total citation count Average citation count
1 College of Science 197 994 5.05
2 College of Science 134 401 2.99
3 College of Science 157 2619 16.68
4 College of Precision Instrument and Opto-electronics Engineering 176 1098 6.24
5 College of Precision Instrument and Opto -electronics Engineeri n g 152 813 5.35
6 College of Material Science and Engineeri ng 105 493 4.7
7 College of Chemical Engineering and Technology 67 735 10.97
8 College of Environ ment Science and Technology 125 2677 21.42
Copyright © 2012 SciRes. OJS
L. ZHANG ET AL.
348
funding committee.
In Scopus citation database, collected journals are
categorized into 25 disciplines; however, due to the rela-
tivity among certain fields, publications of some journals
are subjected to 2 or even more disciplines. In such case,
the average of T-indicators of different disciplines could
be used instead, due to the normalized native of T-indi-
cator. For example, Candidate 1 has published 197 arti-
cles, which are categorized to “Physics & Astronomy”
(140) as well as “Material Science” (102). Apparently
some of the publications are classified to both disciplines
by Scopus.
As shown in Table 3, in Discipline 1—the categ ory of
“Physics & Astronomy”, averages of citation count of
different year were calculated firstly (Row 3), which
were then divided by the corresponding average number
of citation count of all TJU publications for each year in
Table 1, and the quotients obtained (Row 4) were Tyear-
indicator. Ttotal (1.53) and SD (0.91) were then subse-
quently calculated. The same method was also been used
to calculate the T total (0.83) and SD (0.97) of publications
in Discipline 2 of “Material Science”. Finally Taverage-year
and Ttotal (1.18) were achieved by simply computing the
mean value of them in different subjects. SDs indicated
the consistency of research performance of Candidate 1
in the same discipline.
As shown in Figure 1, Taverage-year could also show an
individual annual research performance. For Candidate 1,
his Taverage-year hit the peak (2.83) in the year of 2002, and
reached the bottom (0.22) in the year of 2008, presenting
a decreasing research performance. However, the Taver-
age-year of Candidate 2 has gradually climbed up since the
year of 2001, and a sudden jump to the maximum of 7.14
appeared in the Year of 2009, demonstrating an increas-
ing research performance. A conclusion could be drawn
that both Candidate 1 and 2 are very excellent in their
own research field as their Tsaverage-year are almost over 1,
and Candidate 2 showed higher potential in research.
When comparing the research performance among
more scholars in different disciplines, Ttotal displays
unique advantages. As shown in Table 4, Ttotal of each
candidate was calculated, and from these data, Candidate
8 showed the best research performance with the highest
Ttotal of 5.47, followed by Candidate 5 and Candidate 4,
with 3.19 and 2.69, respectively, and the poorest per-
formance in this group is Candidate 6, showing the low-
est Ttotal of 1.06.
For further analysis when considering candidates’
contributions to publications, weighted T-indicator is
introduced based on weighted citation analysis. The use
of weighted citation analysis has been thoroughly dis-
cussed elsewhere (Zhang 2009 b, Zhang 2010 ), which is a
Table 3. TJ-indicator and SD of publication of Candidate 1. The data were collected from Scopus citation database at
20/09/2010.
Candidate 1
Discipline 1: Physics & Astronomy
Year 2001 2002 2003 2004 2005 2006 2007 2008 2009
No. of Publication 5 9 10 13 10 15 14 9 6
No. of cit. count 46 124 101 78 45 51 24 2 2
Aver. of cit. count 9.2 13.78 10.1 6 4.5 3.4 1.71 0.22 0.33
TJyear-indicator 2.4 3.03 2.38 1.39 1.47 1.26 0.87 0.18 0.76
TJ-indicator = d1.53 Standard Deviation = 0.91
Discipline 2: Material Science
Year 2001 2002 2003 2004 2005 2006 2007 2008 2009
No. of Publication 2 6 7 9 5 9 8 4 7
No. of cit. count 0 111 24 72 47 51 11 2 2
Aver. of cit. count 0 18.5 3.43 8 9.4 5.67 1.38 0.5 0.29
TJyear-indicator 0 2.64 0.4 1.57 2.4 1.31 0.4 0.26 0.46
TJ-indicator = 0.83 Standard Deviation = 0.97
TJaverage 1.2 2.83 1.39 1.48 1.93 1.29 0.63 0.22 0.61
TJtotal = 1.18
Copyright © 2012 SciRes. OJS
L. ZHANG ET AL. 349
Figure 1. TJ-indicator vs. year of Candidate 1 and Candidate 2. (The data were collected from Scopus citation database at
20/09/2010).
Table 4. TJ-indicator and SD of publication of 8 candidates. The data were collected from Scopus citation database at
20/09/2010.
Discipline 1 Discipline 2 Average
No. Field TJ1 SD1 Field TJ2 SD2 TJtotal
1 Physics & Astronomy 1.53 0.9 Materials Science 0. 8 3 1 1.18
2 Engineering 2.1 2.8 Physics & Astronomy 1.09 1.7 1.6
3 Biochemistry, Genetics and Molecular Biology 1.86 1.1 Engineering 1.13 1.7 1.5
4 Physics & Astronomy 5.23 4.5 Engineering 0.16 0.2 2.69
5 Engineering 3.1 1.5 Physics & Astronomy 3.28 1.4 3.19
6 Materials Science 1.68 0.4 Physics & Astronomy 0.44 0.7 1.06
7 Materials Science 2.57 1.5 Chemistry 0.53 0.7 1.55
8 Chemistry 7.79 9.6 Materials Science 3.15 5.4 5.47
quantitative scheme to describe the contribution of co-
authors via weight coefficient. Basically weight coeffi-
cients for the first and corresponding authors are 1 for
both, and the correspondence of the second, third, and
the other authors are decreased sequentially. Weighted
T-indicators of each candidate were obtained in Table 5.
The weighted T-indicators were very similar to the nor-
mal T-indicators of both Candidates 3 (1.50 and 1.44,
respectively) and Candidate 4 (2.69 and 2.11, respec-
tively), showing their high research contributions to all
publications; however, the big difference of these two
indicators of Candidate 2 (1.60 and 0.77, respectively)
and Candidate 7 (1.55 and 0.91, respectively) demon-
strated their un-ideal contribution to all publications.
Consequently, the order of research performance of these
candidates based on weighted T-indicator could be listed
as Candidate 8, Candidate 4, Candidate 5, Candidate 3,
Candidate 1, Candidate 7, Candidate 2 and Candidate 6,
without the consideration of differences among disci-
plines.
As described above, the research performance of these
8 candidates was quantitatively analyzed via this assess-
ment method, which could give helpful reference to the
award funding committee but still need the comprehen-
sive qualitative evalu ation via peer reviews, to get a final
reasonable evaluation result of research performance of
Copyright © 2012 SciRes. OJS
L. ZHANG ET AL.
350
Table 5. Weighted TJ-indicator of publication of 8 candidates. The data were collected from Scopus citation database at
20/09/2010.
Discipline 1 Discipline 2 Averag e
No. Field Weighted-TJ1 Field Weighted-TJ2 W-TJtotal
1 Physics & Astronomy 1.07 Materials Science 0.84 0.95
2 Engineering 1.07 Physics & Astronomy 0.48 0.77
3 Biochemistry, Genetics and Molecu lar Biology 1.78 Engineering 1.1 1.44
4 Physics & Astronomy 4.17 Engineering 0.06 2.11
5 Engineering 2.93 Physics & Astronomy 1.12 2.02
6 Materials Science 0.71 Physics & Astr o n omy 0.67 0.69
7 Materials Science 1.32 Chemistry 0.51 0.91
8 Chemistry 6.19 Materials Science 2.29 4.24
these candidates.
4. Conclusion
This new article assessment method, via the application
of T-indicators, was established successfully for correct-
ing differences among disciplines. An example was giv en
to describe this whole assessment procedure which could
not only give the research performance curve with year
of candidate each, but also could provide the order of
their research performance. Last but not least, because of
the increasing citation times with time, the Table of the
Mean of Citation Count of all TJU Publications is re-
quired to be updated at least twice annually.
5. Acknowledgements
We thank Prof. Chun-Ting Zhang of Tianjin University
for helpful discussions and revisions. Ling Zhang thanks
the financial support from The Ministry of education of
Humanities and social science research fund plan/Youth
Fund/Self-financing project, 11YJC870036.
REFERENCES
[1] L. Zhang, H. Zhao, Q. Li, J. Wang and X. Tan, “Estab-
lishment of Paper Assessment System Based on Acadmic
Disciplinary Benchmarks,” Scientome tri cs, Vol. 84, No. 2,
2010, pp. 421-429. doi:10.1007/s11192-009-0132-9
[2] J. E. Hirsch, “An Index to Quantify an Individual’s Sci-
entific Research Output,” Proceedings of the National
Academy of Sciences of the United States of America, Vol.
102, No. 46, 2005, pp. 16569-16572.
doi:10.1073/pnas.0507655102
[3] C. T. Zhang, “The E-Index, Complementing the H-Index
for Excess Citations,” PLoS (Public Library of Science)
ONE, Vol. 4, No. 5, 2009, p. e5429.
doi:10.1371/journal.pone.0005429
[4] B. Jin, “H-Index: An Evaluation Indicator Proposed by
Scientist,” Science Focus, Vol. 1, No. 1, 2006, pp. 8-9.
[5] C. T. Zhang, “A Proposal for Calculating Weighted Cita-
tions Based on Author Rank,” EMBO (European Mo-
lecular Biology Organization) Reports, Vol. 10, No. 5,
2009, pp. 416-417. doi:10.1038/embor.2009.74
Copyright © 2012 SciRes. OJS
L. ZHANG ET AL. 351
Appendix
2001 2002 2003 2004 2005 2006 2007 2008 2009 2010
Subject Total
Publication No. Mean No. Mean No. MeanNo.MeanNo.MeanNo.Mean No.MeanNo. Mean No. MeanNo.Mean
Agricultural
and Biological
Sciences 388 11 14.18 5 13 16 7.94277.7553.5550262693.2972 2.75 52 0.69310.1
Arts and
Humanities 8 0 0 0 0 0 01141 0 0031.30 0 2 0 10
Biochemistry,
Genetics and
Molecular
Biology
1594 36 14.56 50 19.28 133 9.921247.972324.463083.132483.35159 2.43 206 1.24980.19
Business,
Management
and Accounting 274 0 0 2 15.5 4 0.2520.5170.47220.5540.5930 0.1 113 0.04300
Chemical
Engineering 3147 126 5.32 162 7.72 172 6.732856.175003.324763.394592.6432 1.85 347 0.671880.1
Chemistry 2577 91
5.71 95 6.27 159 6.232126.22875.453065.633103.43394 2.44 476 0.912470.07
Computer
Science 2552 42 4.67 37 6.78 126 3.711213.151552.512151.293640.98574 0.47 807 0.131110.04
Decision
Sciences 199 4 140 0 1 42346 7.83153.73141.9349 0.29 104 0.0840.25
Earth and
Planetary
Sciences 772 28 1.79 34 0.79 45 1.49502.721101.661271.281261.05105 0.5 121 0.13260
Economics,
Econometrics
and Finance 15 0 0 1 1 0 000 0 0 22.524 1 0 5 0 40
Energy 1316 39 3.51 58 2.34 74 1831233.331472.371532.361502.37174 2.07 288 0.541100.09
Engineering 11176 318 2.65 429
3.39 580 2.9612032.0914921.8816981.3315341.111676 0.69 1608 0.316380.03
Environmental
Science 589 12 3.25 21 9 22 5.55316.13566.41823.82953.9978 2.28 134 0.66580.03
Health
Professions 34 0 0 1 67 1 27311.670 0 214.535 3 5 21 0.0500
Immunology
And
Microbiology 154 14 20.93 13 10.08 12 15.5158.071310.08186.72197 11 4.18 19 2.89200.2
Materials
Science 3985 102 7.73 156 7.02 172 8.52925.084713.925374.325363.44589 1.93 811 0.623190.06
Mathematics 1057 20 3.619 4.74 20 1.55433.3593.8941.861761.07174 0.95 356 0.19960.03
Medicine 478 3 5.67 7 11.86 11
5.73263 231.96473.81842.0483 1 141 0.38530.04
Neuroscience 21 1 131 2 0 01230 0 48.7523 2 1.5 4 1.2560.33
Nursing 5 0 0 0 0 0 000 0 0 15 00 1 3 1 3 20.5
Pharmacology,
Toxicology,
Pharmaceutics 271 3 3.67 7 32.14 10 7.41510331148262.5421.4552 1.58 58 0.48270.07
Physics and
Astronomy 3958 117 3.84 166 4.55 228 4.243174.315753.075932.695481.97610 1.26 773 0.44310.38
Psychology 4 1 441 38 0 000 0 0 0000 2 2 0 0 00
Social Sciences 214 0 0 0 0 1 2321.676 0.67111.82511 63 0.56 71 0.3580
Veterinary 1 0 0 0 0 0 000 0 0 00 10 0 0 0 0 00
Copyright © 2012 SciRes. OJS