Paper Menu >>
Journal Menu >>
 Journal of Minerals & Materials Characterization & Engineering, Vol. 9, No.3, pp.263-274, 2010 jmmce.org Printed in the USA. All rights reserved 263 Microstructural Study of Heat Treated Chromium Alloyed Grey Cast Iron P. Atanda 1 , A. Okeowo 1 and O. Oluwole 2* 1 Materials Science and Engineering Department, Obafemi Awolowo University 2 Mechanical Engineering Dept, University of Ibadan *Corresponding Author: lekeoluwole@gmail.com ABSTRACT This work investigated the effect of annealing, normalizing and quenching heat treatments on the microstructure of some chromium alloyed grey cast iron. Three sets of ten samples each having chromium contents of 0.5, 1.5 and 2.5% were heat treated above the upper critical temperature, to austenitizing temperatures (800 o C, 850 o C, 900 o C) for one hour each and then annealed, normalized and water quenched. Metallographic analyses of the heat treated samples were done. The results showed carbides content increased with increasing Chromium addition. Key words: Microstructure; Grey cast iron; Chromium alloying; Heat-Treatment 1. INTRODUCTION Gray iron is the most widely used, with annual production several times total of all other cast metals. It has excellent machinability, good wear resistance, and high vibration absorption 1 . Gray iron is valued particularly for its ability to be cast into complex shapes at relatively low cost. Thus, its application includes: Sanitary wares, household appliances, rolling mill and general machinery parts, ingot moulds, cylinder blocks and heads for I.C. engines, frames for electric motors, machine tool structures, etc. Chromium up to 1 percent increases hardness, strength and depth of chill 2 . Higher percentage of chromium makes cast iron resistant to corrosion and high temperature 3 . Chromium occurs as a carbide in iron and increases the tendency for the formation of white iron during solidification and the retention of a higher combined carbon in the solid state 4 . This increases the wear resistance of the iron 5,6 .  264 P. Atanda, A. Okeowo and O. Oluwole Vol.9, No.3 The heat treatment of grey irons can considerably alter the matrix microstructure with little or no effect on the size and shape of the graphite achieved during casting 7 . The matrix microstructures resulting from heat treatment can vary from ferrite-pearlite to tempered martensite. The annealing of gray iron consists of heating the iron to a temperature high enough to soften it and/or to minimize or eliminate massive eutectic carbides, thereby improving its machinability. This heat treatment reduces mechanical properties substantially 8 . It reduces the grade level approximately to the next lower grade: for example, the properties of a class 40 gray iron will be diminished to those of a class 30 gray iron. The graphite morphology does not change to any significant extent during normalization. Higher normalizing temperatures increase the carbon solubility in austenite (that is, the cementite volume in the resultant pearlite). A higher cementite volume, in turn, increases both the hardness and the tensile strength Gray irons are hardened and tempered to improve their mechanical properties, particularly strength and wear resistance. After being hardened and tempered, these irons usually exhibit wear resistance approximately five times greater than that of pearlitic gray irons 7 . 2. MATERIALS AND METHOD 2.1 Materials The samples needed for the research work were obtained from Alarat Engineering Company, Osogbo, Nigeria. The samples were basically that of unalloyed grey cast iron and alloyed grey cast iron of different compositions with chromium, i.e. 0.5%Cr, 1.5%Cr and 2.5% Cr. The spectrometric analyses are presented in Table 1. Table 1. Chemical Composition of Cr alloyed Cast- Iron Alloy Type C Si S P Mg Cu Mn Cr Un-alloyed Cast Iron 3.50 2.20 0.02 0.04 0.05 0.1 0.4 0.001 0.5% Cr alloyed Cast Iron 3.50 2.20 0.02 0.04 0.05 0.1 0.4 0.5 1.5% Cr alloyed Cast Iron 3.48 2.16 0.02 0.04 0.05 0.1 0.4 1.5 2.5% Cr alloyed Cast Iron 3.51 2.22 0.02 0.04 0.05 0.1 0.4 2.5 2.2 Methods 2.2.1 Specimen preparation The specimens for metallographic test, heat treatment, hardness test, chemical compositional analysis, and micro structural analysis were cut from the obtained samples.  Vol.9, No.3 Microstructural Study of Heat Treated Chromium alloyed Grey Cast Iron 265 265 2.2.2 Grinding This operation was aimed at producing a surface that is flat, smooth, and free from surface contaminations. The specimen was ground on a series of silicon carbide papers of increasing fineness. The papers were abrasive silica carbide papers with ranges of 240, 320, 400 and 600 grits were used sequentially. This grading enabled the specimen to be ground using coarser paper first, which allowed for a more effective removal of the surface contaminants and as the specimen moved from one grade of cloth to the other, it is rotated through 90 o to allow for the removal of scratch lines done on the surface by the first grade of grinding cloth. This process was well flushed with running water to wash away the debris/metal particles which was capable of being embedded at the surface of the specimen. Each sample was thoroughly cleaned after each grinding step to avoid any left over of abrasive particles carried over to the next fine abrasive grinding step. This procedure was continued until a fine, flat and smooth surface was obtained. 2.2.3 Polishing Fine scratches were removed from the surface of the specimen with the aid of a mechanical polishing machine, metasor R universal polishing machine. The surface of the specimen was held lightly on a horizontally rotating polishing disc covered with “Selvyt” cloth. Liquid abrasive compound and polishing agents, diamond dust were applied to the selvyt cloth while the specimens were being polished. By careful adjustment of hand pressure and by using progressively finer abrasives, a highly polished surface i.e. mirror like shining surfaces free from scratches were produced. 2.2.4 Etching After polishing, the specimen was washed with water and Natal etchant was used. 2.2.5 Microscopy The surface of the specimen was observed using a computer aided optical microscope (Accuscope) at the Materials Science and Engineering Department laboratory. Micrographs were obtained by using Fametech camera with DCM 350k pixels USB. 2.2.6 Heat treatment In this research work, the as cast samples (unalloyed and chromium alloyed) were heat treated in the furnace above A 1 into the austenitic region (Upper critical temperature). The temperatures that were employed in this work were; 800 o C, 850 o C and 900 o C. Each of the specimens were  266 P. Atanda, A. Okeowo and O. Oluwole Vol.9, No.3 heated in the furnace at the said temperatures and subjected to different heat treatment operations. A set was annealed; another normalized, and the last quenched in cold water. 2.2.7 Hardness test In this work, Brinell hardness measurements were used for hardness tests. BHN = 2F ΠD [D-(D 2 -d 2 ) ½ ] (Kg/mm 2 ) Where F = Applied load in Kg D = Diameter of indenter in (mm) d = Diameter of indentation in (mm) 3. RESULTS AND DISCUSIONS 3.1 Results The micrographs of the heat treated cast irons are presented in Figures 1- 10. Table 2 shows the Brinnell hardness values obtained for quenched un-alloyed and cast-iron alloys which present the alloys. Figures 1a- d show the micrographs of the as-cast samples. Increasing carbide formation is observed as chromium content increased from 0.5 to 2.5%. Figures 2a-d show the micrographs of samples annealed at 800 0 C. Figures 3a- d shows the micrographs of samples normalized at 800 0 C. The increasing carbide content with increasing Chromium content is very apparent. Figures 4a-d show the micrographs of samples water quenched at 800 0 C. The micrographs of samples annealed at 850 0 C are presented in Figures 5a-d. The un-alloyed sample is seen to have high free carbide content in the cast –iron matrix. Figures 6a-d show the micrographs of samples normalized at 850 0 C and Figures 7a-d presents the micrographs of samples water quenched at 850 0 C. Figures 8a-d show the micrographs of samples annealed at 900 0 C; Figures 9a-d the micrographs of samples normalized at 900 0 C and Figures 10a-d the micrographs of samples water quenched at 900 0 C. The micrographs show a general trend of increasing amount of carbides with increasing chromium addition. Also, there is the general trend of increasing carbide amount with increasing temperature of heat treatment. 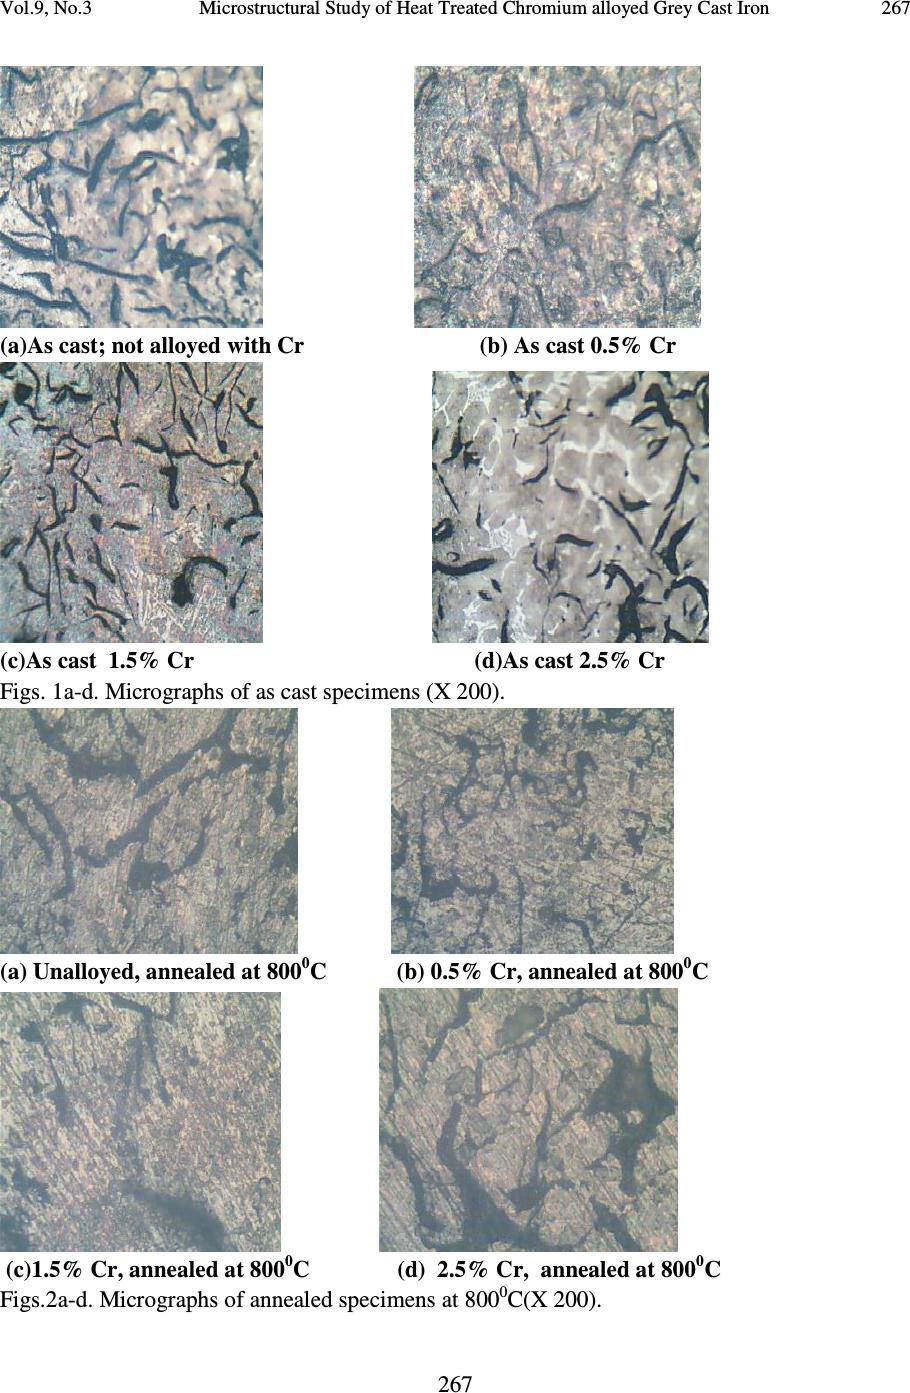 Vol.9, No.3 Microstructural Study of Heat Treated Chromium alloyed Grey Cast Iron 267 267 (a)As cast; not alloyed with Cr (b) As cast 0.5% Cr (c)As cast 1.5% Cr (d)As cast 2.5% Cr Figs. 1a-d. Micrographs of as cast specimens (X 200). (a) Unalloyed, annealed at 800 0 C (b) 0.5% Cr, annealed at 800 0 C (c)1.5% Cr, annealed at 800 0 C (d) 2.5% Cr, annealed at 800 0 C Figs.2a-d. Micrographs of annealed specimens at 800 0 C(X 200). 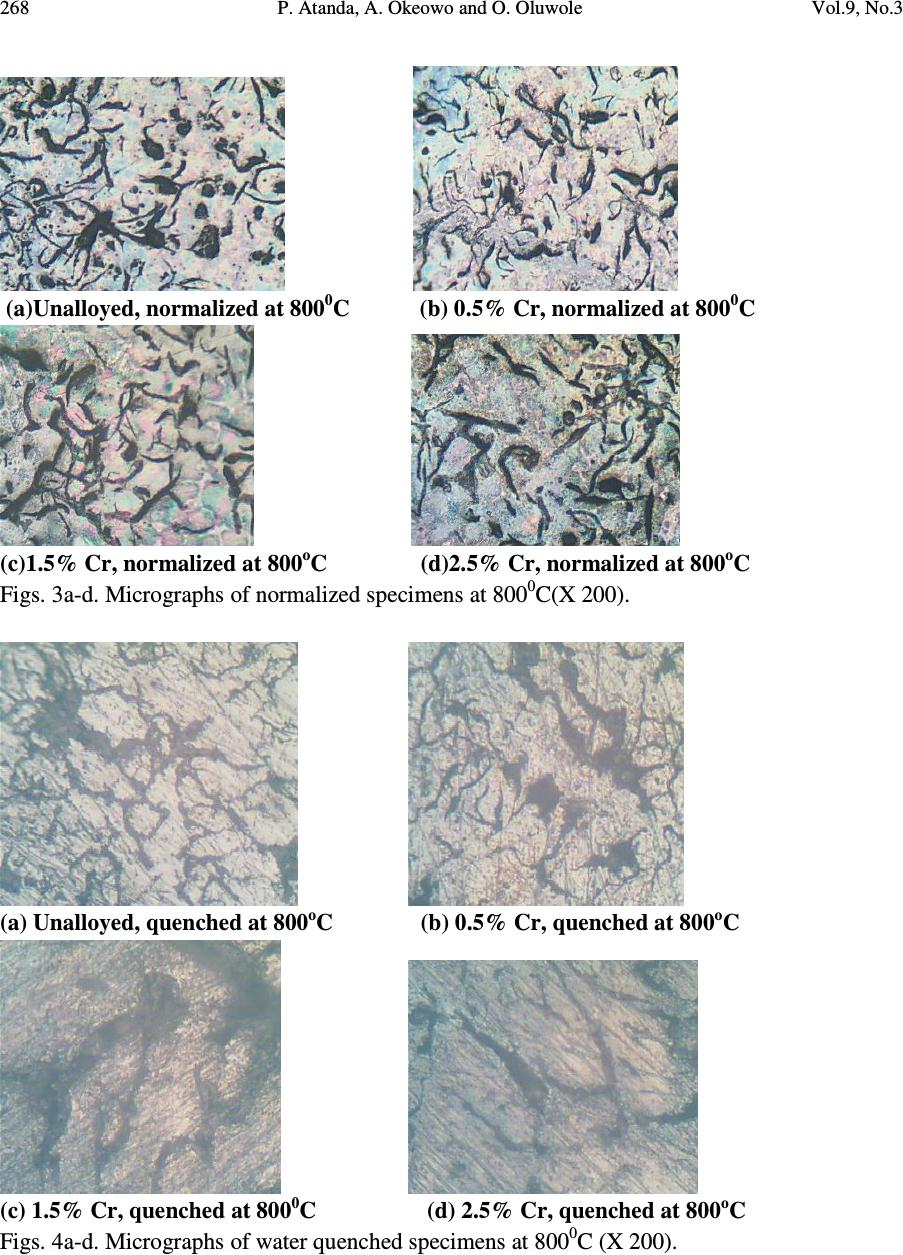 268 P. Atanda, A. Okeowo and O. Oluwole Vol.9, No.3 (a)Unalloyed, normalized at 800 0 C (b) 0.5% Cr, normalized at 800 0 C (c)1.5% Cr, normalized at 800 o C (d)2.5% Cr, normalized at 800 o C Figs. 3a-d. Micrographs of normalized specimens at 800 0 C(X 200). (a) Unalloyed, quenched at 800 o C (b) 0.5% Cr, quenched at 800 o C (c) 1.5% Cr, quenched at 800 0 C (d) 2.5% Cr, quenched at 800 o C Figs. 4a-d. Micrographs of water quenched specimens at 800 0 C (X 200). 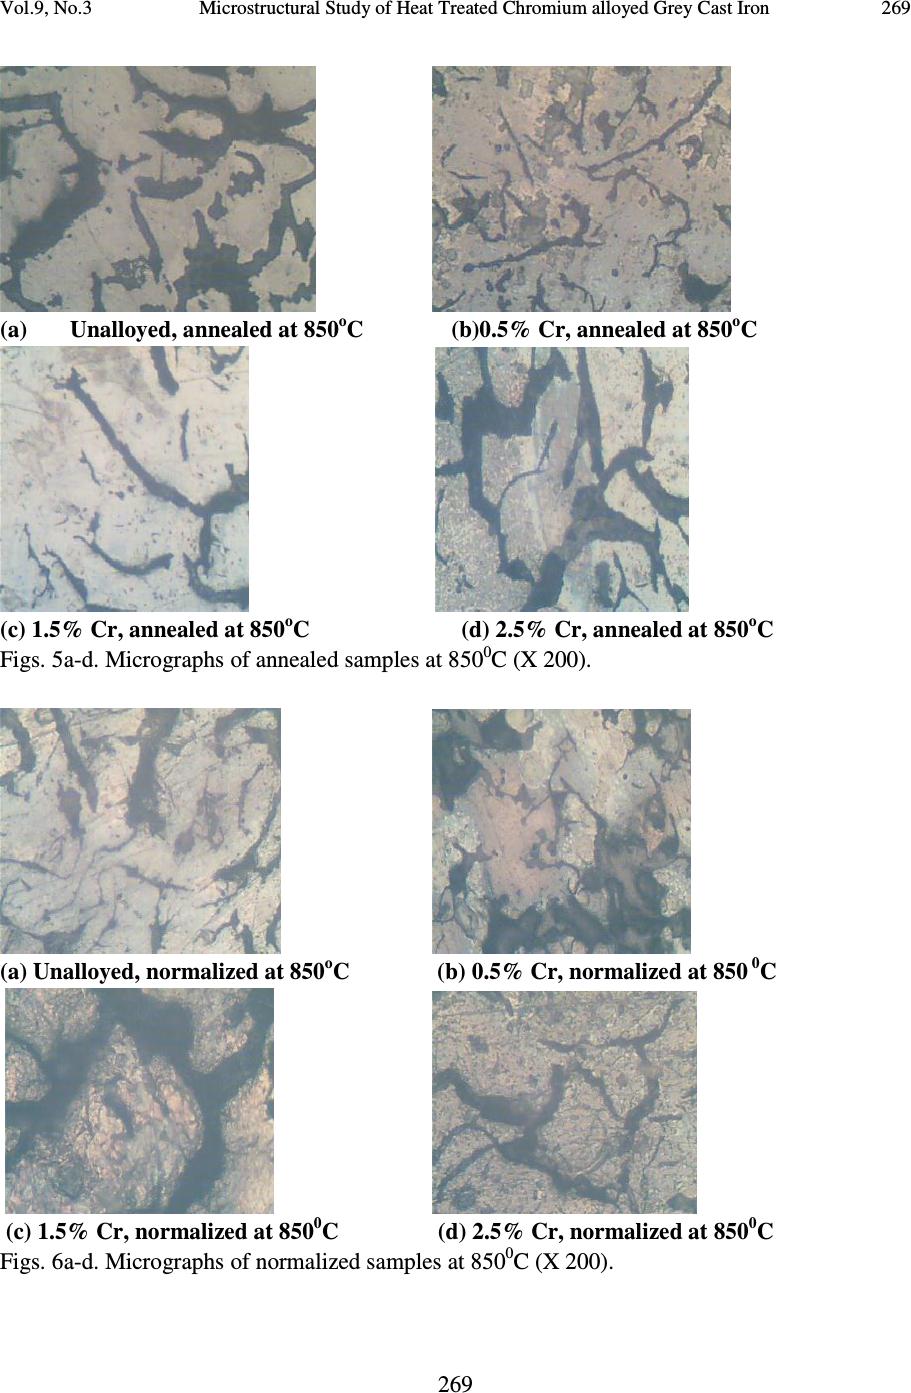 Vol.9, No.3 Microstructural Study of Heat Treated Chromium alloyed Grey Cast Iron 269 269 (a) Unalloyed, annealed at 850 o C (b)0.5% Cr, annealed at 850 o C (c) 1.5% Cr, annealed at 850 o C (d) 2.5% Cr, annealed at 850 o C Figs. 5a-d. Micrographs of annealed samples at 850 0 C (X 200). (a) Unalloyed, normalized at 850 o C (b) 0.5% Cr, normalized at 850 0 C (c) 1.5% Cr, normalized at 850 0 C (d) 2.5% Cr, normalized at 850 0 C Figs. 6a-d. Micrographs of normalized samples at 850 0 C (X 200). 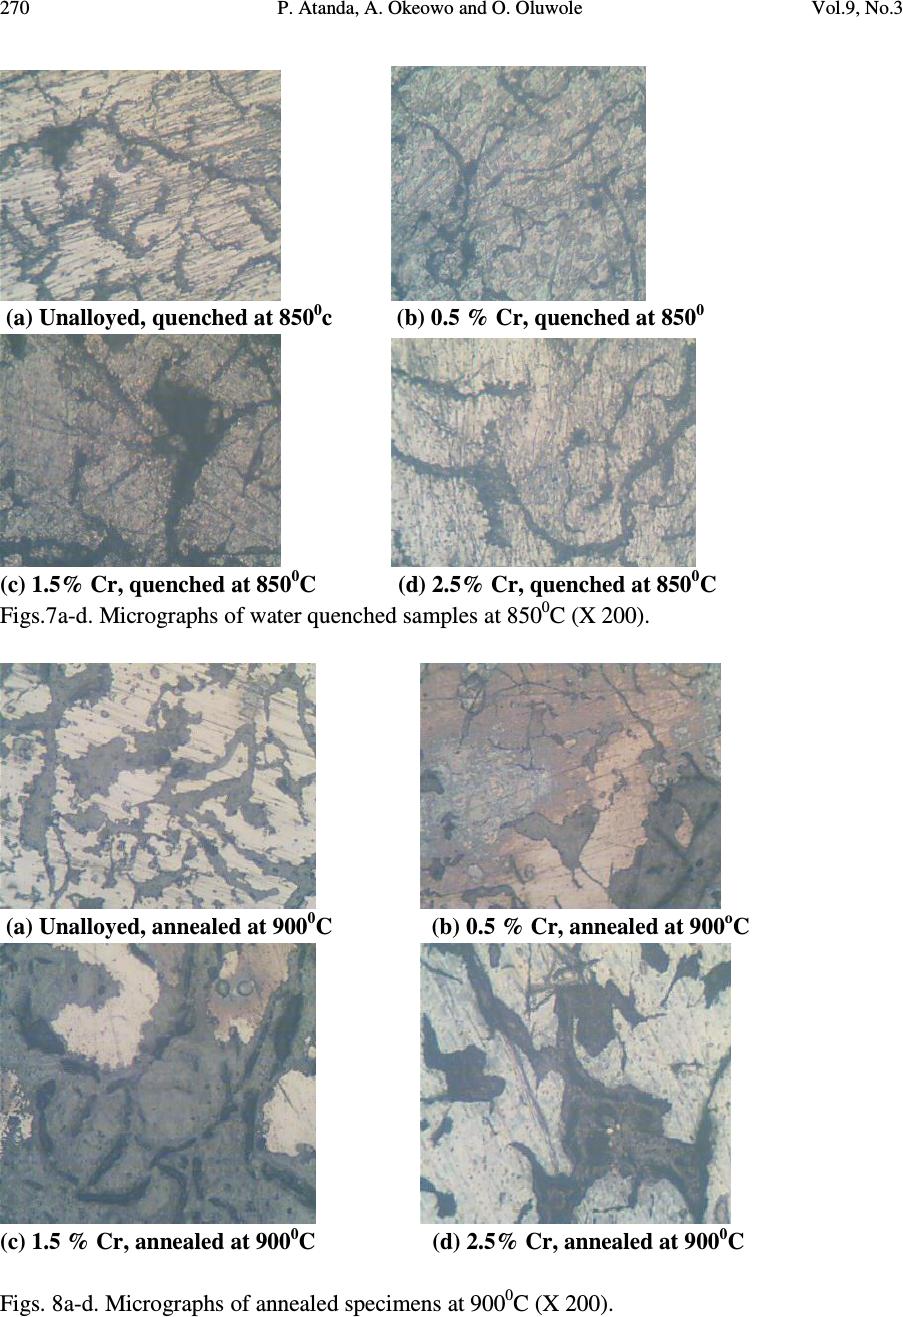 270 P. Atanda, A. Okeowo and O. Oluwole Vol.9, No.3 (a) Unalloyed, quenched at 850 0 c (b) 0.5 % Cr, quenched at 850 0 (c) 1.5% Cr, quenched at 850 0 C (d) 2.5% Cr, quenched at 850 0 C Figs.7a-d. Micrographs of water quenched samples at 850 0 C (X 200). (a) Unalloyed, annealed at 900 0 C (b) 0.5 % Cr, annealed at 900 o C (c) 1.5 % Cr, annealed at 900 0 C (d) 2.5% Cr, annealed at 900 0 C Figs. 8a-d. Micrographs of annealed specimens at 900 0 C (X 200). 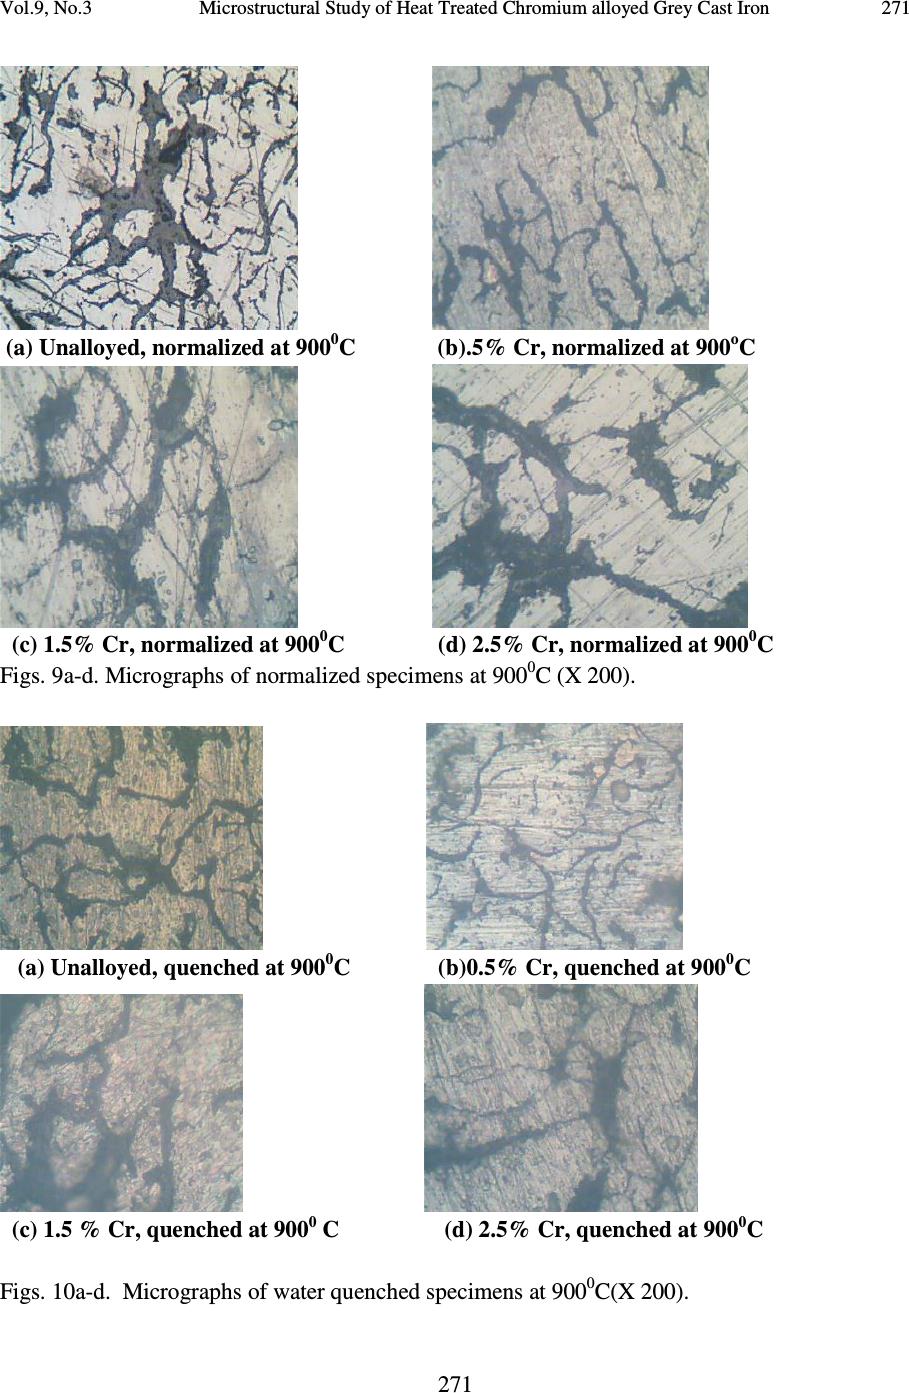 Vol.9, No.3 Microstructural Study of Heat Treated Chromium alloyed Grey Cast Iron 271 271 (a) Unalloyed, normalized at 900 0 C (b).5% Cr, normalized at 900 o C (c) 1.5% Cr, normalized at 900 0 C (d) 2.5% Cr, normalized at 900 0 C Figs. 9a-d. Micrographs of normalized specimens at 900 0 C (X 200). (a) Unalloyed, quenched at 900 0 C (b)0.5% Cr, quenched at 900 0 C (c) 1.5 % Cr, quenched at 900 0 C (d) 2.5% Cr, quenched at 900 0 C Figs. 10a-d. Micrographs of water quenched specimens at 900 0 C(X 200). 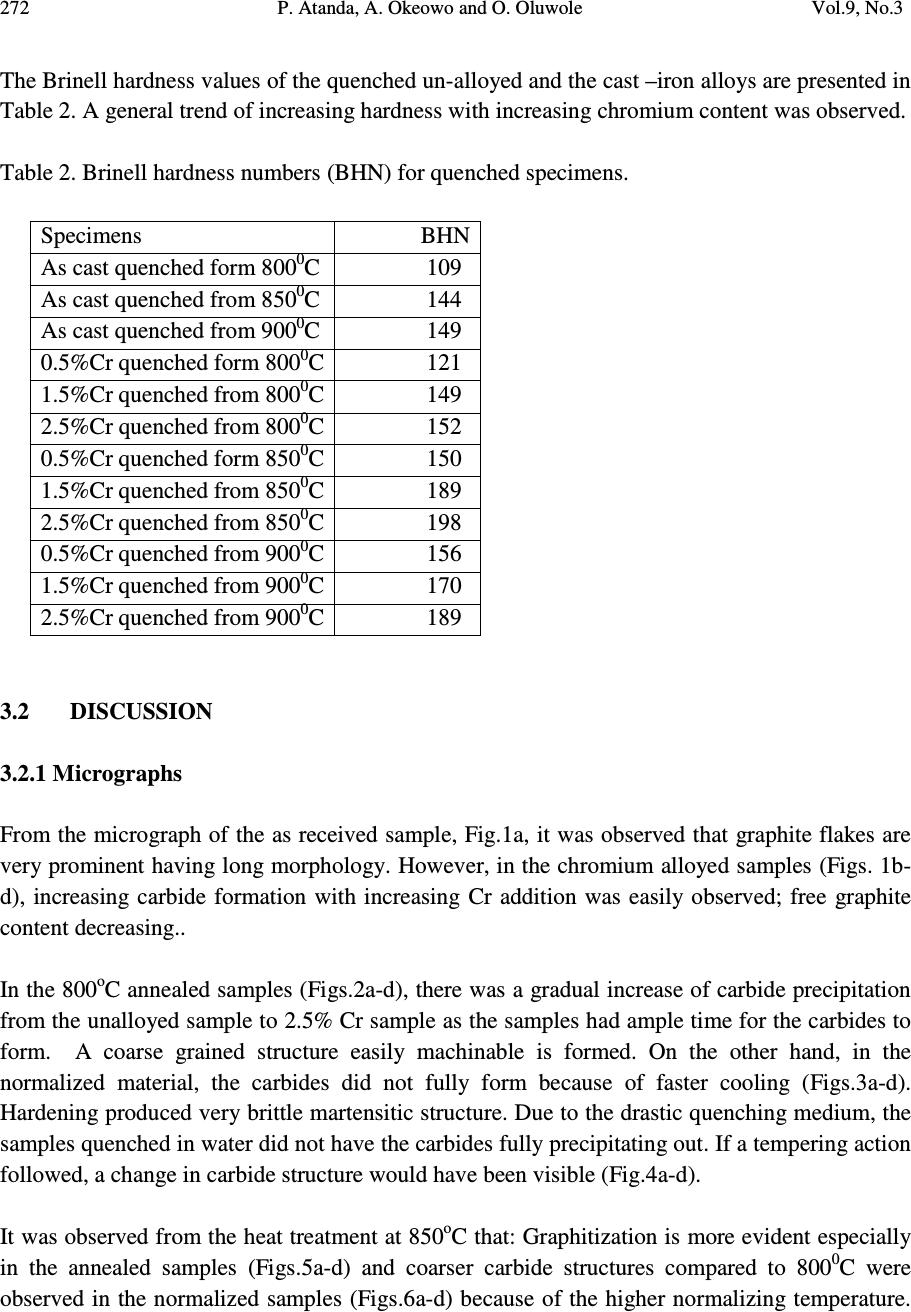 272 P. Atanda, A. Okeowo and O. Oluwole Vol.9, No.3 The Brinell hardness values of the quenched un-alloyed and the cast –iron alloys are presented in Table 2. A general trend of increasing hardness with increasing chromium content was observed. Table 2. Brinell hardness numbers (BHN) for quenched specimens. Specimens BHN As cast quenched form 800 0 C 109 As cast quenched from 850 0 C 144 As cast quenched from 900 0 C 149 0.5%Cr quenched form 800 0 C 121 1.5%Cr quenched from 800 0 C 149 2.5%Cr quenched from 800 0 C 152 0.5%Cr quenched form 850 0 C 150 1.5%Cr quenched from 850 0 C 189 2.5%Cr quenched from 850 0 C 198 0.5%Cr quenched from 900 0 C 156 1.5%Cr quenched from 900 0 C 170 2.5%Cr quenched from 900 0 C 189 3.2 DISCUSSION 3.2.1 Micrographs From the micrograph of the as received sample, Fig.1a, it was observed that graphite flakes are very prominent having long morphology. However, in the chromium alloyed samples (Figs. 1b- d), increasing carbide formation with increasing Cr addition was easily observed; free graphite content decreasing.. In the 800 o C annealed samples (Figs.2a-d), there was a gradual increase of carbide precipitation from the unalloyed sample to 2.5% Cr sample as the samples had ample time for the carbides to form. A coarse grained structure easily machinable is formed. On the other hand, in the normalized material, the carbides did not fully form because of faster cooling (Figs.3a-d). Hardening produced very brittle martensitic structure. Due to the drastic quenching medium, the samples quenched in water did not have the carbides fully precipitating out. If a tempering action followed, a change in carbide structure would have been visible (Fig.4a-d). It was observed from the heat treatment at 850 o C that: Graphitization is more evident especially in the annealed samples (Figs.5a-d) and coarser carbide structures compared to 800 0 C were observed in the normalized samples (Figs.6a-d) because of the higher normalizing temperature. 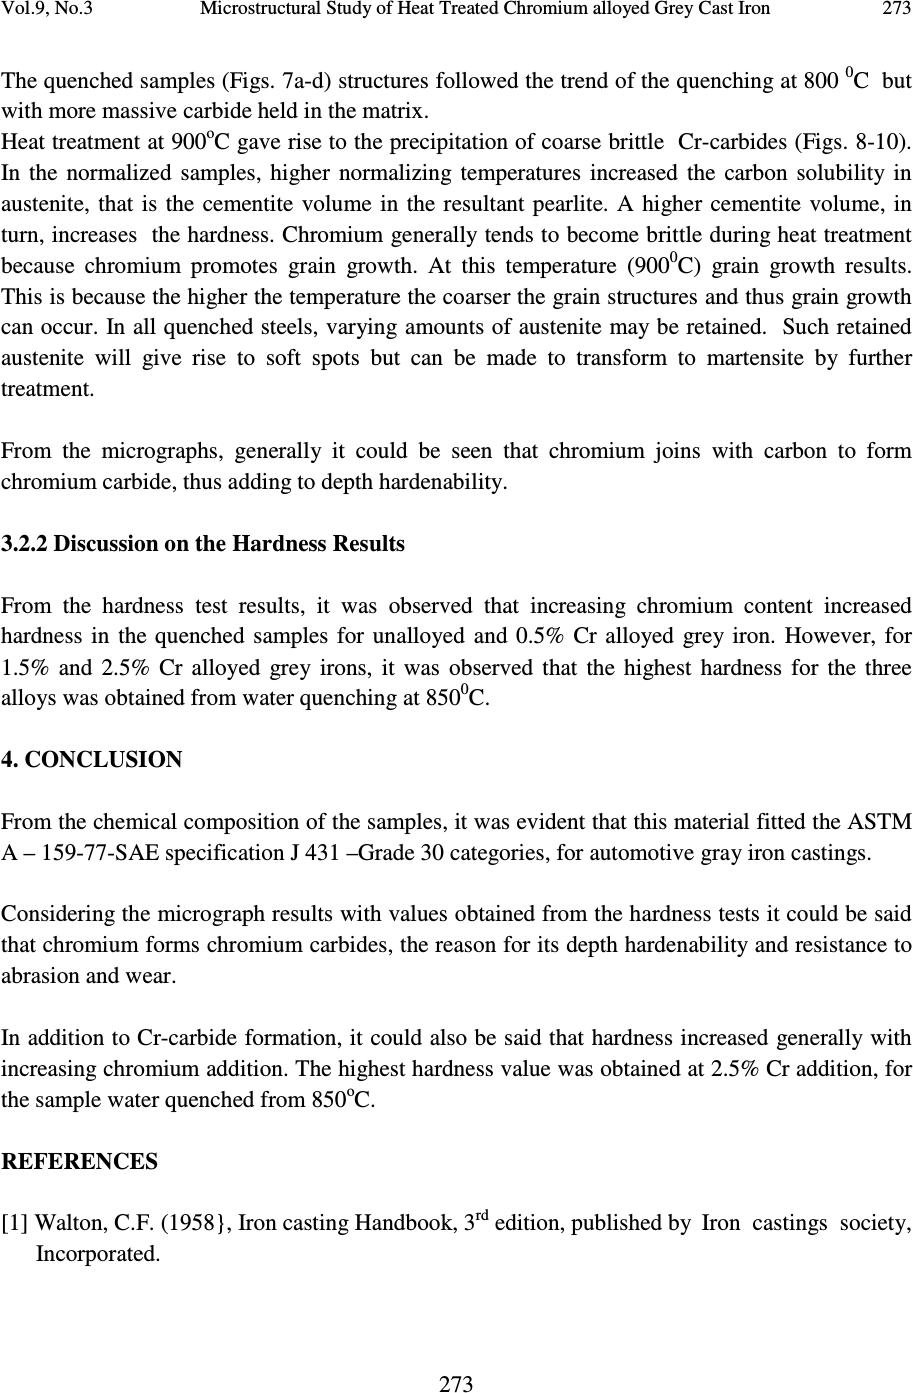 Vol.9, No.3 Microstructural Study of Heat Treated Chromium alloyed Grey Cast Iron 273 273 The quenched samples (Figs. 7a-d) structures followed the trend of the quenching at 800 0 C but with more massive carbide held in the matrix. Heat treatment at 900 o C gave rise to the precipitation of coarse brittle Cr-carbides (Figs. 8-10). In the normalized samples, higher normalizing temperatures increased the carbon solubility in austenite, that is the cementite volume in the resultant pearlite. A higher cementite volume, in turn, increases the hardness. Chromium generally tends to become brittle during heat treatment because chromium promotes grain growth. At this temperature (900 0 C) grain growth results. This is because the higher the temperature the coarser the grain structures and thus grain growth can occur. In all quenched steels, varying amounts of austenite may be retained. Such retained austenite will give rise to soft spots but can be made to transform to martensite by further treatment. From the micrographs, generally it could be seen that chromium joins with carbon to form chromium carbide, thus adding to depth hardenability. 3.2.2 Discussion on the Hardness Results From the hardness test results, it was observed that increasing chromium content increased hardness in the quenched samples for unalloyed and 0.5% Cr alloyed grey iron. However, for 1.5% and 2.5% Cr alloyed grey irons, it was observed that the highest hardness for the three alloys was obtained from water quenching at 850 0 C. 4. CONCLUSION From the chemical composition of the samples, it was evident that this material fitted the ASTM A – 159-77-SAE specification J 431 –Grade 30 categories, for automotive gray iron castings. Considering the micrograph results with values obtained from the hardness tests it could be said that chromium forms chromium carbides, the reason for its depth hardenability and resistance to abrasion and wear. In addition to Cr-carbide formation, it could also be said that hardness increased generally with increasing chromium addition. The highest hardness value was obtained at 2.5% Cr addition, for the sample water quenched from 850 o C. REFERENCES [1] Walton, C.F. (1958}, Iron casting Handbook, 3 rd edition, published by Iron castings society, Incorporated.  274 P. Atanda, A. Okeowo and O. Oluwole Vol.9, No.3 [2] Robert, Reed-Hill. (1994), Principles of physical metallurgy, 3 rd edition, PWS publishing, Boston. [3] Sawyer, J.C and Wallace, J.F., (1968), Effects and neutralization of trace elements in ductile gray iron, Transactions, American foundrymens society, Vol.76, page 385. [4] Velde C (1999), The Solidification of Gray Cast Iron. http://81://members.lycos.nl/cvdv/ eutcelpart3.html [5] Baicchi P., Nicoletto G., Konecná R. (2005), Mechanical behavior of EN-GJL30 Cast iron from three foundries, Procs. SEMDOK, Sulov. [6] Callister, W.D. (1996), An Introduction to Materials Science and Engineering, 4th edition, John Wiley and sons Incorporated. [7] WWW.key-to - steel.com, Heat treating of gray irons, (part 1); Influence of alloying element on steel microstructure. [8] Rajan, T.V., Sharma, C.P.and Sharma, A. (1988), Heat treatment principles and techniques. Prentice Hall of India private Limited, New Delhi. |