Paper Menu >>
Journal Menu >>
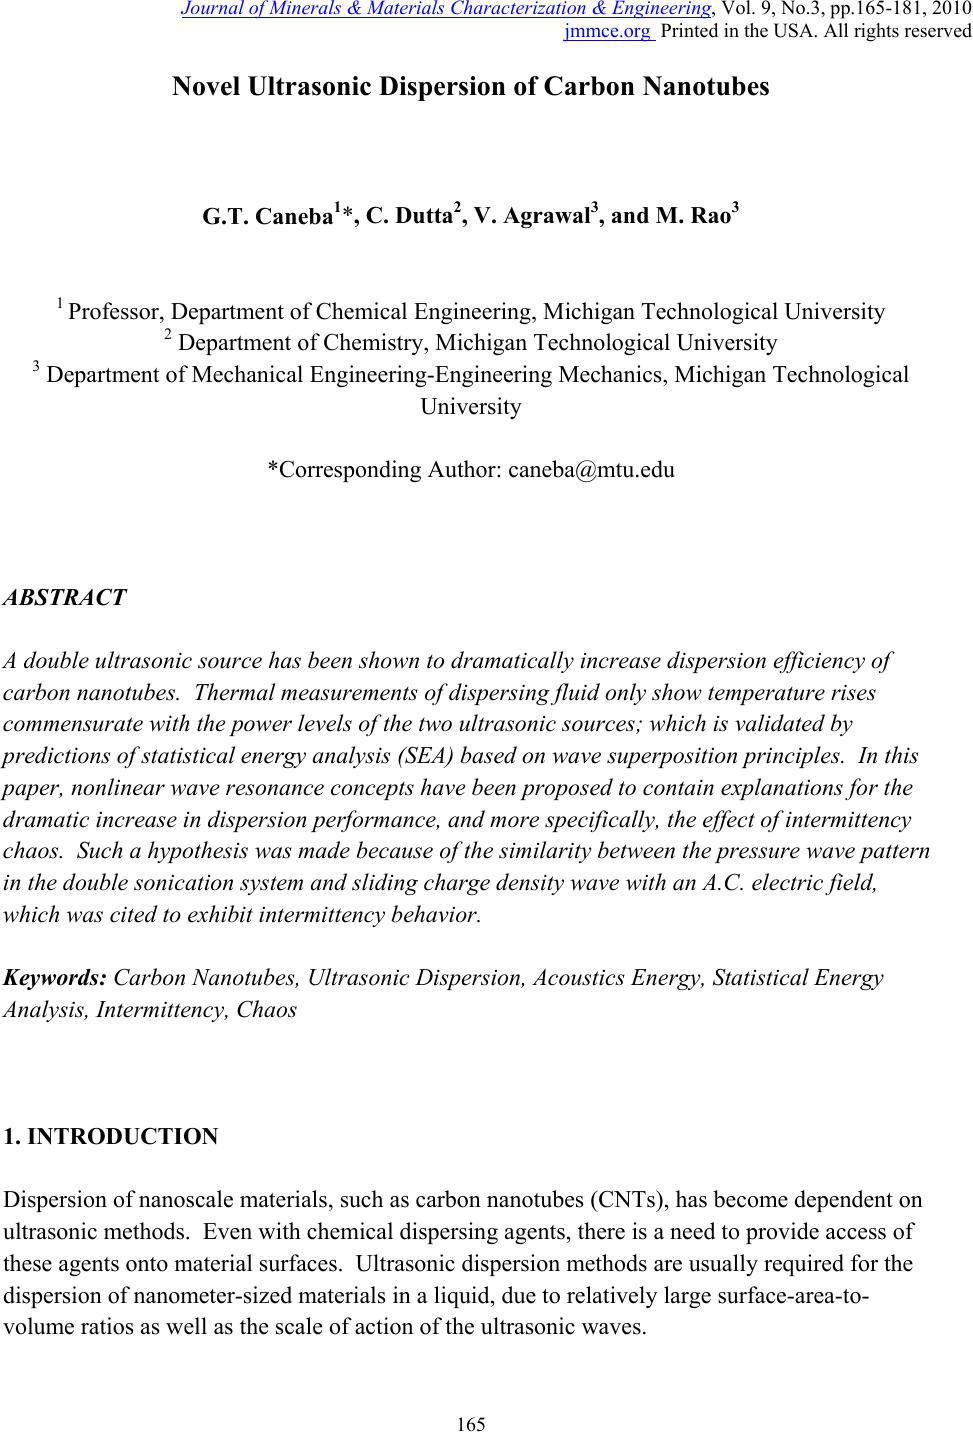 Journal of Minerals & Materials Characterization & Engineering, Vol. 9, No.3, pp.165-181, 2010 jmmce.org Printed in the USA. All rights reserved 165 Novel Ultrasonic Dispersion of Carbon Nanotubes G.T. Caneba1*, C. Dutta2, V. Agrawal3, and M. Rao3 1 Professor, Department of Chemical Engineering, Michigan Technological University 2 Department of Chemistry, Michigan Technological University 3 Department of Mechanical Engineering-Engineering Mechanics, Michigan Technological University *Corresponding Author: caneba@mtu.edu ABSTRACT A double ultrasonic source has been shown to dramatically increase dispersion efficiency of carbon nanotubes. Thermal measurements of dispersing fluid only show temperature rises commensurate with the power levels of the two ultrasonic sources; which is validated by predictions of statistical energy analysis (SEA) based on wave superposition principles. In this paper, nonlinear wave resonance concepts have been proposed to contain explanations for the dramatic increase in dispersion performance, and more specifically, the effect of intermittency chaos. Such a hypothesis was made because of the similarity between the pressure wave pattern in the double sonication system and sliding charge density wave with an A.C. electric field, which was cited to exhibit intermittency behavior. Keywords: Carbon Nanotubes, Ultrasonic Dispersion, Acoustics Energy, Statistical Energy Analysis, Intermittency, Chaos 1. INTRODUCTION Dispersion of nanoscale materials, such as carbon nanotubes (CNTs), has become dependent on ultrasonic methods. Even with chemical dispersing agents, there is a need to provide access of these agents onto material surfaces. Ultrasonic dispersion methods are usually required for the dispersion of nanometer-sized materials in a liquid, due to relatively large surface-area-to- volume ratios as well as the scale of action of the ultrasonic waves. 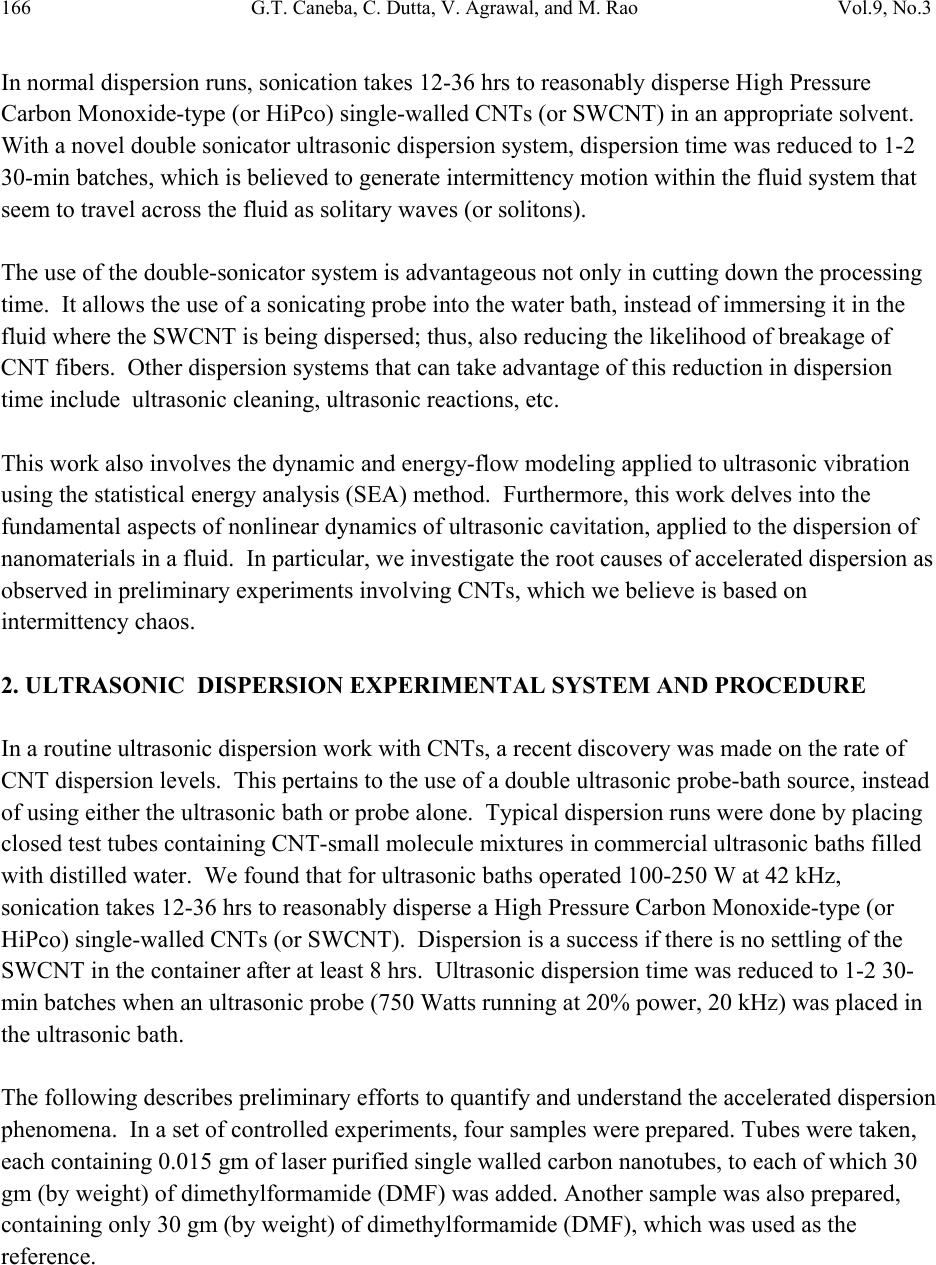 166 G.T. Caneba, C. Dutta, V. Agrawal, and M. Rao Vol.9, No.3 In normal dispersion runs, sonication takes 12-36 hrs to reasonably disperse High Pressure Carbon Monoxide-type (or HiPco) single-walled CNTs (or SWCNT) in an appropriate solvent. With a novel double sonicator ultrasonic dispersion system, dispersion time was reduced to 1-2 30-min batches, which is believed to generate intermittency motion within the fluid system that seem to travel across the fluid as solitary waves (or solitons). The use of the double-sonicator system is advantageous not only in cutting down the processing time. It allows the use of a sonicating probe into the water bath, instead of immersing it in the fluid where the SWCNT is being dispersed; thus, also reducing the likelihood of breakage of CNT fibers. Other dispersion systems that can take advantage of this reduction in dispersion time include ultrasonic cleaning, ultrasonic reactions, etc. This work also involves the dynamic and energy-flow modeling applied to ultrasonic vibration using the statistical energy analysis (SEA) method. Furthermore, this work delves into the fundamental aspects of nonlinear dynamics of ultrasonic cavitation, applied to the dispersion of nanomaterials in a fluid. In particular, we investigate the root causes of accelerated dispersion as observed in preliminary experiments involving CNTs, which we believe is based on intermittency chaos. 2. ULTRASONIC DISPERSION EXPERIMENTAL SYSTEM AND PROCEDURE In a routine ultrasonic dispersion work with CNTs, a recent discovery was made on the rate of CNT dispersion levels. This pertains to the use of a double ultrasonic probe-bath source, instead of using either the ultrasonic bath or probe alone. Typical dispersion runs were done by placing closed test tubes containing CNT-small molecule mixtures in commercial ultrasonic baths filled with distilled water. We found that for ultrasonic baths operated 100-250 W at 42 kHz, sonication takes 12-36 hrs to reasonably disperse a High Pressure Carbon Monoxide-type (or HiPco) single-walled CNTs (or SWCNT). Dispersion is a success if there is no settling of the SWCNT in the container after at least 8 hrs. Ultrasonic dispersion time was reduced to 1-2 30- min batches when an ultrasonic probe (750 Watts running at 20% power, 20 kHz) was placed in the ultrasonic bath. The following describes preliminary efforts to quantify and understand the accelerated dispersion phenomena. In a set of controlled experiments, four samples were prepared. Tubes were taken, each containing 0.015 gm of laser purified single walled carbon nanotubes, to each of which 30 gm (by weight) of dimethylformamide (DMF) was added. Another sample was also prepared, containing only 30 gm (by weight) of dimethylformamide (DMF), which was used as the reference.  Vol.9, No.3 Novel Ultrasonic Dispersion of Carbon Nanotubes 167 Two types of ultrasound systems were used to disperse the single walled carbon nanotubes. One sample was sonicated using a Branson 1200 Ultrasonic Bath, in which the tube was immersed overnight for 16 hours. The other samples, one containing just the DMF and other three containing carbon nanotubes and DMF were sonicated using the Cole Parmer Ultrasonic Processor (See Figure 1 below). Figure 1. Typical double sonication system used in dispersing SWNT. The system consists of an ultrasonic bath and an ultrasonic probe on the right. The ultrasonic bath was filled with 1500 ml of water and the initial temperature of the bath was measured. Initially the tube containing only DMF was immersed in the bath, with the ultrasound probe inserted into the bath. The bath was sonicated for 15 minutes at 20% power, after which the temperature of the bath and the sample fluid was measured. Similarly, the other three samples containing DMF and carbon nanotubes were individually immersed in water baths and sonicated for 105 minutes each using 20%, 40% and 60% power respectively. For each of the samples, the initial and final temperatures of the bath and the sample fluid were measured. 3. DISPERSION RESULTS The amount of dispersion of the carbon nanotubes in DMF were analyzed using a Nikon Epiphot Metallographic Optical Microscope, at various magnification levels. Results of dispersion analysis using the double ultrasonic source are shown below, based on power settings for the ultrasonic probe. 1. 40% sonication: Approximate particle size ranges from 0.02mm – 0.1mm  168 G.T. Caneba, C. Dutta, V. Agrawal, and M. Rao Vol.9, No.3 Nanotubes of various sizes were found scattered, when seen under the optical microscope. Under resolutions of 20Xobj. and 40Xobj. clusters of nanotubes were even seen having diameter of around 0.15 mm. Nanotubes of sizes around 0.01 to 0.02 mm was found scattered all over the image area. 2. 60% sonication: This sample was viewed under 20Xobj. and 40Xobj. Resolutions. The particle size of the nanotubes ranges approximately between 0.01mm to 0.07 mm. A nanotubes bundle was seen with 40X resolution with a diameter of around 0.25 mm. 3. 20% sonication: This sample looked like to be most uniformly dispersed with observable particle size of nanotubes of approximately 0.01-.03 mm. Scattered particles were not visible under any resolution (See Figure 2 below). Figure 2. Optical Microscope picture (20X magnification) of CNTs that are dispersed with the double sonicator system at 20% power of the probe sonicator after 75 minutes. For comparison, the CNTs did not disperse at all using the ultrasonic bath for 75 minutes. Also, the ultrasonic probe alone at 20% power did not disperse the CNTs properly, as shown in Figure 3 below. In order to investigate the energetic effects in the system, temperatures were recorded after different sonication times (Tables 1-3). 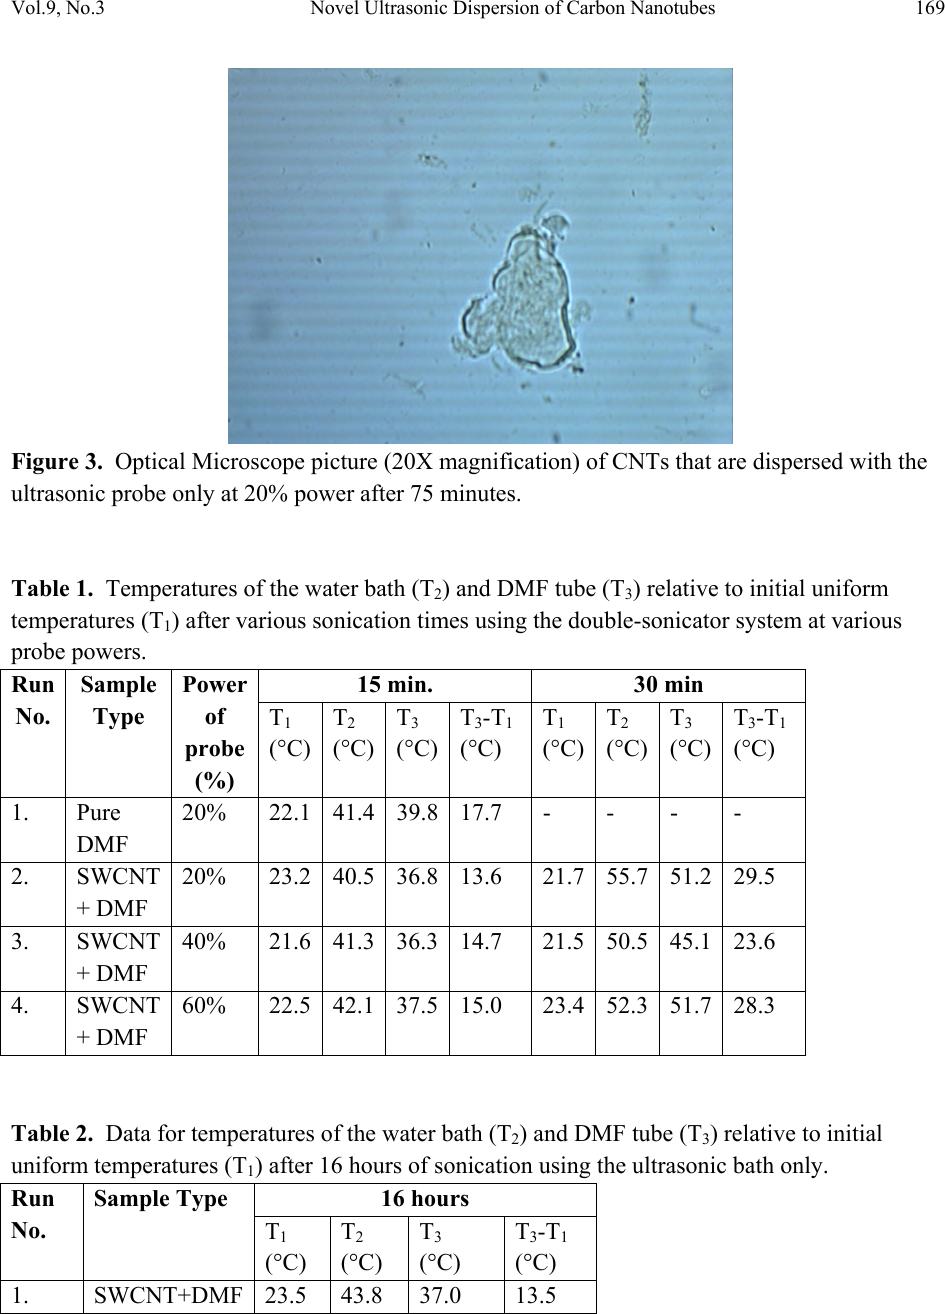 Vol.9, No.3 Novel Ultrasonic Dispersion of Carbon Nanotubes 169 Figure 3. Optical Microscope picture (20X magnification) of CNTs that are dispersed with the ultrasonic probe only at 20% power after 75 minutes. Table 1. Temperatures of the water bath (T2) and DMF tube (T3) relative to initial uniform temperatures (T1) after various sonication times using the double-sonicator system at various probe powers. Run No. Sample Type Power of probe (%) 15 min. 30 min T1 (°C) T2 (°C) T3 (°C) T3-T1 (°C) T1 (°C) T2 (°C) T3 (°C) T3-T1 (°C) 1. Pure DMF 20% 22.1 41.439.817.7 - - - - 2. SWCNT + DMF 20% 23.2 40.536.813.6 21.755.751.229.5 3. SWCNT + DMF 40% 21.6 41.336.314.7 21.550.545.123.6 4. SWCNT + DMF 60% 22.5 42.137.515.0 23.452.351.728.3 Table 2. Data for temperatures of the water bath (T2) and DMF tube (T3) relative to initial uniform temperatures (T1) after 16 hours of sonication using the ultrasonic bath only. Run No. Sample Type 16 hours T1 (°C) T2 (°C) T3 (°C) T3-T1 (°C) 1. SWCNT+DMF 23.5 43.8 37.0 13.5 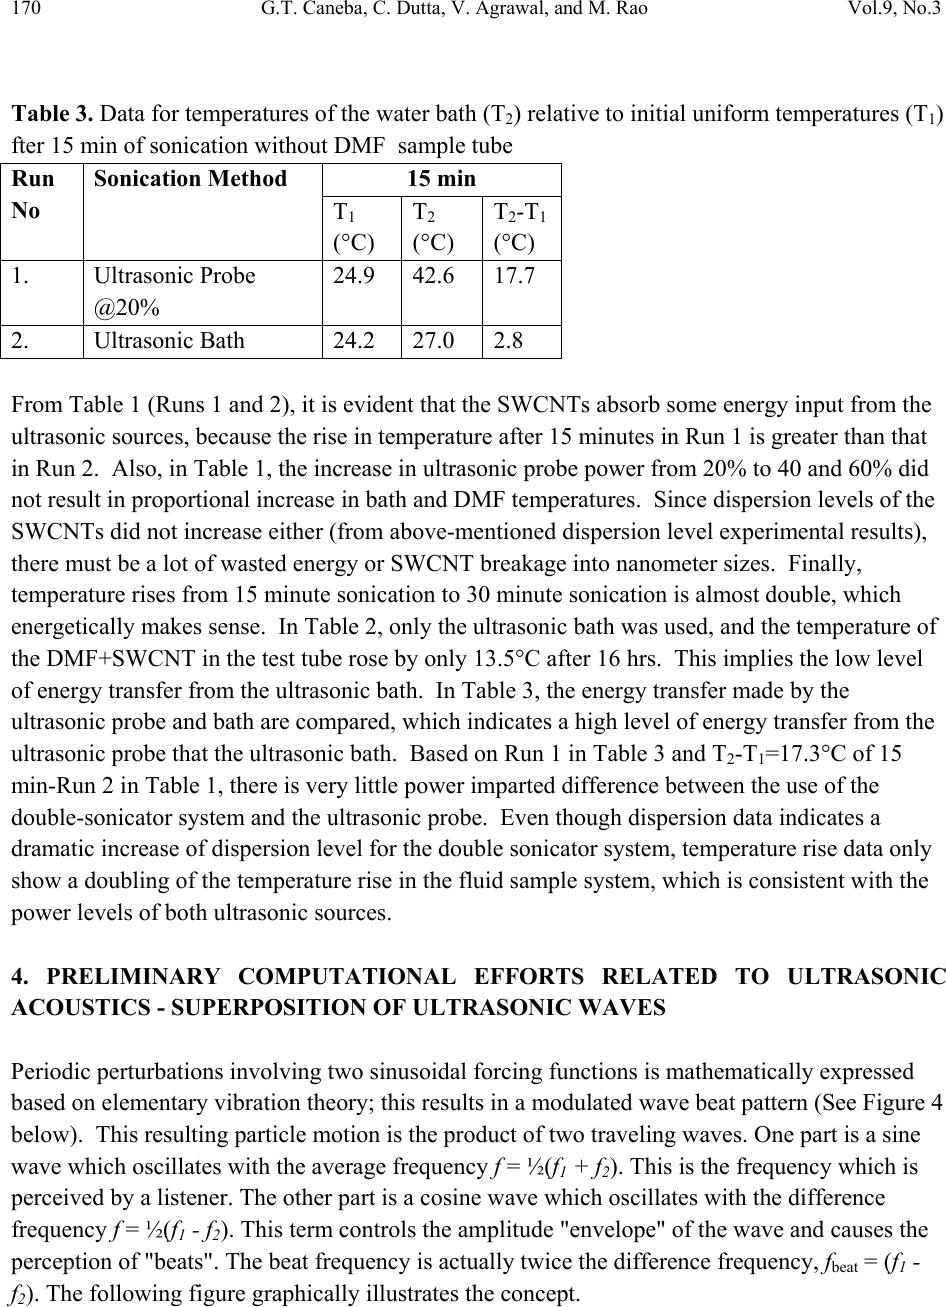 170 G.T. Caneba, C. Dutta, V. Agrawal, and M. Rao Vol.9, No.3 Table 3. Data for temperatures of the water bath (T2) relative to initial uniform temperatures (T1) fter 15 min of sonication without DMF sample tube Run No Sonication Method 15 min T1 (°C) T2 (°C) T2-T1 (°C) 1. Ultrasonic Probe @20% 24.9 42.6 17.7 2. Ultrasonic Bath 24.2 27.0 2.8 From Table 1 (Runs 1 and 2), it is evident that the SWCNTs absorb some energy input from the ultrasonic sources, because the rise in temperature after 15 minutes in Run 1 is greater than that in Run 2. Also, in Table 1, the increase in ultrasonic probe power from 20% to 40 and 60% did not result in proportional increase in bath and DMF temperatures. Since dispersion levels of the SWCNTs did not increase either (from above-mentioned dispersion level experimental results), there must be a lot of wasted energy or SWCNT breakage into nanometer sizes. Finally, temperature rises from 15 minute sonication to 30 minute sonication is almost double, which energetically makes sense. In Table 2, only the ultrasonic bath was used, and the temperature of the DMF+SWCNT in the test tube rose by only 13.5°C after 16 hrs. This implies the low level of energy transfer from the ultrasonic bath. In Table 3, the energy transfer made by the ultrasonic probe and bath are compared, which indicates a high level of energy transfer from the ultrasonic probe that the ultrasonic bath. Based on Run 1 in Table 3 and T2-T1=17.3°C of 15 min-Run 2 in Table 1, there is very little power imparted difference between the use of the double-sonicator system and the ultrasonic probe. Even though dispersion data indicates a dramatic increase of dispersion level for the double sonicator system, temperature rise data only show a doubling of the temperature rise in the fluid sample system, which is consistent with the power levels of both ultrasonic sources. 4. PRELIMINARY COMPUTATIONAL EFFORTS RELATED TO ULTRASONIC ACOUSTICS - SUPERPOSITION OF ULTRASONIC WAVES Periodic perturbations involving two sinusoidal forcing functions is mathematically expressed based on elementary vibration theory; this results in a modulated wave beat pattern (See Figure 4 below). This resulting particle motion is the product of two traveling waves. One part is a sine wave which oscillates with the average frequency f = ½(f1 + f2). This is the frequency which is perceived by a listener. The other part is a cosine wave which oscillates with the difference frequency f = ½(f1 - f2). This term controls the amplitude "envelope" of the wave and causes the perception of "beats". The beat frequency is actually twice the difference frequency, fbeat = (f1 - f2). The following figure graphically illustrates the concept. 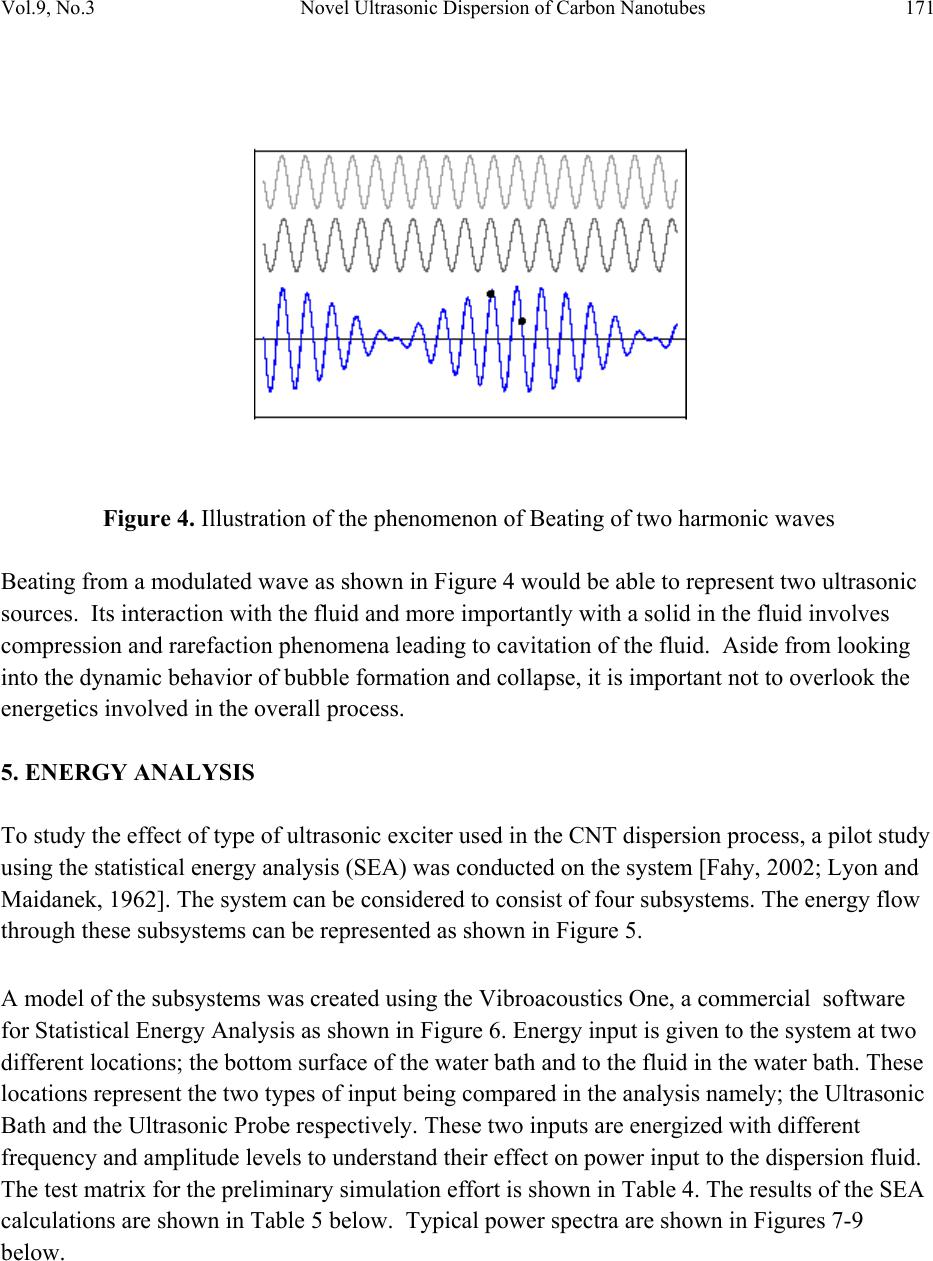 Vol.9, No.3 Novel Ultrasonic Dispersion of Carbon Nanotubes 171 Figure 4. Illustration of the phenomenon of Beating of two harmonic waves Beating from a modulated wave as shown in Figure 4 would be able to represent two ultrasonic sources. Its interaction with the fluid and more importantly with a solid in the fluid involves compression and rarefaction phenomena leading to cavitation of the fluid. Aside from looking into the dynamic behavior of bubble formation and collapse, it is important not to overlook the energetics involved in the overall process. 5. ENERGY ANALYSIS To study the effect of type of ultrasonic exciter used in the CNT dispersion process, a pilot study using the statistical energy analysis (SEA) was conducted on the system [Fahy, 2002; Lyon and Maidanek, 1962]. The system can be considered to consist of four subsystems. The energy flow through these subsystems can be represented as shown in Figure 5. A model of the subsystems was created using the Vibroacoustics One, a commercial software for Statistical Energy Analysis as shown in Figure 6. Energy input is given to the system at two different locations; the bottom surface of the water bath and to the fluid in the water bath. These locations represent the two types of input being compared in the analysis namely; the Ultrasonic Bath and the Ultrasonic Probe respectively. These two inputs are energized with different frequency and amplitude levels to understand their effect on power input to the dispersion fluid. The test matrix for the preliminary simulation effort is shown in Table 4. The results of the SEA calculations are shown in Table 5 below. Typical power spectra are shown in Figures 7-9 below. 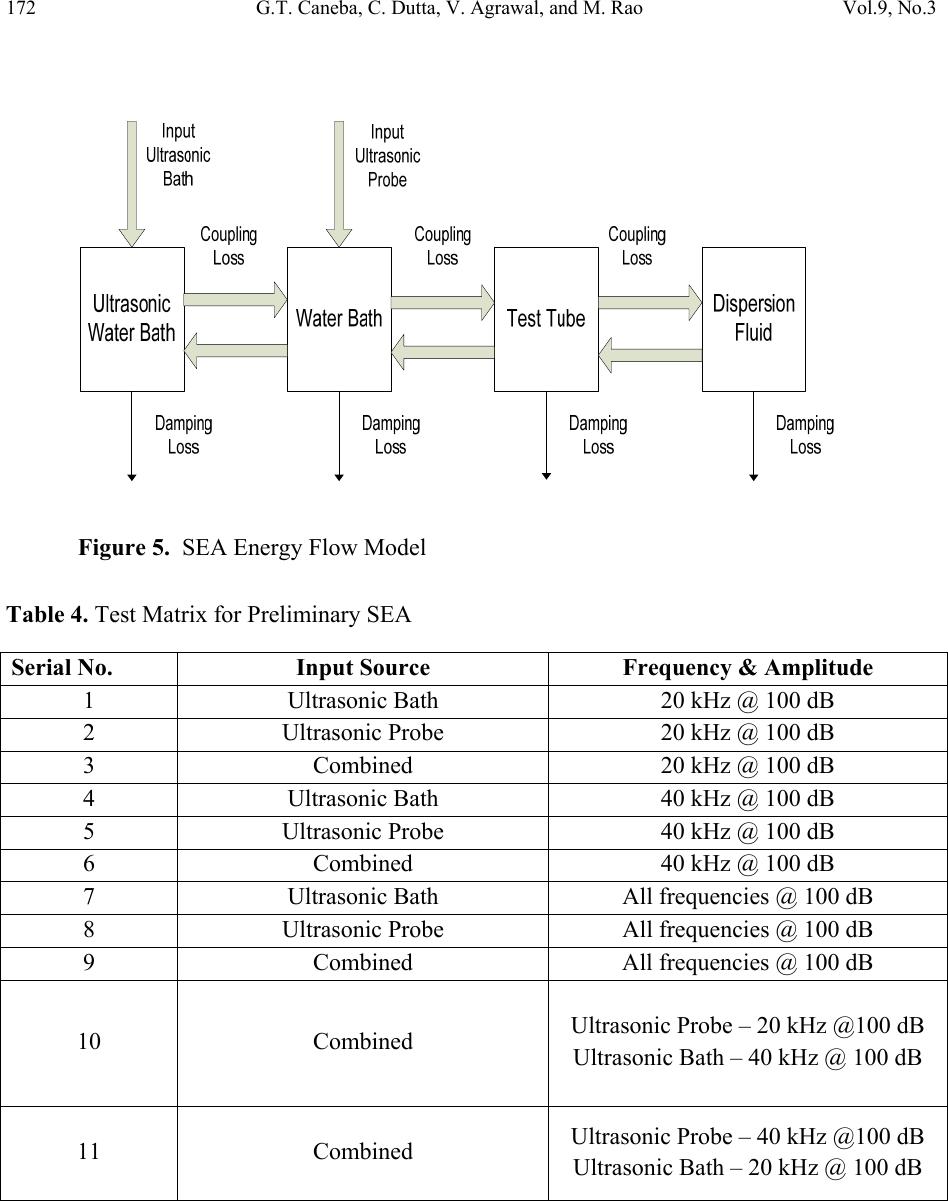 172 G.T. Caneba, C. Dutta, V. Agrawal, and M. Rao Vol.9, No.3 Figure 5. SEA Energy Flow Model Table 4. Test Matrix for Preliminary SEA Serial No. Input Source Frequency & Amplitude 1 Ultrasonic Bath 20 kHz @ 100 dB 2 Ultrasonic Probe 20 kHz @ 100 dB 3 Combined 20 kHz @ 100 dB 4 Ultrasonic Bath 40 kHz @ 100 dB 5 Ultrasonic Probe 40 kHz @ 100 dB 6 Combined 40 kHz @ 100 dB 7 Ultrasonic Bath All frequencies @ 100 dB 8 Ultrasonic Probe All frequencies @ 100 dB 9 Combined All frequencies @ 100 dB 10 Combined Ultrasonic Probe – 20 kHz @100 dB Ultrasonic Bath – 40 kHz @ 100 dB 11 Combined Ultrasonic Probe – 40 kHz @100 dB Ultrasonic Bath – 20 kHz @ 100 dB 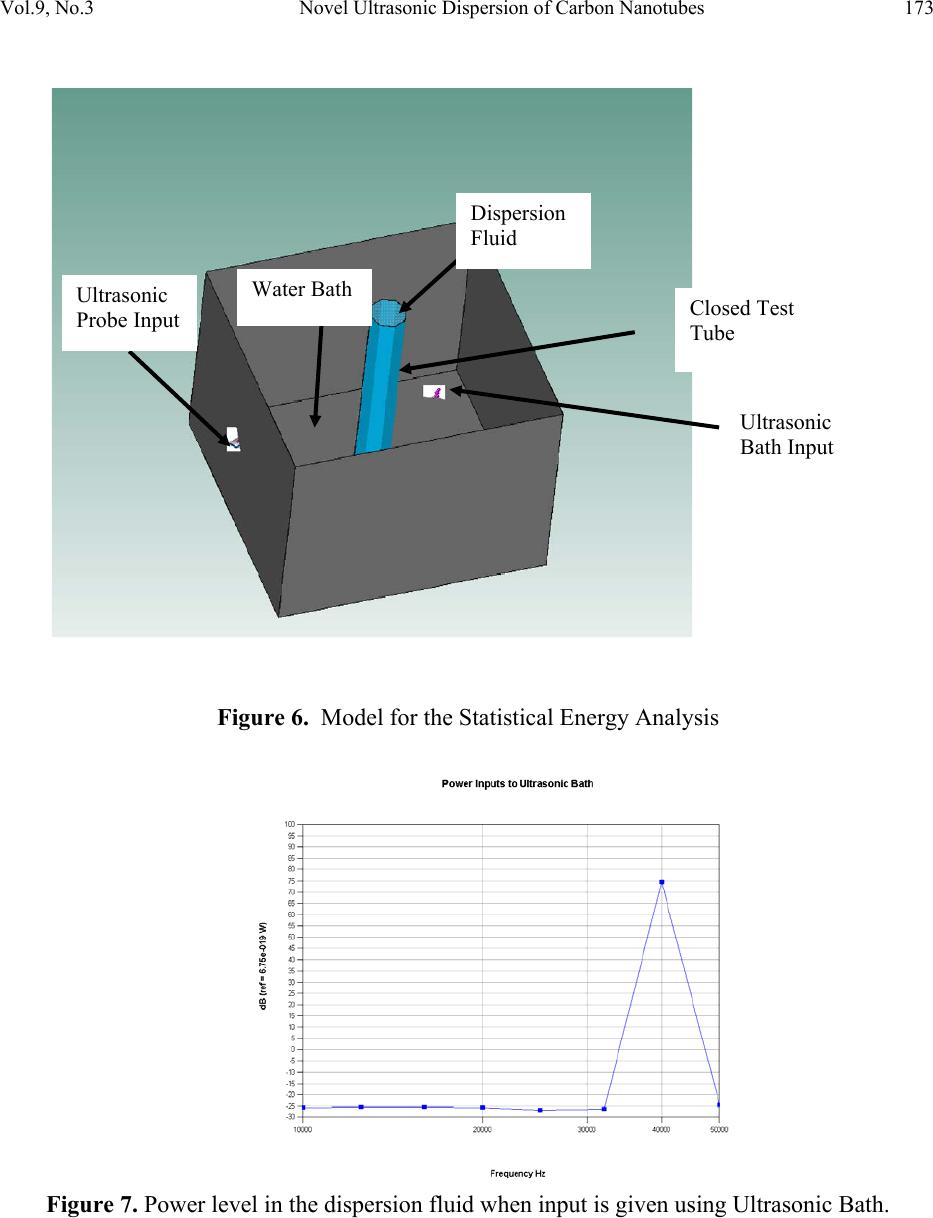 Vol.9, No.3 Novel Ultrasonic Dispersion of Carbon Nanotubes 173 Figure 6. Model for the Statistical Energy Analysis Figure 7. Power level in the dispersion fluid when input is given using Ultrasonic Bath. Ultrasonic Probe Input Ultrasonic Bath Input Water Bath Closed Test Tube Dispersion Fluid 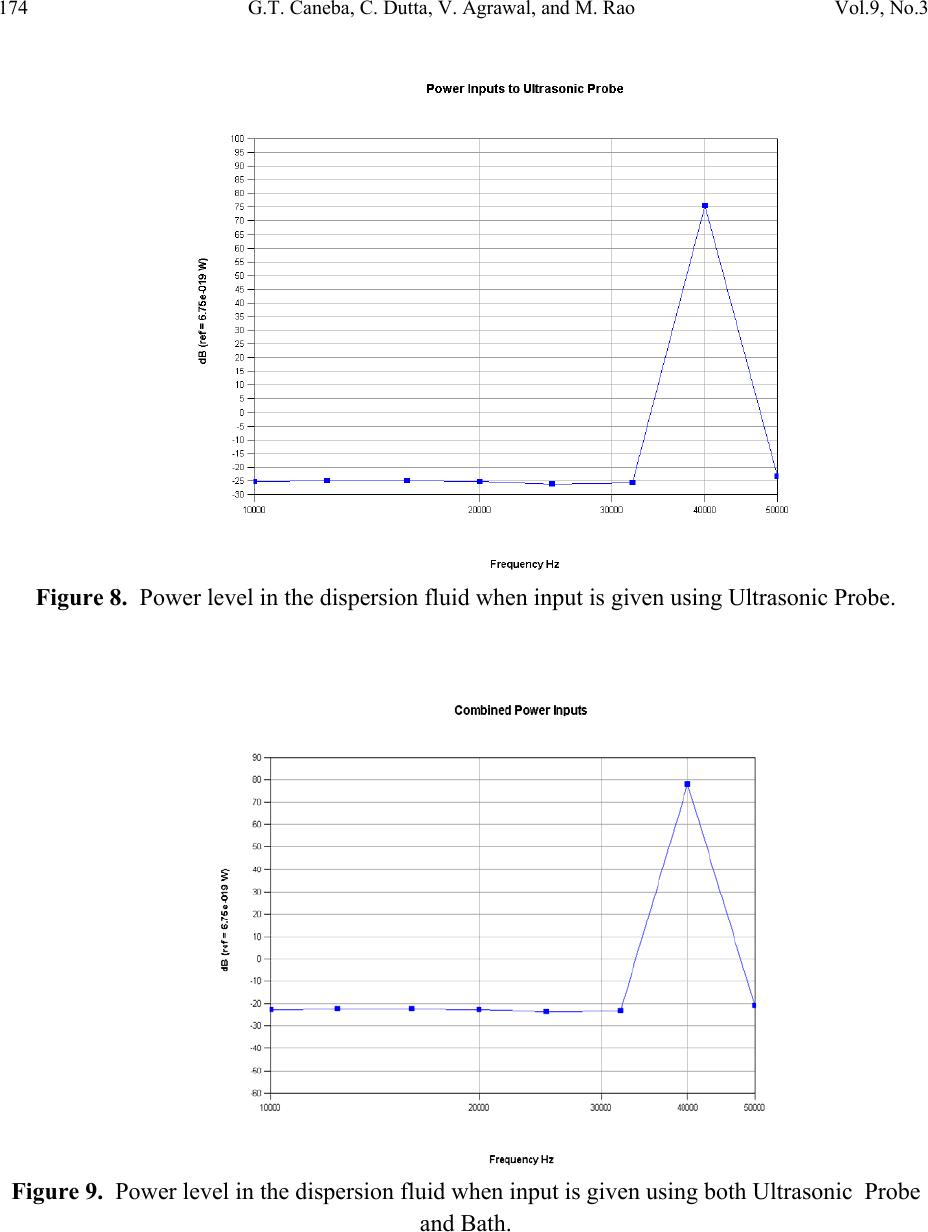 174 G.T. Caneba, C. Dutta, V. Agrawal, and M. Rao Vol.9, No.3 Figure 8. Power level in the dispersion fluid when input is given using Ultrasonic Probe. Figure 9. Power level in the dispersion fluid when input is given using both Ultrasonic Probe and Bath.  Vol.9, No.3 Novel Ultrasonic Dispersion of Carbon Nanotubes 175 Table 5. Overall Power level in the Dispersion Fluid Test No. Input Source Overall level (dB) 1 Ultrasonic Bath 20 kHz @ 100 dB 74.2 2 Ultrasonic Probe 20 kHz @ 100 dB 75.8 3 Combined 20 kHz @ 100 dB 77.5 4 Ultrasonic Bath 40 kHz @ 100 dB 74.5 5 Ultrasonic Probe 40 kHz @ 100 dB 75.5 6 Combined 40 kHz @ 100 dB 78.0 7 Ultrasonic Bath All frequencies @ 100 dB 83.3 8 Ultrasonic Probe All frequencies @ 100 dB 84.0 9 Combined All frequencies @ 100 dB 86.7 10 Combined: Ultrasonic Probe – 20 kHz @100 dB Ultrasonic Bath – 40 kHz @ 100 dB 77.7 11 Combined: Ultrasonic Probe – 40 kHz @100 dB Ultrasonic Bath – 20 kHz @ 100 dB 77.9 Observations from the preliminary SEA calculation include: • The power level in the dispersion fluid is independent of the type of excitation source used. • The power level in the dispersion fluid does not change with change in the frequency used for analysis. • The power level increases by approximately 3 dB only when both the sources are ON compared to when only a single source is ON. These observations do not indicate an explanation for the dramatic improvement in dispersion efficiencies associated with a double ultrasonic source. Thus, a closer look into acoustics theory of waves in ultrasonic cavitation will be needed, especially on nonlinear wave superposition effects. 6. DISCUSSION WITH USE OF RELEVANT THEORIES A look into acoustics theory brings us to the concept of ultrasonic cavitation in fluids, including various types of chaotic behavior. When liquids are exposed to ultrasonic waves, acoustic cavitation occurs, which includes rapid formation, growth, and collapse of bubbles. Local energies associated with acoustic cavitation are equivalent to 5000°C and 1,000 atm pressures. If there are solid surfaces within the liquid, bubbles form and collapse in solid surfaces, causing liquid jet impingement at velocities in the order of hundreds of meters per second. Thus, brittle and friable solids could be broken into pieces, and dispersed within the liquid phase [Suslick and Price, 1999]. 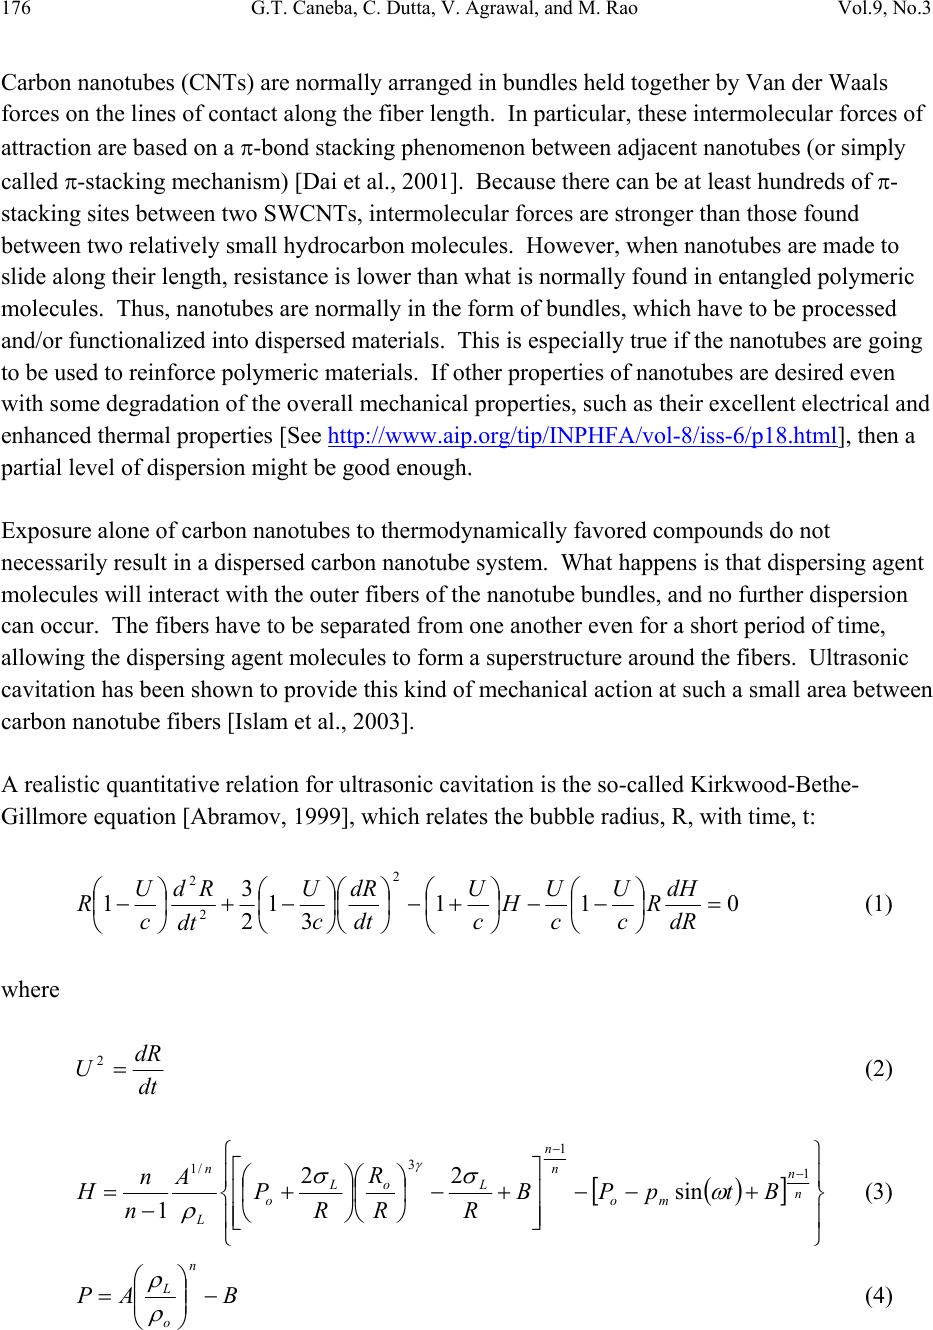 176 G.T. Caneba, C. Dutta, V. Agrawal, and M. Rao Vol.9, No.3 Carbon nanotubes (CNTs) are normally arranged in bundles held together by Van der Waals forces on the lines of contact along the fiber length. In particular, these intermolecular forces of attraction are based on a π-bond stacking phenomenon between adjacent nanotubes (or simply called π-stacking mechanism) [Dai et al., 2001]. Because there can be at least hundreds of π- stacking sites between two SWCNTs, intermolecular forces are stronger than those found between two relatively small hydrocarbon molecules. However, when nanotubes are made to slide along their length, resistance is lower than what is normally found in entangled polymeric molecules. Thus, nanotubes are normally in the form of bundles, which have to be processed and/or functionalized into dispersed materials. This is especially true if the nanotubes are going to be used to reinforce polymeric materials. If other properties of nanotubes are desired even with some degradation of the overall mechanical properties, such as their excellent electrical and enhanced thermal properties [See http://www.aip.org/tip/INPHFA/vol-8/iss-6/p18.html], then a partial level of dispersion might be good enough. Exposure alone of carbon nanotubes to thermodynamically favored compounds do not necessarily result in a dispersed carbon nanotube system. What happens is that dispersing agent molecules will interact with the outer fibers of the nanotube bundles, and no further dispersion can occur. The fibers have to be separated from one another even for a short period of time, allowing the dispersing agent molecules to form a superstructure around the fibers. Ultrasonic cavitation has been shown to provide this kind of mechanical action at such a small area between carbon nanotube fibers [Islam et al., 2003]. A realistic quantitative relation for ultrasonic cavitation is the so-called Kirkwood-Bethe- Gillmore equation [Abramov, 1999], which relates the bubble radius, R, with time, t: 011 3 1 2 3 1 2 2 2 = ⎟ ⎠ ⎞ ⎜ ⎝ ⎛−− ⎟ ⎠ ⎞ ⎜ ⎝ ⎛+− ⎟ ⎠ ⎞ ⎜ ⎝ ⎛ ⎟ ⎠ ⎞ ⎜ ⎝ ⎛−+ ⎟ ⎠ ⎞ ⎜ ⎝ ⎛−dR dH R c U c U H c U dt dR c U dt Rd c U R (1) where dt dR U= 2 (2) () [] ⎪ ⎭ ⎪ ⎬ ⎫ ⎪ ⎩ ⎪ ⎨ ⎧ +−− ⎥ ⎥ ⎦ ⎤ ⎢ ⎢ ⎣ ⎡+− ⎟ ⎠ ⎞ ⎜ ⎝ ⎛ ⎟ ⎠ ⎞ ⎜ ⎝ ⎛+ − =− − n n mo n n L o L o L n BtpPB RR R R P A n n H 1 1 3 /1 sin 22 1 ω σσ ρ γ (3) BAP n o L− ⎟ ⎟ ⎠ ⎞ ⎜ ⎜ ⎝ ⎛ = ρ ρ (4) 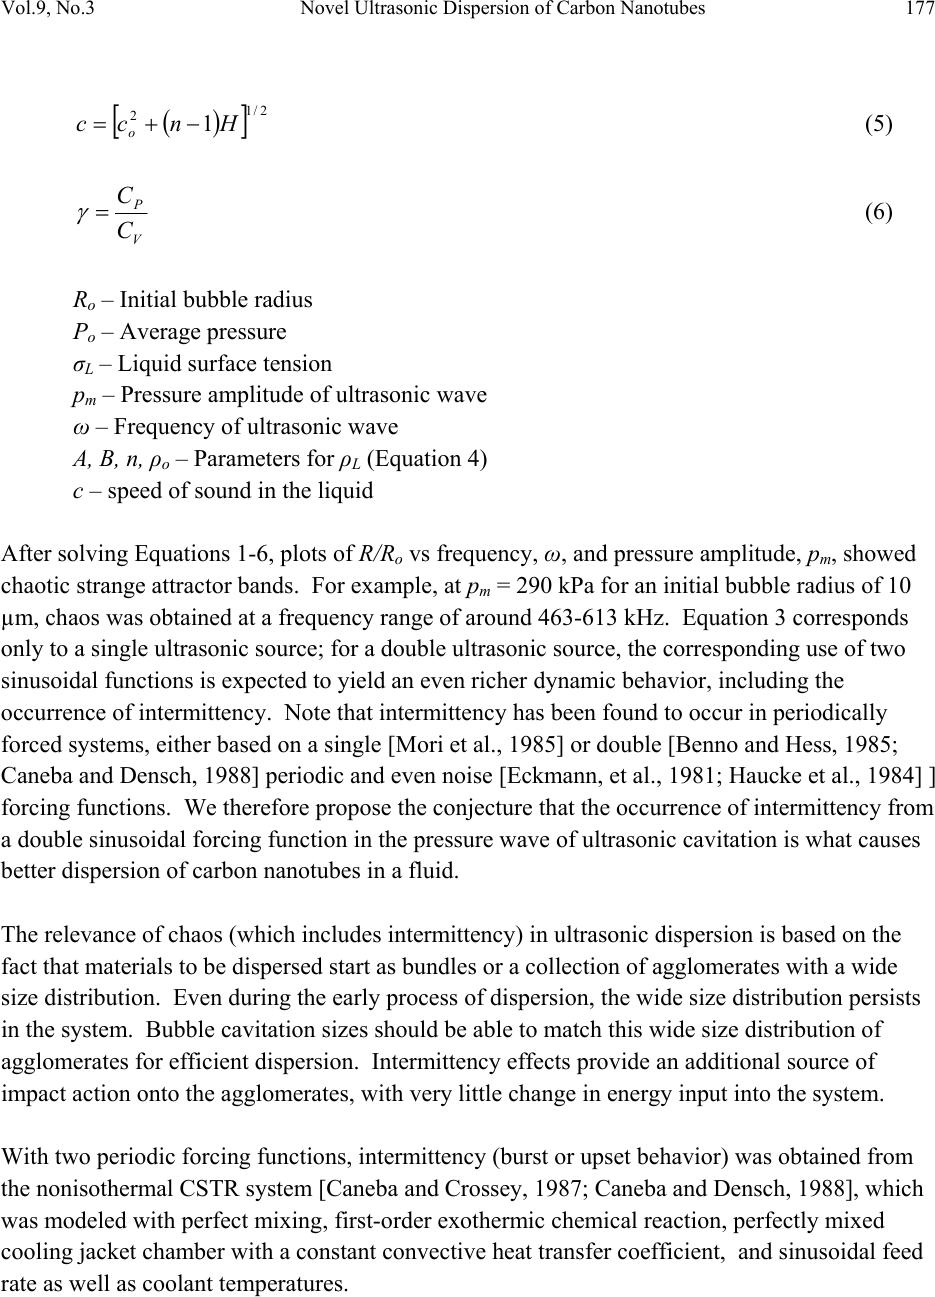 Vol.9, No.3 Novel Ultrasonic Dispersion of Carbon Nanotubes 177 () [] 2/1 21Hncc o−+= (5) V P C C = γ (6) Ro – Initial bubble radius Po – Average pressure σL – Liquid surface tension pm – Pressure amplitude of ultrasonic wave ω – Frequency of ultrasonic wave A, B, n, ρo – Parameters for ρL (Equation 4) c – speed of sound in the liquid After solving Equations 1-6, plots of R/Ro vs frequency, ω, and pressure amplitude, pm, showed chaotic strange attractor bands. For example, at pm = 290 kPa for an initial bubble radius of 10 µm, chaos was obtained at a frequency range of around 463-613 kHz. Equation 3 corresponds only to a single ultrasonic source; for a double ultrasonic source, the corresponding use of two sinusoidal functions is expected to yield an even richer dynamic behavior, including the occurrence of intermittency. Note that intermittency has been found to occur in periodically forced systems, either based on a single [Mori et al., 1985] or double [Benno and Hess, 1985; Caneba and Densch, 1988] periodic and even noise [Eckmann, et al., 1981; Haucke et al., 1984] ] forcing functions. We therefore propose the conjecture that the occurrence of intermittency from a double sinusoidal forcing function in the pressure wave of ultrasonic cavitation is what causes better dispersion of carbon nanotubes in a fluid. The relevance of chaos (which includes intermittency) in ultrasonic dispersion is based on the fact that materials to be dispersed start as bundles or a collection of agglomerates with a wide size distribution. Even during the early process of dispersion, the wide size distribution persists in the system. Bubble cavitation sizes should be able to match this wide size distribution of agglomerates for efficient dispersion. Intermittency effects provide an additional source of impact action onto the agglomerates, with very little change in energy input into the system. With two periodic forcing functions, intermittency (burst or upset behavior) was obtained from the nonisothermal CSTR system [Caneba and Crossey, 1987; Caneba and Densch, 1988], which was modeled with perfect mixing, first-order exothermic chemical reaction, perfectly mixed cooling jacket chamber with a constant convective heat transfer coefficient, and sinusoidal feed rate as well as coolant temperatures.  178 G.T. Caneba, C. Dutta, V. Agrawal, and M. Rao Vol.9, No.3 1exp sin (7) 1 sinsin (8) (9) where x – Dimensionless concentration y - Dimensionless temperature t – Dimensionless time, i.e., time divided by the reactor residence time Da – Damkohler Number or dimensionless rate of reaction B – Dimensionless heat of reaction γ – Dimensionless activation energy of reaction β – Dimensionless cooling jacket convective heat transfer coefficient yc – Dimensionless difference between average cooling fluid and reactor feed temperatures ζ – Dimensionless feed rate amplitude ξ – Dimensionless cooling fluid temperature amplitude ωF – Dimensionless feed rate frequency ωT – Dimensionless cooling fluid frequency φ - Dimensionless phase lag In order to obtain intermittency, a set of parameters of the unperturbed system was used that correspond to a phase plot with the structure of two concentric limit cycles (Figure 20 of Uppal et al., 1974), i.e., Da = 0.12823, β = 3, and γ → ∞. Periodic perturbation parameters are: ζ = 0.2, η = 0.9862, ωF = ωT = 1.7718. With these parameter values, intermittency is obtained as shown by bursts in dimensionless concentration and temperature (Figure 10), which is also manifested by a Poincare return map that contains a portion that is tangent with the diagonal (Figure 11).  Vol.9, No.3 Novel Ultrasonic Dispersion of Carbon Nanotubes 179 Figure 10. Dimensionless temperature vs Dimensionless time, showing intermittency from a nonisothermal CSTR with two periodic forcing functions. Parameters are: Da = 0.12823, β = 3, and γ → ∞, ζ = 0.2, η = 0.9862, ωF = ωT = 1.7718. Finally, power spectrum analysis of showed a single dominant peak with its subharmonics, indicating almost no additional energetic effect from the intermittency behavior compared to the regular periodic motion. Figure 11. Poincare return map of the intermittency behavior of the first two bursts (Dimensionless Time between 30 and 450) shown in Figure 10.  180 G.T. Caneba, C. Dutta, V. Agrawal, and M. Rao Vol.9, No.3 The model of a sliding charge density wave (CDW) in A.C. plus D.C. electric field and a pinning surface potential has been proposed [Bak et al., 1985], which is surprisingly similar to the pressure wave pattern of the experimental double sonicator system. The model equation is (10), where θ is the position of the CDW relative to the pinning potential. The parameters α, β, and γ represent effective mass, damping, and pinning potential, respectively. The quantity A is the D.C. electric field which depins the CDW, and B is the amplitude of the A.C. electric field. Phase-locking phenomenon associated with intermittency arises from the average velocity coinciding with rational multiples of the frequency of the external field, ω. This causes an overlap of resonances of the two wave sources, and the system erratically jumps from one resonance to the other, which is manifested by bursts in the integral plots (such as that in Figure 10). 7. CONCLUSION The double ultrasonic source (bath and probe) has been shown to efficiently disperse carbon nanotubes in DMF, compared to using just the ultrasonic bath or probe. Acoustics energy analysis based on wave superposition principle has been shown to be inconsistent with such a dramatic increase in dispersion performance. Resonance effects in the form of intermittency chaos have been proposed as the likely theoretical reason for this behavior, which has actually been shown to occur in systems with two interlocking waves. REFERENCES Abramov, O., “High Intensity Ultrasonics: Theory and Industrial Applications”, Gordon and Breach, Canada, 1999, Chapter 2. Bak, P., Bohr, T., Jensen, M.H., Physica Scripta, T9, 50-58 (1985). G.T. Caneba and M.J. Crossey, "Chaos in Periodically Perturbed Reactors," Chemical Engineering Communications, 51, 1 (1987). G.T. Caneba and B. Densch, A.I.Ch.E. Journal, 34, 333 (1988). M.J. Crossey and G.T. Caneba, "Chaos in Periodically Perturbed Nonisothermal and Biochemical CSTRs", Proceedings of the A.I.Ch.E. Annual Meeting, Miami, FL, November 1-6, 1992. Dai et al., J. Am. Chem. Soc., 123, 3838 (2001). Eckmann, J.-P., Thomas, L., and Wittwer, P., J. Phys. A: Math. Gen., 14, 3151-3168 (1981). Fahy, F. Statistical energy analysis: A guide to potential users. s.l. : SEANET Consortium, 2002. Hauke, H., Ecke, R.E., Maeno, Y., and Wheatlet, J.C., Phys. Rev. Letters.,53(22), 2090-2093 (1984).  Vol.9, No.3 Novel Ultrasonic Dispersion of Carbon Nanotubes 181 Hess, B. and Markus, M., Ber. Bunsenges. Phys. Chem., 89, 642-651 (1985). Islam, M.F., Rojas, E., Bergey, D.M., Johnson, A.T., and Yodh, A.G., Nano Letters, 3(2), 269- 273 (2003). Lyon, R. H., Maidanik, G., The Journal of Acoustical Society of America, 34, 623-629 (1962). Mori, H., Shobu, K., So., B.C., and Okamoto, H., Physica Scripta, T9, 27-34 (1985). Suslick, K.S. and Price, G.J., Annual Rev. Mater. Sci., 29, 295-326 (1999). Uppal, A., Ray, W.H., and Poore, A.B., Chem. Eng. Sci., 29, 967 (1974). |