Paper Menu >>
Journal Menu >>
 Journal of Minerals & Materials Characterization & Engineering, Vol. 8, No.10, pp.787-801, 2009 jmmce.org Printed in the USA. All rights reserved 787 Dissolution Kinetics and Leaching of Rutile Ore in Hydrochloric Acid Alafara A. Baba1*, Folahan A. Adekola1, Emmanuela E. Toye1 and Rafiu B. Bale2 1Department of Chemistry, University of Ilorin, P.M.B 1515, Ilorin-Nigeria. 2Department of Geology and Mineral Sciences, University of Ilorin, P.M.B 1515, Ilorin- Nigeria. *Corresponding Author: baalafara@yahoo.com, alafara@unilorin.edu.ng ABSTRACT Experiments on the dissolution kinetics and leaching of rutile ore by hydrochloric acid have been carried out. The influence of acid concentration, temperature, stirring speed and particle diameter on the leaching of the ore were examined. The dissolution rates were greatly influenced by the hydrogen ion concentration, temperature, stirring speed and particle diameter. Kinetic data analysis showed that the dissolution mechanism followed a diffusion controled shrinking core model with the surface chemical reaction as the rate controlling step. The study showed that with 4M HCl solution, about 82.3 % of 10g rutile ore per litre of leachant at 80oC was dissolved within 120min., using 0.045-0.075mm particle diameter at a stirring speed of 360rpm. The reaction order with respect to hydrogen ion concentration was found to be 1.0, while 42.28kJ/mol was calculated for the activation energy of the dissolution process. Finally, the X- ray diffraction spectrum showed that the residual solid which amounted to 18% of the initial solid material contained silica (-SiO2) and are formed around the shrinking core of the unreacted material. 1. INTRODUCTION Rutile is a mineral composed of titanium dioxide, TiO2 and one of three distinct titanium dioxide polymorphs: ruble, anatase and brookite. Natural rutile may contain up to 10% iron and significant amount of niobium and tantalum [1]. It has among the highest refractive indices of any known mineral and also exhibits high dispersion. These properties have led to several industrial applications, especially in the manufacture of refractory ceramics, pigment and titanium metal [1].  788 A.A. Baba, F.A. Adekola, E.E. Toye and R.B. Bale Vol.8, No.10 Nigeria is an immensely mineral rich country with diverse metal ores, many of which are only cuurently being evaluated by the Nigeria Geological Survey Agency. Available among the metal ores is rutile, which occurrence has reported in Kwara, Niger, Plateau, Taraba, Osun and Kogi States of Nigeria [2]. It has been observed that smelting plants in Nigeria export crude ores and other concentrates to Europe where there are available facilities for the smooth extraction of some precious metals including titanium. These metals are therefore innocent fallouts of the country’s bid to earn revenues from its ores. Therefore, with a properly articulated policy on solid minerals, the country stands to benefit technologically and economically from the huge mineral deposits in the land [3]. Even though, the United States mines and processes titanium and titanium dioxide, it still imports significant amounts of metallic titanium from Russia (36%), Japan (36%), Kazakhstan (25 %) and other nations (3%). TiO2 pigment for paint is imported from Canada (33%), German (12%), France (8%), Spain(6%) and other nations including African countries (36%) [4]. For instance, in 2005, the Republic of Sierra Leone in West Africa had a production capacity of 23 percent of the world’s annual rutile supply, which rose to approximatelly 30 percent in 2008. The reserves, lasting for about 19 years, are estimated at 259,000,000 metric tons (285,000,000 short tons) [5]. A variety of problem such as high energy cost, shortage of high grade ores, processing of low and complex ores and exploitation of smaller deposits have prompted the development of low temperature hydrometallurgical processes for the extraction of base metals from their ores and concentrates. The conventional hydrometallurgical processes for the extraction of a base metal from a named ore or concentrate consist of a catalytic sulphating, roasting, leaching of the metallic values, solvent extraction and selective stripping [6]. Chloride system in hydrometallurgy has been used for the treatment and recovery of precious metals for a number of years [7]. The leaching of minerals including rutile is a subject of considerable interest. The growing inability of the worlds’s natural rutile resources, now principally derived from Australia to meet the raw material needs of the ‘chloride’ pigment manufacturers, is one of the reasons for the present study [8]. Since there is virtually no reported work on the leaching or dissolution kinetics of any Nigeria rutile ore, this work is therefore expected to provide useful data on the kinetic parameters on the leaching of the ore for its subsequent beneficiation. The only existing document with respect to Nigerian rutile is on elemental analysis by X-ray technique [9]. 2. EXPERIMENTAL 2.1 Material/Analysis  Vol.8, No.10 Dissolution Kinetics and Leaching of Rutile Ore 789 The rutile sample was obtained from an ore deposit at Oke-Ode, Ifelodun Local Government Area of Kwara State, Nigeria. The ore was crushed, ground and sieved with ASTM Standard sieves into three size fraction: 0.045-0.075, 0.075-0.106 and 0.106-0.212mm. All experiments were performed with particle size: 0.045-0.075mm, unless otherwise stated. The elemental analysis of the ore was carried out by Inductively Coupled Plasma-Mass Spectrometry (ICP-MS), Yogogawa Model HP-4500, equipped with auto sampler, peristatic pump and Babington nebulizer under the following conditions: plasma, auxilliarry and carrier gas flow rates of 15, 1.2 and 1.04L/min, respectively. The mineralogical purity of the ore was examined using PHILIPS PW 1800 X-ray diffractometer (XRD) with CuK1(1.54Å) radiation, generated at 40kV and 55mA. The cabinet houses a high speed, high precision Goniometer, high efficiency generator (X-ray) and an automatic sample loading capacity. Doubly distilled water and BDH grade HCl acid were used to prepare all solutions. 2.2 Equipment and Methods Experimentals were carried out by agitation leaching using a covered 500ml Pyrex flask (glass reactor) and mechanically stirred with a magnetic stirring bar at 0-540rpm. Typically and for each run, 100ml of HCl solution of predetermined molarity was charged into the reactor and heated to the required temperature (550C). Thereafter, 1.0g of rutile was added to the reactor and the contents were well agitated [7, 8]. The concentration of HCl which gave the maximum dissolution (4M) was subsequently used for the optimization of other leaching parameters including temperature, stirring rate and particle size. Energy of activation, Ea, and constants were determined from the Arrhenius plots. In all experiments, the fraction of the ore dissolved, X, were calculated from the initial difference in weight of the amount dissolved or undissolved at various time intervals up to 120min, after oven dried at about 600C [10]. The post-leaching residual product at 800C in 4M HCl was then analyzed by XRD. 3. RESULTS AND DISCUSSION 3.1 Mineralogical Studies 3.1.1 Elemental analysis b y ICP-MS The result of the elemental analysis of the rutile ore by ICP-MS technique is summarised in Table 1.  790 A.A. Baba, F.A. Adekola, E.E. Toye and R.B. Bale Vol.8, No.10 Table 1. Elemental analysis of the rutile ore by ICP-MS (expressed in percentage). Element Fe Ti Zn Cu S Cd Nb Cr W Ag Ca Si Pb Sb Conc. 1.34 40.94 0.79 0.47 0.78 0.93 0.018 0.032 0.005 0.014 2.41 18.46 0.06 0.003 O (oxygen) = 31.92 %, obtained by difference. From Table 1, it is evident that the major elements detected by ICP-MS are Ti (40.94 percent), Si (18.46%), Ca (2.41%) and Fe (2.34%), while Zn, Cu, S, Cd, Nb Cr and Ag are minor elements in the ore. Other metals detected in the ore at trace levels were W, Sb, Th, V, Te and Mn. This rutile, sourced from the North-central part of Nigeria with Ti content of about 41% is comparable to 49% Titanium earlier reported for the rutile originating from the South-western part of Nigeria [9]. 3.1.2 Ore phase studies by XRD Figure 1 shows the identified phases and their respective lattice plane with JCPDS file number in the rutile ore by X-ray diffraction. Fig. 1. X-ray spectra of rutile ore with the most probable compounds identified. Joint committee on powder diffraction standard, File No. are put in brackets: (1,2): TiO2 [1 2 0] (29-1360); (3): Fe2O3 [0 2 2] (16-0653); (4): SiO2 [1 0 1] (46-1045); (5): Fe3Ti3O10 [1 1 3] (47-0421); (6): Ti3O5 [2 0 6] (23-0606). The X-ray spectrum data in Fig.1 apparently complement the results of chemical analysis by ICP-MS. It shows that titanium is present mainly as TiO2. With the result of ICP-MS, the TiO2 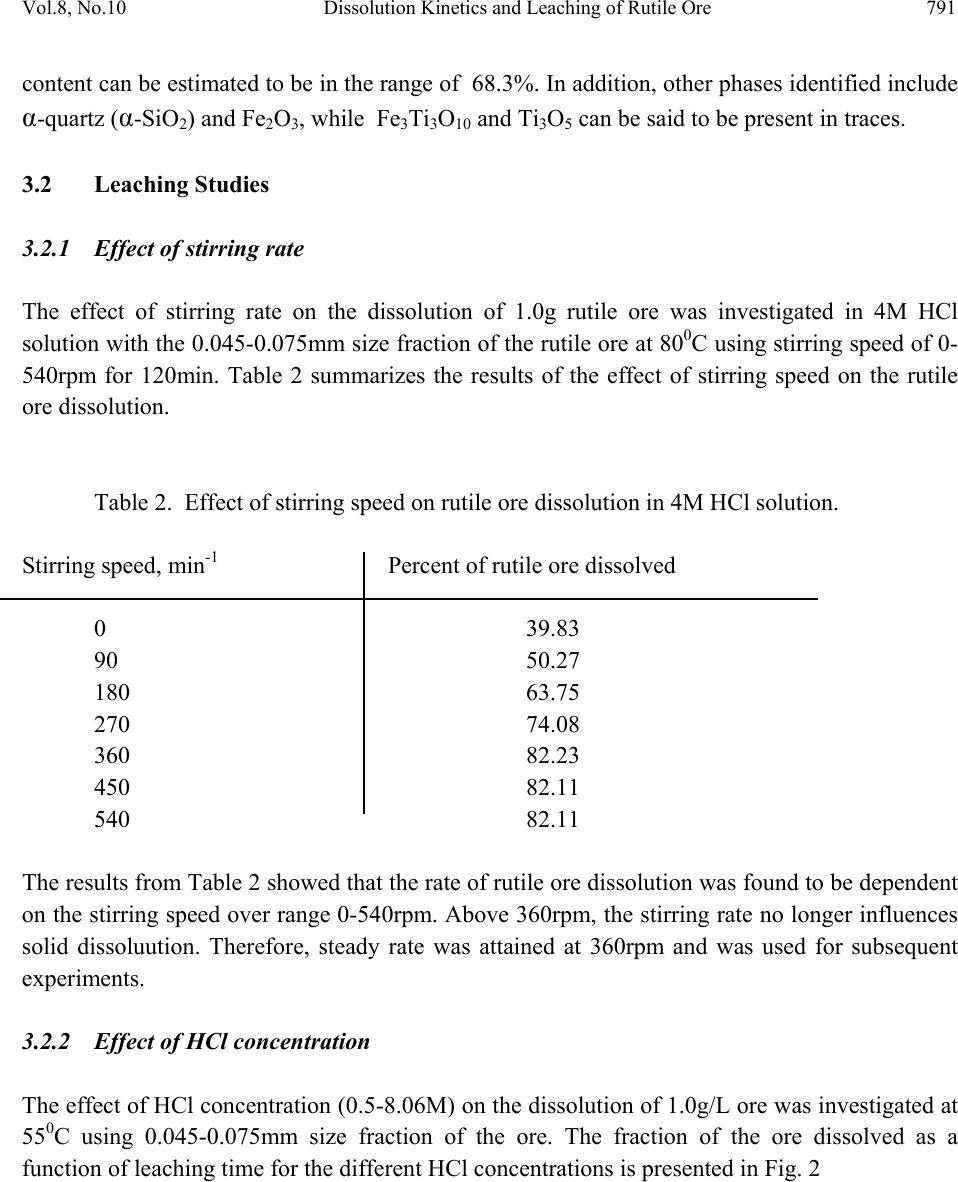 Vol.8, No.10 Dissolution Kinetics and Leaching of Rutile Ore 791 content can be estimated to be in the range of 68.3%. In addition, other phases identified include -quartz (-SiO2) and Fe2O3, while Fe3Ti3O10 and Ti3O5 can be said to be present in traces. 3.2 Leaching Studies 3.2.1 Effect of stirring rate The effect of stirring rate on the dissolution of 1.0g rutile ore was investigated in 4M HCl solution with the 0.045-0.075mm size fraction of the rutile ore at 800C using stirring speed of 0- 540rpm for 120min. Table 2 summarizes the results of the effect of stirring speed on the rutile ore dissolution. Table 2. Effect of stirring speed on rutile ore dissolution in 4M HCl solution. Stirring speed, min-1 Percent of rutile ore dissolved 0 39.83 90 50.27 180 63.75 270 74.08 360 82.23 450 82.11 540 82.11 The results from Table 2 showed that the rate of rutile ore dissolution was found to be dependent on the stirring speed over range 0-540rpm. Above 360rpm, the stirring rate no longer influences solid dissoluution. Therefore, steady rate was attained at 360rpm and was used for subsequent experiments. 3.2.2 Effect of HCl concentration The effect of HCl concentration (0.5-8.06M) on the dissolution of 1.0g/L ore was investigated at 550C using 0.045-0.075mm size fraction of the ore. The fraction of the ore dissolved as a function of leaching time for the different HCl concentrations is presented in Fig. 2 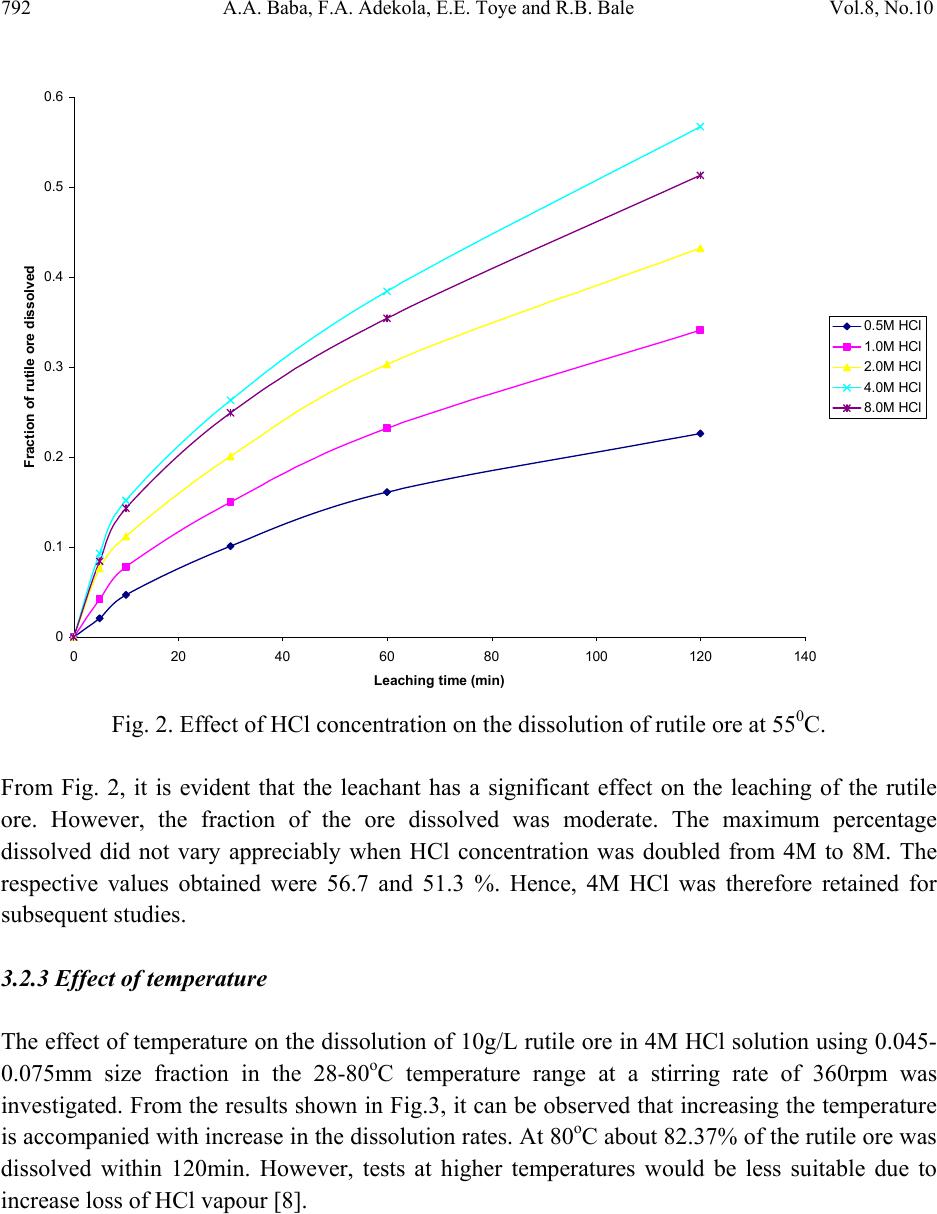 792 A.A. Baba, F.A. Adekola, E.E. Toye and R.B. Bale Vol.8, No.10 0 0.1 0.2 0.3 0.4 0.5 0.6 020 40 60 80100120140 Leaching time (min) Fraction of rutil e ore di ss o lved 0.5M HC l 1.0M HC l 2.0M HC l 4.0M HC l 8.0M HC l Fig. 2. Effect of HCl concentration on the dissolution of rutile ore at 550C. From Fig. 2, it is evident that the leachant has a significant effect on the leaching of the rutile ore. However, the fraction of the ore dissolved was moderate. The maximum percentage dissolved did not vary appreciably when HCl concentration was doubled from 4M to 8M. The respective values obtained were 56.7 and 51.3 %. Hence, 4M HCl was therefore retained for subsequent studies. 3.2.3 Effect of temperature The effect of temperature on the dissolution of 10g/L rutile ore in 4M HCl solution using 0.045- 0.075mm size fraction in the 28-80oC temperature range at a stirring rate of 360rpm was investigated. From the results shown in Fig.3, it can be observed that increasing the temperature is accompanied with increase in the dissolution rates. At 80oC about 82.37% of the rutile ore was dissolved within 120min. However, tests at higher temperatures would be less suitable due to increase loss of HCl vapour [8]. 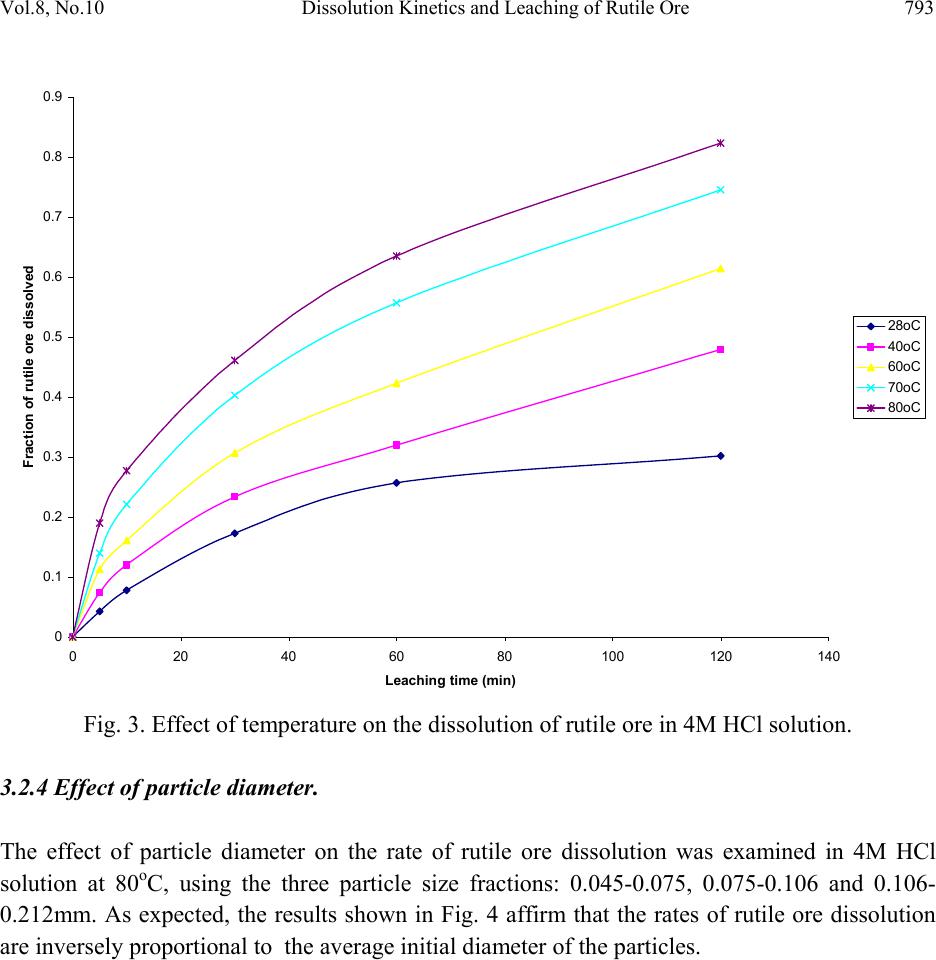 Vol.8, No.10 Dissolution Kinetics and Leaching of Rutile Ore 793 0 0.1 0.2 0.3 0.4 0.5 0.6 0.7 0.8 0.9 020 40 60 80100120140 Leach i ng t ime (mi n) Fraction of rutil e ore di ss o lved 28oC 40oC 60oC 70oC 80oC Fig. 3. Effect of temperature on the dissolution of rutile ore in 4M HCl solution. 3.2.4 Effect of particle diameter. The effect of particle diameter on the rate of rutile ore dissolution was examined in 4M HCl solution at 80oC, using the three particle size fractions: 0.045-0.075, 0.075-0.106 and 0.106- 0.212mm. As expected, the results shown in Fig. 4 affirm that the rates of rutile ore dissolution are inversely proportional to the average initial diameter of the particles.  794 A.A. Baba, F.A. Adekola, E.E. Toye and R.B. Bale Vol.8, No.10 0 0.1 0.2 0.3 0.4 0.5 0.6 0.7 0.8 0.9 020 40 60 80100120140 Leach ing time (mi n ) Fraction of rutil e ore di ss o lved Fig. 4. Effect of particle diameter on the rutile ore dissolution in 4M HCl at 80oC 3.3 Discussion 3.3.1 Dissolution kinetic models Understanding the mechanism of a leaching system is the main objective of this study. Leaching of mineral particle may be described by a number of reaction models already proposed in the literature [7]. Consequently, the dissolution rates of the rutile ore were analyzed with the shrinking core models, under the assumption that the ore is a homogenous spherical solid phase [11]. The leaching of rutile ore by hydrochloric acid may be written as: TiO2 + 4HCl TiCl4 + 2H2O (1) For this study and for better understanding of the leaching mechanism, two established Kinetic models were used, as expressed by the following equations: 1 – (1- X) 1/3 = MkcCAt = k1t (2) dr  Vol.8, No.10 Dissolution Kinetics and Leaching of Rutile Ore 795 1+2 (1- X) – 3 (1- X) 2/3 = 6uMDCAt = k2t (3) Where kc is the first-order rate constant (mmin-1), M is the molecular weight of the solid reactant (kgmol-1), CA is the acid concentration (molm-3), D is the diffusion coefficient (m2min-1), d is the density of the particle (kgm-3), r is the initial radius of the particle (m), X is the fraction of rutile ore dissolved at time t (min), k1(mmi n-1) and k2(m2min-1) are the overall rate constants and u is the stoichiometric coefficient. Equation (2) is applicable to chemically controlled processes and equation (3) referred to the diffusion controlled processes through the porous product layer [8, 12]. Of the two shrinking core models tested, only equation (3) has been found to give a perfect straight line, with a good correlation of 0.96. All the data shown in Fig. 2 were also found to fit the model equation (3) and this is presented in Fig. 5 R 2 = 0.8763 R 2 = 0. 9639 R 2 = 0.9882 R 2 = 0.9979 0 0.02 0.04 0.06 0.08 0.1 0.12 0.14 0.16 0.18 020 40 60 80100120140 Leaching Time (min) 1+2(1-X)-3(1-X) 2/3 0.5M HCl 1.0M HCl 2.0M HCl 4.0M HCl Fig. 5. Plot of 1+2(1-X)-3(1-X)2/3 versus leaching time at different HCl concentrations. The experimental rate constants, k1, were evaluated from the slopes in Fig. 5 and the plot of lnk1 vs ln[HCl] were made as illustrated in Fig. 6. dr2  796 A.A. Baba, F.A. Adekola, E.E. Toye and R.B. Bale Vol.8, No.10 Fig. 6. Plot of lnk1 versus ln[HCl] The slope of the resulting plot (Fig. 6) gave the dissolution reaction order of 1.0, with respect to hydrogen ion concentration, for HCl concentrations ≤ 4M. This showed that the dissolution reaction follows a first order mechanism. Furthermore, the linearization of the data in Fig. 3 was done using equation 3. This relation is presented in Fig. 7. R 2 = 0.99 61 -9 -8.8 -8.6 -8.4 -8.2 -8 -7.8 -7.6 -7.4 -7.2 -7 -6.8 -6.6 -1-0.50 0.5 1 1.5 2 ln[HCl] lnk 1  Vol.8, No.10 Dissolution Kinetics and Leaching of Rutile Ore 797 R 2 = 0. 9844 R 2 = 0.9986 R 2 = 0.9996 R 2 = 0.9998 R 2 = 0.9994 0 0.05 0.1 0.15 0.2 0.25 0.3 0.35 0.4 0.45 020 40 60 80100120140 Contact time (min) 1+2(1-X)-3(1-X) 2/3 28oC 40oC 60oC 70oC 80oC Fig. 7. Plot of data extracted in Fig. 3. The apparent rate constants, k1, k2 for the two shrinking core models examined at different temperatures were calculated form the slopes of the straight lines obtained. These values and their corresponding correlation coefficient rate are summarized in Table 3. Table 3. The rate constants k1, k2 values with their correlation coefficient for rutile ore dissolution in 4M HCl solution at different temperatures. Temperature (oC) Apparent rate constants Correlation coefficient k1 (10-4 min-1) k2 (10-4min-1) k1 k 2 28 0.93 3.17 0.8731 0.9844 40 1.61 8.67 0.9344 0.9986 60 2.25 15.50 0.9215 0.9994 70 3.02 25.63 0.8958 0.9996 80 3.63 34.51 0.9016 0.9998  798 A.A. Baba, F.A. Adekola, E.E. Toye and R.B. Bale Vol.8, No.10 The apparent rate constant, k2 derived from the slopes of the line in Fig. 7 were used to obtain the Arrhenius relation in Fig. 8, from which the energy of activation, Ea, of 42.28kJ/mol was calculated for the dissolution process. R 2 = 0.9998 -8.5 -8 -7.5 -7 -6.5 -6 -5.5 2.8 2.933.1 3.2 3.3 3.4 T -1 X 10 -3 (K -1 ) lnk 2 Fig. 8. Arrhenius relation of reaction rate against the reciprocal of temperature, for the data extracted from Fig. 7. The calculated activation energy from Fig. 8 seems to suggest a chemical control. Recent studies showed that some diffusion controlled reactions have unusually high activation energy [8, 13, and 16] For example, the reported energy of activation for the diffusion controlled dissolution of titanium and iron from ilmenite by hydrochloric acid solution was 48.9 and 53.7kJ/mol, respectively [14]. On closer examination, it appears that the rate controlling mechanism of heterogeneous dissolution reactions is sometimes better predicted from plots of the kinetic equations rather than from the activation energy value. In some instances, the same mechanistic information is derivable from both variables [8]. The linearization of the kinetic curves in Fig. 4 was carried out by means of equation (3). The values of the rate constants were plotted versus the reciprocal of the particle radii (1/ro), yielding a linear relationship with a correlation coefficient of 0.9996 (Fig. 9). On the contrary, the plot of  Vol.8, No.10 Dissolution Kinetics and Leaching of Rutile Ore 799 the rate constants as a function of the square of particle radii (1/r02) did not give a linear relationship. R 2 = 0. 9996 0 5 10 15 20 25 30 00.01 0.02 0.03 0.04 0.05 0.06 1/r o k X 10 -4 Fig. 9. Dependence of rate constant (k) on 1/ro. Hence, the linear dependence of the rate constant on the inverse of particle radius suggests that the surface chemical reaction is the rate controlling step for the dissolution process [15]. 3.3.2 Composition of the residual products The X-ray diffraction analysis of the solid residual products resulting from the leaching at optimal conditions are presented in Fig. 10. The leaching residue amounted to 18% of the initial solid material. Its XRD data shown in Fig. 10 revealed the presence of silica (-quartz) as the only product identified. It is very important to note the near absence of Ti and Fe in the residual product.  800 A.A. Baba, F.A. Adekola, E.E. Toye and R.B. Bale Vol.8, No.10 Fig. 10. The X-ray diffraction spectrum of the 10g/L solid residue at 80oC in 4M HCl, using 0.045-0.075mm particle diameter, showing - SiO2 as the major peaks identified at various d- spacing. (1): -SiO2 (46-1045). 4. CONCLUSIONS Based on the results of the mineralogical and leaching investigations, the following results can be drawn from the study. (i) The Inductively Coupled Plasma-Mass Spectrometry technique showed that the rutile mineral used in this study exists mainly as TiO2 with matals such as Nb, Cr and Ag occuring as minor elements. Other metals detectected at trace levels were W, Sb, Th, V, Te and Mn. The X- ray diffraction analysis (XRD) , however , confirmed the originality of the ore and it reveals the presence of other associated minerals including Fe2O3, -SiO2, Fe3Ti3O10 and Ti3O5. (ii) Both HCl concetration and temperature have a significant influence on the rutile ore dissolution. The reaction rate also increases with increasing stirring speed and decreasing particle diameter. With 4M HCl solution and at a temperature of 80oC using 0.045-0.075mm particle diameter, about 82.3% of the 10g/L of the rutile ore was activation energy of 42.28kJ/mol has been calculated for the process while the reaction order with respect to hydrogen ion concentration follows a first-order mechanism. (iii) The X-ray diffraction also comfirmed the -quartz (-SiO2) as the main constituent of the post-leaching residual product, with near absence of titanium and iron in the residue. (iv) The results of the leaching investigations indicated that the shrinking core model for spherical particles is applicable. The reaction mechanism for the dissolution is diffusion controlled with surface chemical reaction as the rate controlling step.  Vol.8, No.10 Dissolution Kinetics and Leaching of Rutile Ore 801 REFERENCES [1] W .A. Deer, R. A. Howie and J. Zussman An introduction to the Rock-forming minerals. 2nd ed., Longman, England, 1992, 548-551. [2] C. Ikpat and N. H. Ibanga Nigeria’s mineral resources: A case for resource control. Raw Materials Res. and Dev. Council, Abuja-Nigeria. 2005 Special Publication, 2005, 17-33. [3] A .I. Ogbonna, S. M. Nwakandu and O. O. Onyemaobi. Strategic mineral deposits in Nigeria. Proceedings of the Nigerian Metallurgical Society, Abuja-Nigeria, 1999, 59-62. [4] Mineral Information Institute. 2009. http://www.mii.org. Retrieved on 13/06/2009. [5] D. Ulrike. The surface of Titanium-dioxide. Surface Science Reports.2005, 48(5-8), 53-59. [6] A. O. Adebayo, K. O. Ipinmoroti and O. O. Ajayi Leaching of sphalerite with Hydrogen peroxide and Nitric acid. J. Min and Mat. Characterization and Engr., 2006, 5(2), 167-177. [7] G. Ucar. Kinetics of spahlerite dissolution by sodium chlorate in hydrochloric acid. Hydrometallurgy, 2009, 96, 39-43. [8] E. O. Olanipekun. A kinetic study of the leaching of a Nigerian ilmenite ore by hydrochloric acid. Hydrometallurgy, 1999, 53, 1-10. [9] W. O. Siyanbola, A. Y. Fasasi, I. I. Funtua, O. M. Afolabi, T. A. Adesiyan and A. R. Adetunji. Elemental composition of rutile from South-western Nigeria using X-ray techniques. Nuclear instruments and methods in Physics Research. Section B, 2004, 215 (1-2), 240-245. [10] A. A. Baba, F. A. Adekola, O. I Dele-ige and R.B. Bale. Investigation of dissolution Kinetics of a Nigerian Tantalite ore in Nitric acid. J. Min. and Mat. Characterization and Engr.2007, 7(1), 83-95. [11] O. Levenspiel. Chemical Reaction Engineering 2nd ed., Wiley, New York, 1972, 359-368. [12] S. Aydogan, M. Erdemoglu, G. Ucar and A. Aras. Kinetics of galena dissolution in nitric acid solutions with hydrogen peroxide. Hydrometallurgy.2007, .88, 52-57. [13] A.A. Baba, F. A. Adekola and R.B. Bale. Development of a combined pyro- and hydro- metallurgical route to treat spent zinc-carbon batteries. J. Hazardous materials. 2009, 171(1-3), 838-844. DOI: 10.1016/j.jhazmat. 2009.06.068 [14] T. Tsuchida, E. Narita, H. Takuechi, M. Adachi, T. Okabe. .Manufacture of high pure titanium (IV) oxide by the chloride process: I. Kinetic Study on leaching of ilmenite ore in concentrated hydrochloric acid solution. Bull. Chem. Soc., Japan, 1982, .55(6), 1934-1938. In: E. Olanipekun Hydrometallurgy, 1999 53, 1-10. [15] M. M. Antonijevic, Z. D. Jankovic and M. D. Dimitrijevic. Kinetics of chalcopyrite dissolution by hydrogen peroxide in sulphuric acid. Hydrometallurgy, 2004, 71(3-4), 329-334. [16] A. A. Baba, F. A. Adekola and R. B. Bale. Study of dissolution kinetics of a Nigerian Cassiterite ore by hydrochloric acid. Science Focus, 2009, 14(2), 198-207. |