Paper Menu >>
Journal Menu >>
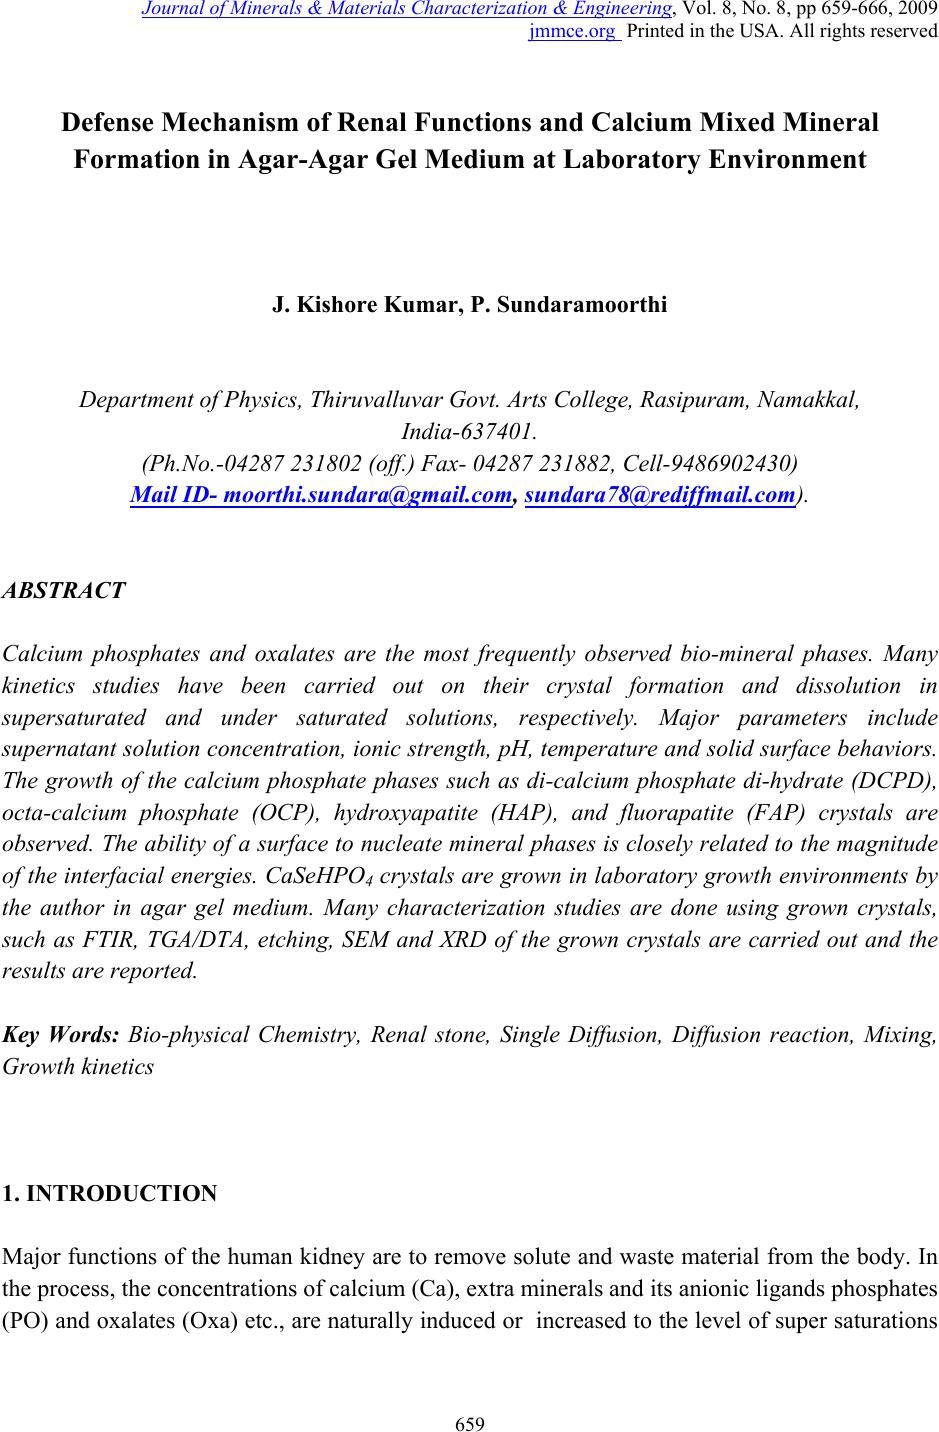 Journal of Minerals & Materials Characterization & Engineering, Vol. 8, No. 8, pp 659-666, 2009 jmmce.org Printed in the USA. All rights reserved 659 Defense Mechanism of Renal Functions and Calcium Mixed Mineral Formation in Agar-Agar Gel Medium at Laboratory Environment J. Kishore Kumar, P. Sundaramoorthi Department of Physics, Thiruvalluvar Govt. Arts College, Rasipuram, Namakkal, India-637401. (Ph.No.-04287 231802 (off.) Fax- 04287 231882, Cell-9486902430) Mail ID- moorthi.sundara@gmail.com, sundara78@rediffmail.com). ABSTRACT Calcium phosphates and oxalates are the most frequently observed bio-mineral phases. Many kinetics studies have been carried out on their crystal formation and dissolution in supersaturated and under saturated solutions, respectively. Major parameters include supernatant solution concentration, ionic strength, pH, temperature and solid surface behaviors. The growth of the calcium phosphate phases such as di-calcium phosphate di-hydrate (DCPD), octa-calcium phosphate (OCP), hydroxyapatite (HAP), and fluorapatite (FAP) crystals are observed. The ability of a surface to nucleate mineral phases is closely related to the magnitude of the interfacial energies. CaSeHPO4 crystals are grown in laboratory growth environments by the author in agar gel medium. Many characterization studies are done using grown crystals, such as FTIR, TGA/DTA, etching, SEM and XRD of the grown crystals are carried out and the results are reported. Key Words: Bio-physical Chemistry, Renal stone, Single Diffusion, Diffusion reaction, Mixing, Growth kinetics 1. INTRODUCTION Major functions of the human kidney are to remove solute and waste material from the body. In the process, the concentrations of calcium (Ca), extra minerals and its anionic ligands phosphates (PO) and oxalates (Oxa) etc., are naturally induced or increased to the level of super saturations  660 J. Kishore Kumar, P. Sundaramoorthi Vol.8, No.8 and create the risk factor of crystal deposition or formation. Then extra adherence of intra tubular calcium with mineral phosphate (CaMinP) and/or calcium with mineral oxalates (CaMinOx) crystals to undifferentiated cum regenerating tubular epithelial cells defines intra tubular nephro mineral calcinosis [1–3]. These mineral crystals-bearing epithelia might compromise proper tubular function as undifferentiated cells unable exert the multiple functional processes of growth, fully polarized epithelial cells. In addition, intra tubular-adhered crystals can engender inflammation and may hinder tubular fluid flow dynamics [4]. However; the kidney has developed own by many defense mechanisms acting at different levels. At the physiological level, a high concentration of calcium with minerals in itself is able to reduce antidiuretic hormone-stimulated water permeability of the collecting ducts through the calcium with mineral sensing receptor, leading to an increased urinary volume and a reduced risk of supersaturation [5-6]. At the physicochemical observation levels, the urinary tracts supersaturation capability can be induced and increased crystal formation or deposition, growth, and aggregation naturally can be delayed or prevented by nano-micro and macromolecular urinary constituents such as citrate, magnesium, and proteins etc. [7–10]. At the base levels of crystal–cell interactions, normally differentiated tubular epithelia have no affinity for crystals and crystal retentions can be prevented by coating crystals with urinary micro and macromolecules [1-2, 7, 11-12]. The combined actions of all these mechanisms make the kidney intrinsically prevent to intra tubular nephro-mineral calcinosis. It is obvious from human pathology and experimental studies that extensive nephro mineral calcinosis, as observed in acute mineral phosphate nephropathy and primary hyper mineral oxaluria, which leads to renal damage and functional deterioration [13]. The effect of less-extensive intra tubular crystal adhesion on renal function and tubular morphology is less understanding. Kidneys in which crystal adhesion exceeds a certain minimum threshold should deteriorate, where as below this minimum threshold the kidney may (continuously) clear the adhered crystal deposits and secure renal functions. 2. MATERIALS AND METHODS CaSeHP crystals are grown in laboratory growth environment. The dissociation of phosphoric acid with gel system can be represented by three-dissociation equilibrium and the presence of various ions at various pH values are reported [6]. Based on these results, the gel pH in the range from 6 to 10 has been used (Milwaukee QS-MN pH-600, packet digital pH-meter are used for measurements) in which the HPO42- ions dominates or alone exists. This decreases the possibility of SeHP crystals occurring during the growth of CaSeHP. The crystallization apparatus employed are glass thick walled 30 mm diameter and 180 mm long glass. The chemicals used are Excelar-Qualigens (E-Q) AR grade ZnSe, CaCl2 and phosphoric acid (Sp.gr.1.75). The agar gels are prepared as per the literature [7]. One of the reactant phosphoric acid is mixed with agar gel at desired gel density and elevated temperatures. After the gel set, the supernatant (ZnSe+CaCl2) at a required mole solution is slowly added along the walls of the growth columns over the set gel and the tubes are tightly closed to prevent evaporation during the growth period.  Vol.8, No.8 Defense Mechanism of Renal Functions 661 The growth systems are allowed to react within the gel medium and the following chemical reaction takes place. ZnSe+CaCl2 + [H3PO4+ agar gel]ÆCaSeHPO4 + By products ----- (1) Se2-+Ca2++HPO42-ÆCaSeHPO4-------- (2) 3. RESULT AND DISCUSSION The CaSeHPO4 crystals are grown in laboratory growth face by applying various growth parameters. The growth of CaSeHPO4 crystals in SDP laboratory environment is shown in Fig.1. The growth parameters of CaSeHPO4 crystals in single diffusion process (SDP) are tabulated in Table-1 and the bold letters indicates the optimum growth parameters and the growth period is ten months. 3.1 FTIR Spectral Analysis of CaSeHP Crystal FTIR Spectrometer having KBr pellets sample holder and KBr detector is used for the analysis. The KBr pellet samples are used and the absorption frequencies range from 600 to 4000 cm-1. The absorption bonds, absorption frequencies and percentages of transmittance of CaSeHP crystal is recorded and compared with the reported values. The important spectral characteristics of CaSeHP is that it shows grouping of five bands from 3477 cm-1 to 2807 cm-1 which is due to symmetric and asymmetric O-H stretch. The band at 692.02 cm-1 may be due to O-H out of plane vibration. Phosphate group usually has absorption frequencies from 1000 cm-1 to 1100 cm-1. These values confirm the presence of grown crystal constituents [14-16]. Figure-1 Growth of CaSeHPO4 crystals at laboratory environment  662 J. Kishore Kumar, P. Sundaramoorthi Vol.8, No.8 Table-1 Growth parameters of CaSeHP crystals in single diffusion process (SDP) 3.2 Thermo gravimetric (TGA and DTA) analysis of CaSeHP crystal The TGA and DTA of CaSeHP crystals are carried out by STA 11500-PLTS instrument. The CaSeHP crystal of 9.649mg sample is taken to the TGA and DTA process. The TGA is started from room temperature to 9000 C by heating at a constant rate. The % of weight of the sample in CaSeHP at a particular temperature is tabulated in Table-2 [14-16]. In the differential analysis five exothermic and four endothermic peaks are observed. Figure-2 shows the TGA/DTA spectrum of CaSeHP crystal. Gel density gm /cc OPA concentration (inner reactant mixed with agar gel) in N Gel+ OPA pH value Gel setting time in hrs Supernatant Concentration ZnSe+CaCl2 (M) Nucleation observed in hrs Growth period in days Growth observed inside the growth medium 1.04 1 6.4 6.6 6.9 7.3 48 16 8 26 1:1 -do- -do- -do- 45 46 32 90 370 Good single, poly crystals Liesegan g rings are formed 1.04 1. 5 6.6 6.9 7.0 8.0 36 14 1 98 -do- -do- -do- -do- 20 52 86 98 280 1.05 1 6.4 6.8 7.1 7.5 46 15 3 28 -do- -do- -do- -do- 60 32 64 88 330 1.05 2 6.5 6.8 7.4 7.7 88 11 27 58 -do- -do- -do- -do- 20 40 72 92 340 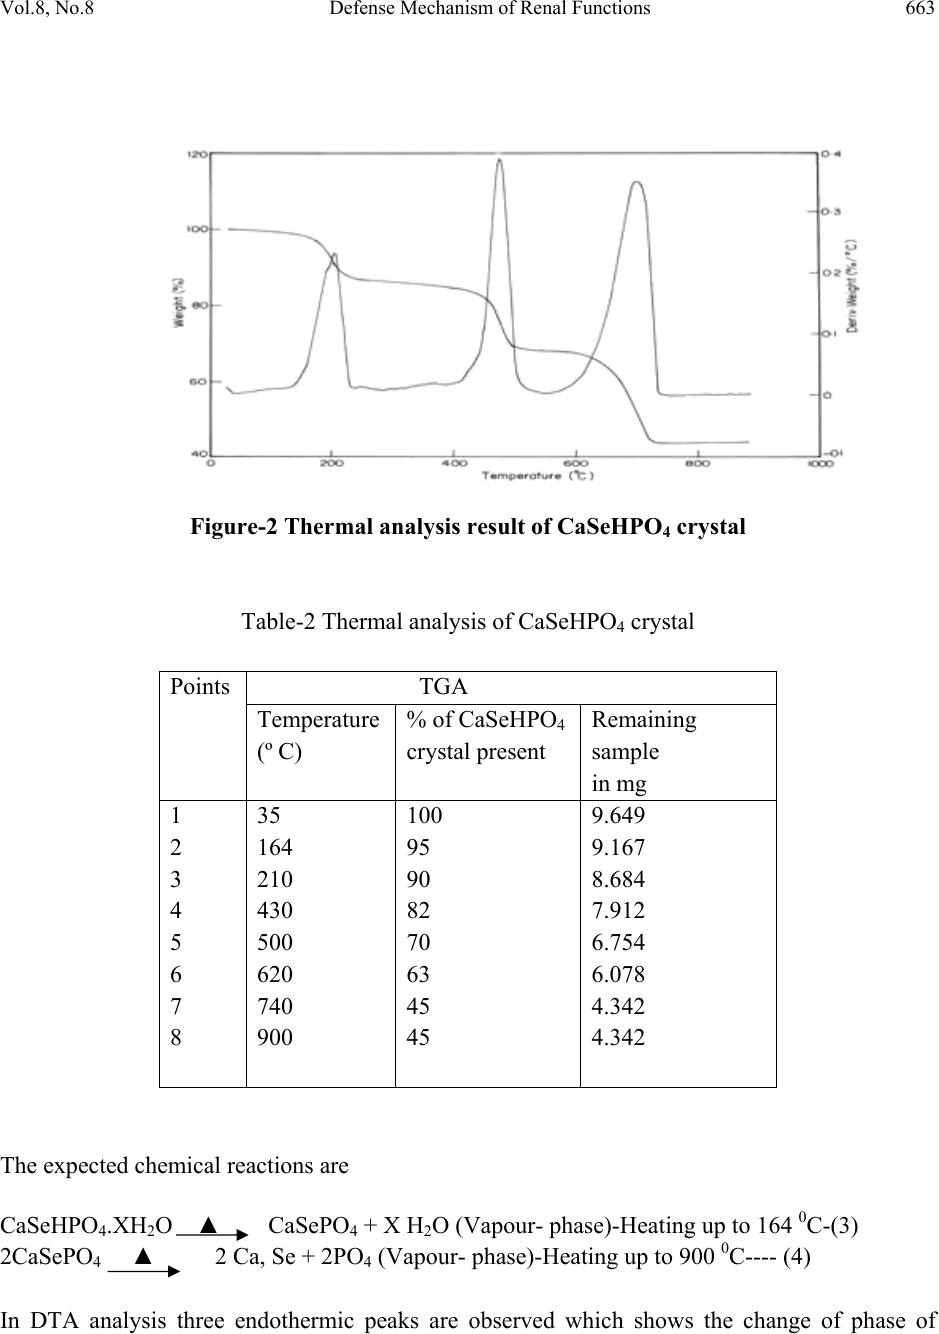 Vol.8, No.8 Defense Mechanism of Renal Functions 663 Figure-2 Thermal analysis result of CaSeHPO4 crystal Table-2 Thermal analysis of CaSeHPO4 crystal Points TGA Temperature (º C) % of CaSeHPO4 crystal present Remaining sample in mg 1 2 3 4 5 6 7 8 35 164 210 430 500 620 740 900 100 95 90 82 70 63 45 45 9.649 9.167 8.684 7.912 6.754 6.078 4.342 4.342 The expected chemical reactions are CaSeHPO4.XH2O ▲ CaSePO4 + X H2O (Vapour- phase)-Heating up to 164 0C-(3) 2CaSePO4 ▲ 2 Ca, Se + 2PO4 (Vapour- phase)-Heating up to 900 0C---- (4) In DTA analysis three endothermic peaks are observed which shows the change of phase of 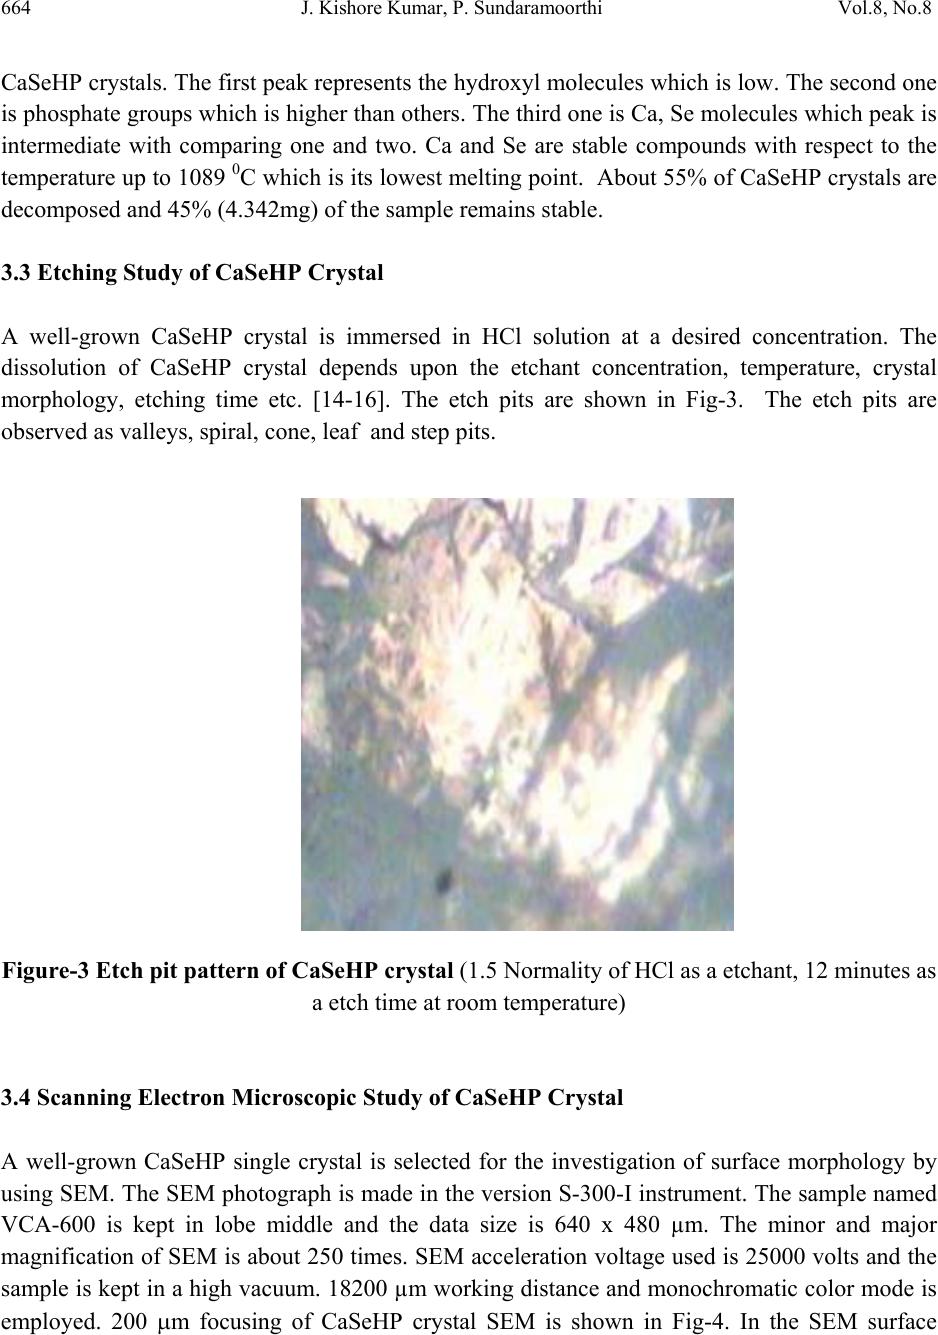 664 J. Kishore Kumar, P. Sundaramoorthi Vol.8, No.8 CaSeHP crystals. The first peak represents the hydroxyl molecules which is low. The second one is phosphate groups which is higher than others. The third one is Ca, Se molecules which peak is intermediate with comparing one and two. Ca and Se are stable compounds with respect to the temperature up to 1089 0C which is its lowest melting point. About 55% of CaSeHP crystals are decomposed and 45% (4.342mg) of the sample remains stable. 3.3 Etching Study of CaSeHP Crystal A well-grown CaSeHP crystal is immersed in HCl solution at a desired concentration. The dissolution of CaSeHP crystal depends upon the etchant concentration, temperature, crystal morphology, etching time etc. [14-16]. The etch pits are shown in Fig-3. The etch pits are observed as valleys, spiral, cone, leaf and step pits. Figure-3 Etch pit pattern of CaSeHP crystal (1.5 Normality of HCl as a etchant, 12 minutes as a etch time at room temperature) 3.4 Scanning Electron Microscopic Study of CaSeHP Crystal A well-grown CaSeHP single crystal is selected for the investigation of surface morphology by using SEM. The SEM photograph is made in the version S-300-I instrument. The sample named VCA-600 is kept in lobe middle and the data size is 640 x 480 µm. The minor and major magnification of SEM is about 250 times. SEM acceleration voltage used is 25000 volts and the sample is kept in a high vacuum. 18200 µm working distance and monochromatic color mode is employed. 200 μm focusing of CaSeHP crystal SEM is shown in Fig-4. In the SEM surface 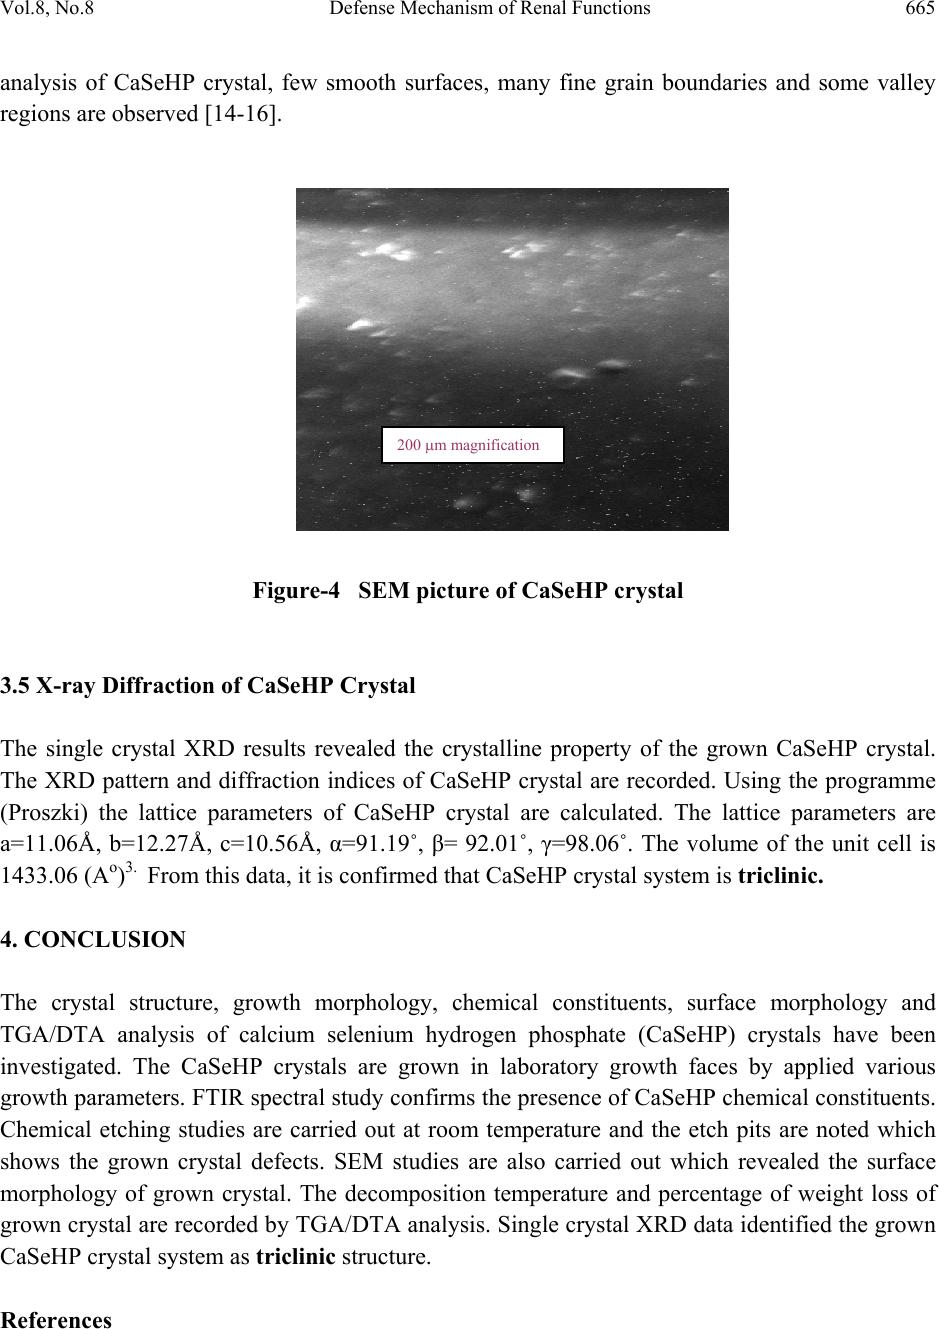 Vol.8, No.8 Defense Mechanism of Renal Functions 665 analysis of CaSeHP crystal, few smooth surfaces, many fine grain boundaries and some valley regions are observed [14-16]. Figure-4 SEM picture of CaSeHP crystal 3.5 X-ray Diffraction of CaSeHP Crystal The single crystal XRD results revealed the crystalline property of the grown CaSeHP crystal. The XRD pattern and diffraction indices of CaSeHP crystal are recorded. Using the programme (Proszki) the lattice parameters of CaSeHP crystal are calculated. The lattice parameters are a=11.06Å, b=12.27Å, c=10.56Å, α=91.19˚, β= 92.01˚, γ=98.06˚. The volume of the unit cell is 1433.06 (Ao)3. From this data, it is confirmed that CaSeHP crystal system is triclinic. 4. CONCLUSION The crystal structure, growth morphology, chemical constituents, surface morphology and TGA/DTA analysis of calcium selenium hydrogen phosphate (CaSeHP) crystals have been investigated. The CaSeHP crystals are grown in laboratory growth faces by applied various growth parameters. FTIR spectral study confirms the presence of CaSeHP chemical constituents. Chemical etching studies are carried out at room temperature and the etch pits are noted which shows the grown crystal defects. SEM studies are also carried out which revealed the surface morphology of grown crystal. The decomposition temperature and percentage of weight loss of grown crystal are recorded by TGA/DTA analysis. Single crystal XRD data identified the grown CaSeHP crystal system as triclinic structure. References 200 μ m magnification  666 J. Kishore Kumar, P. Sundaramoorthi Vol.8, No.8 1. Asselman M, Verhulst A, De Broe ME., et al., J Am Soc Nephrol 2003; 14: 3155–3166. 2. Verhulst A, Asselman M, Persy VP., et al., J Am Soc Nephrol 2003; 14: 107–115. 3. Verhulst A, Asselman M, De Naeyer S., et al., Kidney Int 2005; 68: 1643–1647. 4. Umekawa T, Chegini N, Khan SR. Kidney Int. 2002; 61: 105–112. 5. Hebert SC., Kidney Int. 1996; 50: 2129–2139. 6. Hebert SC, Brown EM, Harris HW., J. Exp. Biol. 1997; 200(Part 2): 295–302. 7. Jablczynski.K., Bull. Soc. Chim. France., 1923; 33 1592. 8. Huang. HY, Zhu. XH et al., Kidney Int. 2004; 66: 1159–1166. 9. Worcester EM., Am. J. Physiol Renal Physiol. 2006; 291: F1123–F1131. 11. Verkoelen CF, van der Boom BG, Am. J. Physiol. 1998; 274(5 Part 2): F958–F965. 12. Kumar V, Farell G, Lieske JC., J. Urol. 2003; 170: 221–225. 13. Markowitz GS, Stokes MB, Radhakrishnan J, et al., J. Am. Soc. Nephrol. 2005; 16: 3389–3396. 14. Sundaramoorthi. P, Kalainathan. S, Bio-chem. Engg. journal, 2007; 34, 244. . 15. Sundaramoorthi P, Kalainathan.S, J. Min. Mat. Char. Engg. 2007; 6 (1) 33. 16. Sundaramoorthi. P, Kalainathan.S , Asian J. Chem.,2007; 19 (5) 3739. |