Paper Menu >>
Journal Menu >>
 Journal of Minerals & Materials Characterization & Engineering, Vol. 8, No. 8, pp 647-658, 2009 jmmce.org Printed in the USA. All rights reserved 647 Model for Predicting the Quantity of Water Evaporated during Initial Stage Drying of Wet Clay Designated for Production of Bricks C. I. Nwoye Department of Materials and Metallurgical, Engineering Federal University of Technology, Owerri, Nigeria. Contact: chikeyn@yahoo.com ABSTRAC T Model for predicting the quantity of water evaporated during drying of clay at a temperature range 80-1100C has been derived. The model; E=exp[0.3424(LogT)2.3529] indicates that the quantity of evaporated water during the drying process is dependent on the drying temperature, the evaporating surface being constant. The validity of the model is rooted in the expression (lnE x Log β)N = Log T since both sides of the expression are correspondingly approximately equal to 2. The respective deviation of the model-predicted quantity of evaporated water from the corresponding experimental value is less than 20% which is quite within the acceptable deviation range of experimental results, hence depicting the usefulness of the model. Water evaporation per unit rise in the drying temperature evaluated from experimental and model-predicted results are 0.078 and 0.0502g/0C respectively, indicating proximate agreement. Keywords: Model, Water Evaporation, Drying, Clay. 1. INTRODUCTION It has been reported [1] that the contents of the basic clay materials are divided into three groups. The first group involves clays containing mainly the mineral kaolinite. The second groups are clays containing mineral rnontmorillorite, while the third group is clays which are intermediate product of disintegration of mica into kaolin. Unal [2] reported that the structure of sinters and pellets may be divided into two parts viz, the mineral and the pores. It was stated that the properties of pellets and sinters are closely related to the mineral constituents.  648 C. I. Nwoye Vol.8, No.8 Furnass [3] discovered that voids volume in packed dispersed powder depend on the ratio of smallest size (Ss) to largest size (Ls) particle as well as the percentage of constituent monosized particles. It was concluded that the smaller the (Ss/Ls) ratio, the more continuous the distribution and the lower the void volume of the system. Singer and Singer [4] found that on heating dried clays, water is given off. With time, a hard but porous piece forms. A swollen appearance might occur during the release of some gases, but overall shrinkage must occur when verifications set in leading to a strong dense piece. Past report [5] has shown that chemical composition of the pellet, pelletisation parameters and firing conditions affect the shrinkage of clay pellets. He posited that the rate of chemical reaction is very much dependent on the gas-solid contact area, which is mostly governed by the porosity of the pellet. It was stated that shrinkage of clay is probably due to volume change resulting from evacuation of water from the voids, reduction of the size of the pores as well as decrease in the interparticle separation. It has been reported [6] that fine particles shrink more, are denser and exhibit excellent mechanical properties. Further studies [6] carried out to investigate the relationship between particle size and size distribution with linear drying shrinkage, firing shrinkage and apparent porosity shows that no visible relationship exists between particle size and linear drying shrinkage. Based on the discovered fact that finer particles shrink more, Viewey and Larrly[6] concluded that the finer the particle size, the lesser the apparent porosity and greater the bulk density. The behaviour of ceramic products has been found to be very dependent on their composition, grain size, grain distribution, and structure of grain and pores [7]. Nwoye [5] also posited that the grain size and grain distribution of the clays have significant effect on their physical and technological properties (binding ability, shrinkage and plasticity). It has been reported [1] that pores are deleterious to the strength of ceramics not only because they reduce cross-sectioned area over which the load is applied but more importantly act as stress concentrators. Pore deformation mechanism in shrinking Nigeria clays was studied over a range of heating temperature from 1000 to 13000C [8]. The results of the study indicate that pores pre-existing before sintering deformed by the collapsing of the wall surrounding the pores. It was discovered [8] that the wall surrounding the pre-existing pores collapsed as a result of the weakening of the clay-binder contact surface and loosening of the macro structure of the formed clays, occasioned by the response of the clay and binder to temperature increase. Nwoye [8] also found that binder burn-out which releases gases, elimination of gaseous product of decomposition and oxidation of some clay constituents as well as evaporation of free water between clay and binder particles, all played very vital roles in decreasing the pre-existing interparticle separation hence deforming the pores. Nwoye [9] studied the effect of porosity on the shrinkage behavior of clay pellets and briquettes of different porosities. The result of the investigation indicates that shrinkage  Vol.8, No.8 Model for Predicting the Quantity of Water Evaporated 649 which is a major cause of rupture in fired clay increased with decrease in porosity. It was also discovered [9] that the porosity of pellet/briquette plays important role in controlling and determining the shrinkage index of the pellet. Reed [10] described firing as having three stages through which it proceeds; preliminary reactions which include binder burnout, elimination of gaseous product of decomposition and oxidation, sintering as well as cooling which may include thermal and chemical annealing. Several works [1, 6, 10, 11] have been carried out on shrinkage of clay during drying. In all these works, porosity has been shown to influence the swelling and shrinkage behaviour of clay products of different geometry. It has been reported [10] that drying occurs in three stages; increasing rate, constant and decreasing rate. He pointed out that during the increasing rate; evaporation rate is higher than evaporating surface hence more water is lost. At constant rate, the evaporation rate and evaporation surface are constant. He posited that shrinkage occurs at this stage. Keey [11] also in a similar study suggested that at this stage, free water is removed between the particles and the interparticle separation decreases, resulting in shrinkage. During the decreasing rate, particles make contacts as water is removed, which causes shrinkage to cease. Model for calculating the volume shrinkage resulting from the initial air-drying of wet clay has been derived [12]. The model; θ = γ3–3γ2 + 3γ (1) calculates the volume shrinkage θ when the value of dried shrinkage γ, experienced during air-drying of wet clays is known. The model was found to be third-order polynomial in nature. Olokoro clay was found to have the highest shrinkage during the air drying condition, followed by Ukpor clay while Otamiri clay has the lowest shrinkage. Volume shrinkage was discovered to increase with increase in dried shrinkage until maximum volume shrinkage was reached, hence a direct relationship. Nwoye et al. [13] derived a model for the evaluation of overall volume shrinkage in molded clay products (from initial air-drying stage to completion of firing at a temperature of 12000C). It was observed that the overall volume shrinkage values predicted by the model were in agreement with those calculated using conventional equations. The model; ST = α3+γ3-3(α2+γ2)+3(α+γ) (2) depends on direct values of the dried γ and fired shrinkage α for its precision. Overall volume shrinkage was found to increase with increase in dried and fired shrinkages until overall volume shrinkage reaches maximum. Nwoye [14] derived a model for calculating the quantity of water lost by evaporation during oven drying of clay at 900C. The model; γ = exp[(lnt)1.0638- 2.9206] (3) indicated that the quantity of evaporated water, γ during the drying process is dependent on the drying time t, the evaporating surface being constant. The validity of the model was found to be rooted in the expression (Logβ + lnγ)N = lnt. 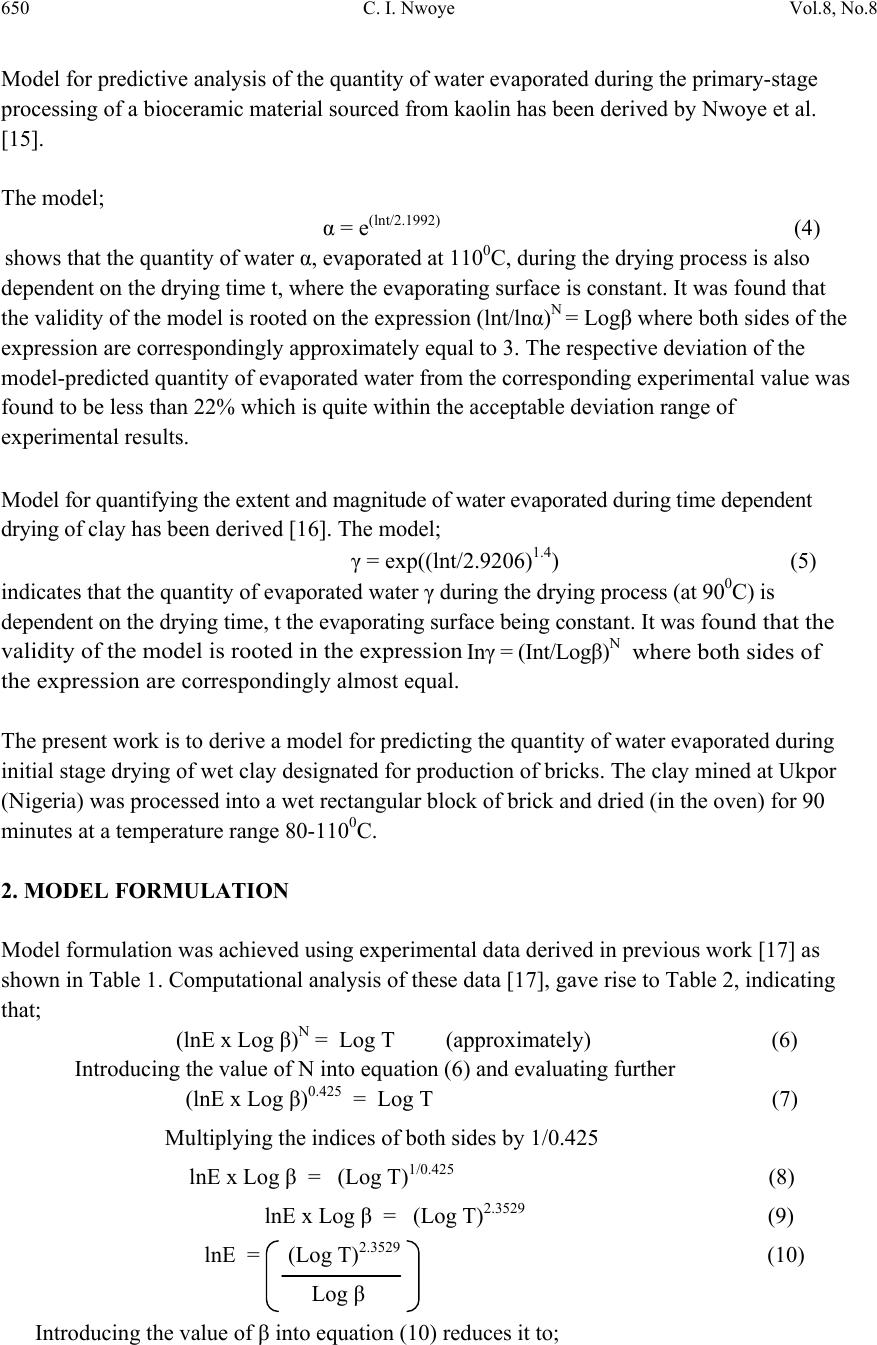 650 C. I. Nwoye Vol.8, No.8 Model for predictive analysis of the quantity of water evaporated during the primary-stage processing of a bioceramic material sourced from kaolin has been derived by Nwoye et al. [15]. The model; α = e(lnt/2.1992) (4) shows that the quantity of water α, evaporated at 1100C, during the drying process is also dependent on the drying time t, where the evaporating surface is constant. It was found that the validity of the model is rooted on the expression (lnt/lnα)N = Logβ where both sides of the expression are correspondingly approximately equal to 3. The respective deviation of the model-predicted quantity of evaporated water from the corresponding experimental value was found to be less than 22% which is quite within the acceptable deviation range of experimental results. Model for quantifying the extent and magnitude of water evaporated during time dependent drying of clay has been derived [16]. The model; γ = exp((lnt/2.9206)1.4) (5) indicates that the quantity of evaporated water γ during the drying process (at 900C) is dependent on the drying time, t the evaporating surface being constant. It was found that the validity of the model is rooted in the expression Inγ = (Int/Logβ)N where both sides of the expression are correspondingly almost equal. The present work is to derive a model for predicting the quantity of water evaporated during initial stage drying of wet clay designated for production of bricks. The clay mined at Ukpor (Nigeria) was processed into a wet rectangular block of brick and dried (in the oven) for 90 minutes at a temperature range 80-1100C. 2. MODEL FORMULATION Model formulation was achieved using experimental data derived in previous work [17] as shown in Table 1. Computational analysis of these data [17], gave rise to Table 2, indicating that; (lnE x Log β)N = Log T (approximately) (6) Introducing the value of N into equation (6) and evaluating further (lnE x Log β)0.425 = Log T (7) Multiplying the indices of both sides by 1/0.425 lnE x Log β = (Log T)1/0.425 (8) lnE x Log β = (Log T)2.3529 (9) lnE = (Log T)2.3529 (10) Log β Introducing the value of β into equation (10) reduces it to; 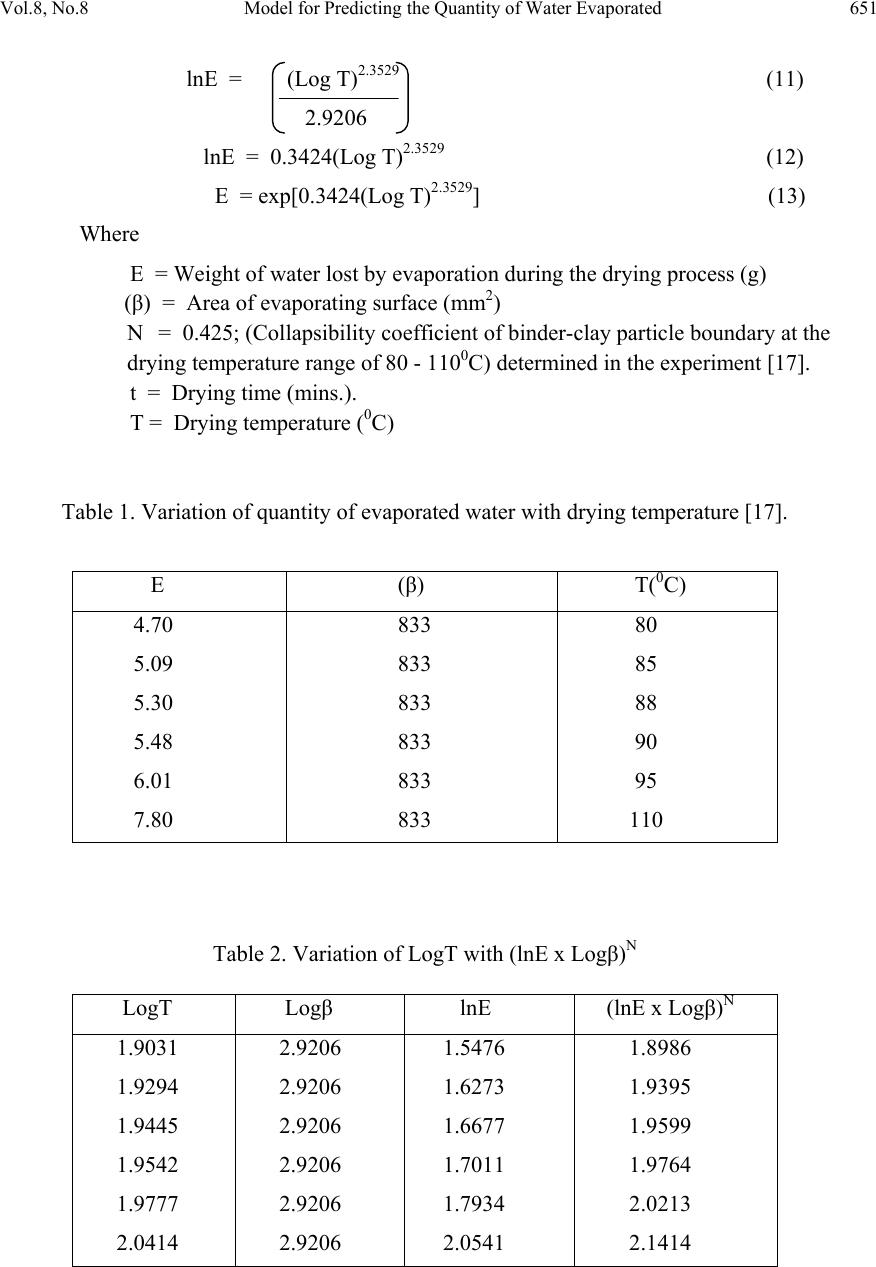 Vol.8, No.8 Model for Predicting the Quantity of Water Evaporated 651 lnE = (Log T)2.3529 (11) 2.9206 lnE = 0.3424(Log T)2.3529 (12) E = exp[0.3424(Log T)2.3529] (13) Where E = Weight of water lost by evaporation during the drying process (g) (β) = Area of evaporating surface (mm2) N = 0.425; (Collapsibility coefficient of binder-clay particle boundary at the drying temperature range of 80 - 1100C) determined in the experiment [17]. t = Drying time (mins.). T = Drying temperature (0C) Table 1. Variation of quantity of evaporated water with drying temperature [17]. Table 2. Variation of LogT with (lnE x Logβ)N E (β) T(0C) 4.70 5.09 5.30 5.48 6.01 7.80 833 833 833 833 833 833 80 85 88 90 95 110 LogT Logβ lnE (lnE x Logβ)N 1.9031 1.9294 1.9445 1.9542 1.9777 2.0414 2.9206 2.9206 2.9206 2.9206 2.9206 2.9206 1.5476 1.6273 1.6677 1.7011 1.7934 2.0541 1.8986 1.9395 1.9599 1.9764 2.0213 2.1414  652 C. I. Nwoye Vol.8, No.8 3. BOUNDARY AND INITIAL CONDITIONS A rectangular shaped clay product of length 49mm, width 17mm, and breadth 9mm exposed to drying in the furnace while it was in wet condition was considered. Initially, atmospheric levels of oxygen are assumed. Atmospheric pressure was assumed to be acting on the clay samples during the drying process (since the furnace was not air-tight). The grain size of clay particles used was 425µm, weight of clay and binder (bentonite) used (for each rectangular product):100g and10g respectively: quantity of water used for mixing: 6% (of total weight): range of drying temperatures used: 80-1100C: area of evaporating surface: 833mm2 and drying time used: 90 mins. The boundary conditions were: atmospheric levels of oxygen at the top and bottom of the clay samples since they were dried under the atmospheric condition. No external force due to compression or tension was applied to the drying clays. The sides of the particles and the rectangular shaped clay products were taken to be symmetries. 4. MODEL VALIDATION The formulated model was validated by direct analysis and comparison of the model- predicted E values and those from the experiment for equality or near equality. Analysis and comparison between these E values revealed deviations of model-predicted E from those of the experimental values. This was believed to be due to the fact that the surface properties of the clay and the physiochemical interactions between the clay and binder, which were found to have played vital role during the evaporation process were not considered during the model formulation. This necessitated the introduction of correction factor, to bring the model-predicted E value to that of the corresponding experimental value. Deviation (Dv) (%) of model-predicted E values from the experimental E values is given by Dv = Pw – Ew x 100 (14) Ew Where Pw = Quantity of water evaporated as predicted by model (g) Ew = Quantity of water evaporated as obtained from experiment (g) [17] Correction factor (Cf) is the negative of the deviation i.e Cf = -Dv (15) Therefore Cf = -100 Pw – Ew (16) Ew Introduction of the value of Cf from equation (16) into the model gives exactly the corresponding experimental value of E [17].  Vol.8, No.8 Model for Predicting the Quantity of Water Evaporated 653 5. RESULTS AND DISCUSSION The derived model is equation (13). 5.1 Evaporation per Unit Rise in Drying Temperature Water evaporated per unit rise in temperature resulting from drying of the clay at a temperature range 80-1100C was determined following comparison of the evaporation per unit rise in temperature obtained by calculations involving experimental results, and model- predicted results obtained directly from the model. Evaporation per unit rise in the drying temperature, Ed (g /0C) was calculated from the equation; Ed = E/T (17) Therefore, a plot of mass of water evaporated E against drying temperature T, as in Fig. 1 using experimental results in Table 1, gives a slope, S at points (5.09, 85) and (5.48, 90) following their substitution into the mathematical expression; S = ΔE/ΔT (18) Eqn. (18) is detailed as S = E 2 - E 1 / T 2 - T 1 (19) Where ΔE = Change in the quantities of water evaporated E 2 , E 1 at two drying temperature values T 2 , T 1 . Considering the points (5.09, 85) and (5.48, 90) for (E 1 , T 1 ) and (E 2 , T 2 ) respectively, and substituting them into eqn. (19), gives the slope as 0.078g/ 0 C which is the quantity of water evaporated per unit rise in the drying temperature during the actual experimental drying process . Also similar plot (as in Fig. 2) using model-predicted results gives a slope. Considering points (4.9893, 85) and (5.2401, 90) for (E 1 , T 1 ) and (E 2 , T 2 ) respectively and substituting them into eqn. (19) gives the value of slope, S as 0.0502g/ 0 C. This is the model-predicted quantity of water evaporated per unit rise in the drying temperature during the drying of the clay. A comparison of these two quantities of water evaporated per unit rise in the drying temperature shows proximate agreement. This indicates a very high degree of validity for the model as a reliable tool for predicting the quantity of water evaporated as well as the evaporation per unit rise in the drying temperature during drying of Ukpor clay at a temperature range 80-110 0 C. An ideal comparison of the quantities of water evaporated per unit rise in the drying temperature as obtained from experiment and as predicted by the model for the purpose of testing the validity of the model is achieved by considering the R2 values. The values of the correlation coefficient, R calculated from the equation; R = √R2 (20) using the r-squared values (coefficient of determination) from Figs.1 and 2 show a better correlation (0.9999) with model-predicted quantity of water evaporated per unit rise in the drying temperature than that obtained from experiment (0.9888). This suggests that the  654 C. I. Nwoye Vol.8, No.8 model predicts more accurate, reliable and ideal quantity of evaporated water than the actual experiment despite its deviations from the experimental values. Fi g. 1- E ffect of dry ing temperature on the quantity of water ev aporated (as obtained from the experiment [17]) R 2 = 0.9888 4 5 6 7 8 9 758595105 115 T emperat ur e (de g . C) Q uan ti ty o f water evap orat ed ( g) Fi g. 2- E ffect of dry ing temperature on the quantity of water eva por ated (as pr ed ic ted by mode l ) R 2 = 0.9999 4 5 6 7 8 9 758595105 115 T emperature ( de g .C) Quanti ty of w ater evap or at ed ( g) Fig. 3 shows that values of E obtained from the experiment and those from the model are generally quite close hence depicting the reliability and validity of the model. However, Fig.3 shows that the quantities of water evaporated per unit rise in the drying temperature as obtained from the experiment [17], designated by the line ExD and as predicted by the model (line MoD) are in very good agreement within a drying temperature range 80-950C. This implies that the model is most accurate with respect to the experimental data within this temperature range. Fi g. 3- Comparison of the quantity of water eva por at ed as obtained from the experiment [17] an d as pred ic t ed by the mo de l 4 5 6 7 8 9 758595105 115 T emperature ( deg .C ) Q uan tity of water evap orated (g) Ex D MoD  Vol.8, No.8 Model for Predicting the Quantity of Water Evaporated 655 5.2 Effect of Drying Temperature on the Deviation (From Experimental Values) of Model- Predicted Quantity of Water Evaporated It was found that the validity of the model is rooted in the expression (lnE x Log β)N = Log T where both sides of the expression are correspondingly approximately equal to 2.Table 2 also agrees with equation (6) following the values of (lnE x Log β)N = Log T evaluated from Table 1 as a result of corresponding computational analysis. Fig. 4- Variation of dev iation (from experimental values) of mod el-p redi cted q u anti ty of water evapo rated with dryi ng temperat ure -25 -20 -15 -10 -5 0 5 758595105 115 Temperature (deg. C ) Deviatio n (% ) The respective deviation of the model-predicted quantity of evaporated water from the corresponding experimental value is less than 20% which is quite within the acceptable deviation range of experimental results, hence depicting the usefulness of the model. Figs. 3 and 4 show that above 950C, the deviation (from experimental values) of the model- predicted quantity of evaporated water increases with rise in the drying temperature. Fig.5-Variation of dev iation (from experimental v alues) of mo del-p redi cted qu anti ty of ev apo rated water wi th d r yi ng temperature -25 -20 -15 -10 -5 0 5 4 4.5 55.5 6 6.5 Q u anti ty of water evapo rated (g ) Deviatio n (% )  656 C. I. Nwoye Vol.8, No.8 The positive and negative deviations (of the model-predicted quantity of water evaporated) from actual experimental values show a direct relationship (as in Fig. 4) with the drying temperature. Fig. 4 indicates that the highest and least deviations are -19.64 and 0.84% respectively corresponds to the highest and lowest drying temperatures used (110 and 800C) respectively. Comparison of Figs. 2-4 shows that these percent deviations also correspond to the highest and lowest quantities of evaporated water (6.2684 and 4.7409g) respectively as predicted by the model. Fig.5 shows that the relationship between deviation (from experimental values) of model- predicted quantity of water evaporated and the quantity of water evaporated is also direct, indicating same orientation as in Fig.4. Comparison of Figs. 4 and 5 indicates that this relationship is due to the fact that the same values of the highest and lowest deviations, -19.64 and 0.84% associating the highest and lowest drying temperatures 110 and 800C in Fig. 4 also corresponds to the highest and lowest quantities of evaporated water 6.2684 and 4.7409g in Fig.5 respectively. 5.3 Effect of Drying Temperature on the Correction Factor to Model-Predicted Quantity of Water Evaporated Fig. 6 shows that correction factor to the model-predicted quantity of water evaporated has a direct relationship with the drying temperature. However, comparison of Figs.4-5 shows that the orientation of the curve of the correction factor against the drying temperature is opposite that of the deviation against drying temperature. This is attributed to the fact that correction factor is the negative of the deviation as shown in eqns. (15) and (16). It is believed that the correction factor takes care of the effects of the surface properties of the clay and the physiochemical interaction between the clay and the binder which (affected experimental results) were not considered during the model formulation. Fig . 6- Variatio n o f co rrectio n factor to th e mod el- predicted with dry ing temperature -5 0 5 10 15 20 25 758595105 115 Temperature (deg. C ) Correctio n facto r (%)  Vol.8, No.8 Model for Predicting the Quantity of Water Evaporated 657 6. CONCLUSION The model predicts the quantity of water evaporated during oven drying of Ukpor (Nigeria) clay at a temperature range 80-1100C. The validity of the model is rooted in the expression (lnE x Log β)N = Log T where both sides of the expression are correspondingly approximately equal to 2. The respective deviation of the model-predicted quantity of evaporated water from the corresponding experimental value is less than 20% which is quite within the acceptable deviation range of experimental results. Water evaporation per unit rise in the drying temperature evaluated from experimental and model-predicted results are 0.078 and 0.0502g/0C respectively, indicating proximate agreement. Further works should incorporate more process parameters into the model with the aim of reducing the deviations of the model-predicted E values from those of the experimental. ACKNOWLEDGEMENT The author thanks Dr. Ekeme Udoh, a modelling expert at Linkwell Modelling Centre Calabar for his technical inputs. The management of SynchroWell Nig. Ltd. Enugu is also appreciated for permitting and providing the experimental data used in this work. REFERENCES [1] Barsoum, M. (1997) Fundamentals of Ceramics. McGraw Hill Incorporated, Singapore p410 [2] Unal, A. (1986) Trans Institute of Metallurgy Section C. 95, p179. [3] Furnass, C.C. (1928) The Relationship Between Specific Voids and Size of Compression In System of Broken Solid of Mixed Size US Bureau Report Investigation Vol. 2894 p 321-340. [4] Singer, F., Singer, S.S. (1963) Industrial Ceramics, University Press Cambridge p44. [5] Nwoye, C. I. (2003) Investigating the Influence of Particle Size and Size Distribution on the Physical and Mechanical Properties of Ceramic Materials. A Project Report p5-8, 16-22. [6] Viewey, F., Larrly, P. (1978) Ceramic Processing Before Firing, John-Wiley and Sons, New York, p3-8. [7] Arisa, U. S. (1997) Effect of Initial Particle Size and Size Distribution on Physical and Mechanical Properties of Some Nigeria Clays Sintered at 12000C. A Thesis Report, p3,15-18 [8] Nwoye, C. I. (2009) Studies on Pore Deformation Mechanism in Particles J. Eng. Appl. Sc. (in press) [9] Nwoye, C. I. (2008) Effect of Porosity on the Shrinkage Behaviour of Ukpor and Nsu Clays. J. Eng. Appl. Sc., 3(1, 2): 27-30. [10] Reed, J. (1988) Principles of Ceramic Processing, Wiley Interscience Publication, Canada p470-478. [11] Keey, R.B., (1978) Introduction to Industrial Drying Operations, Pergamon Press, Elmsford,  658 C. I. Nwoye Vol.8, No.8 New York. p132-157. [12] Nwoye, C. I. (2008) Mathematical Model for Computational Analysis of Volume Shrinkage Resulting from Initial Air-Drying of Wet Clay Products. Int. Res. J. Eng. Sc. & Tech. 5(1): 82-85. [13] Nwoye, C. I., Iheanacho, I. O., Onyemaobi, O. O. (2008) Model for the Evaluation of Overall Volume Shrinkage in Molded Clay Products from Initial Air-Drying Stage to Completion of Firing. Int. J. Nat. Appl. Sc. 4(2): 234-238. [14] Nwoye, C. I. (2009) Model for Calculating the Quantity of Water Lost by Evaporation during Oven Drying of Clay. Researcher, 1(3): 8-13. [15] Nwoye, C. I., Okeke, K., Obi, M., Nwanyanwu, U., Ofoegbu, S. (2009) Model for Predictive Analysis of the Quantity of Water Evaporated during the Primary-Stage Processing of Bioceramic Material Sourced from Kaolin. J. Nat. Sc. 7(4): 79-84. [16] Nwoye, C. I., Nwakwuo, C. C., Obi, M. C., Obasi, G. C., Onyemaobi, O. O. (2009) Model for Quantifying the Extent and Magnitude of Water Evaporated during Time Dependent Drying of Clay. New York J. Sc. 2(3): 55-58. [17] Nwoye, C. I. (2007). SynchroWell Research Work Report, DFM Unit, No 20072002, p67-80. |