Paper Menu >>
Journal Menu >>
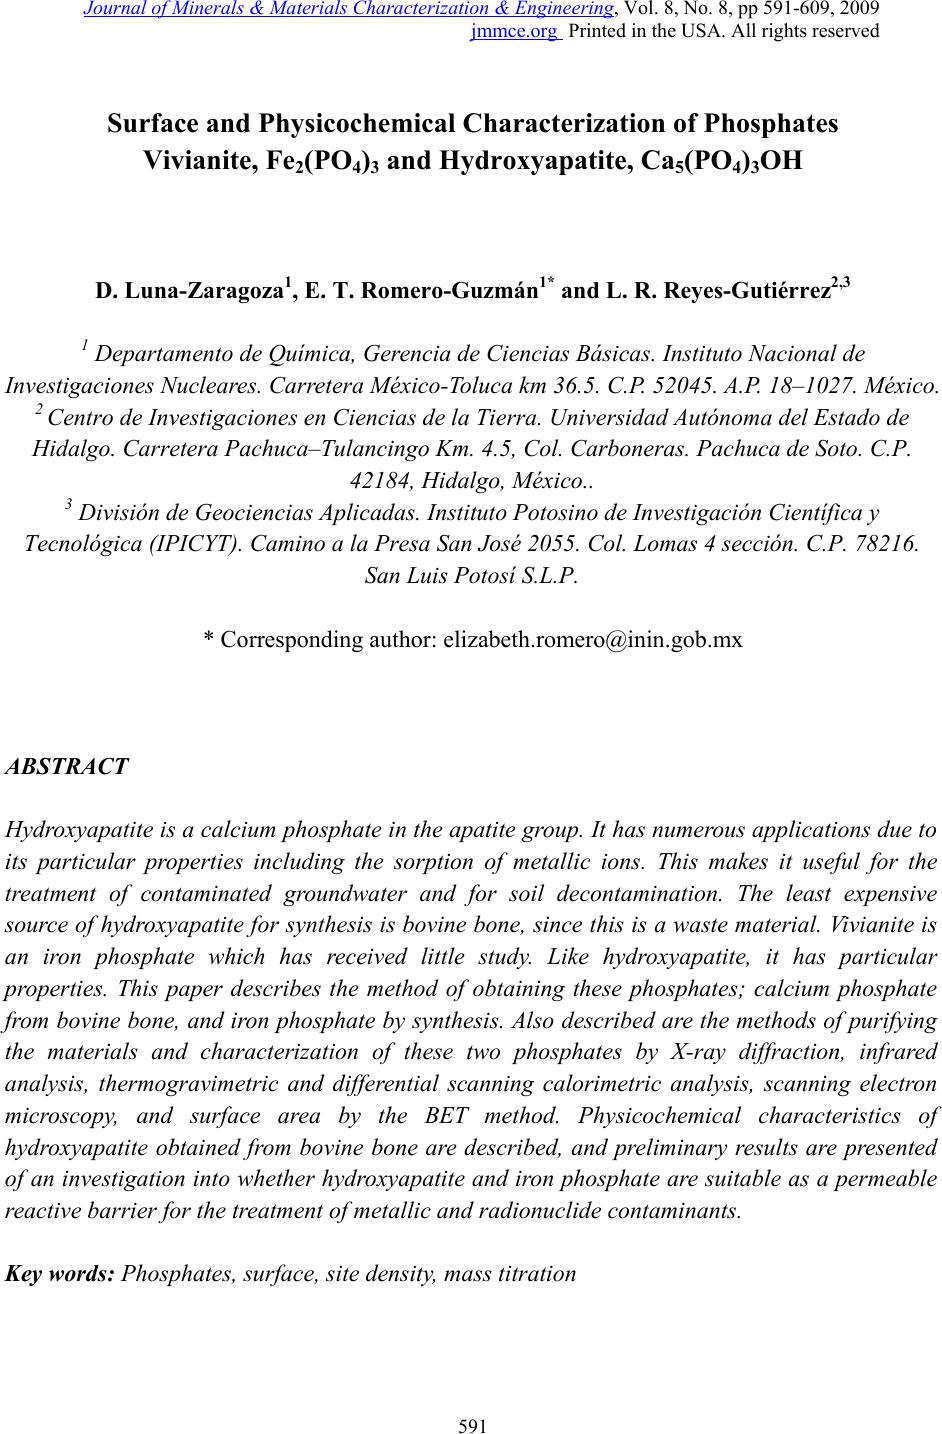 Journal of Minerals & Materials Characterization & Engineering, Vol. 8, No. 8, pp 591-609, 2009 jmmce.org Printed in the USA. All rights reserved 591 Surface and Physicochemical Characterization of Phosphates Vivianite, Fe2(PO4)3 and Hydroxyapatite, Ca5(PO4)3OH D. Luna-Zaragoza1, E. T. Romero-Guzmán1* and L. R. Reyes-Gutiérrez2,3 1 Departamento de Química, Gerencia de Ciencias Básicas. Instituto Nacional de Investigaciones Nucleares. Carretera México-Toluca km 36.5. C.P. 52045. A.P. 18–1027. México. 2 Centro de Investigaciones en Ciencias de la Tierra. Universidad Autónoma del Estado de Hidalgo. Carretera Pachuca–Tulancingo Km. 4.5, Col. Carboneras. Pachuca de Soto. C.P. 42184, Hidalgo, México.. 3 División de Geociencias Aplicadas. Instituto Potosino de Investigación Científica y Tecnológica (IPICYT). Camino a la Presa San José 2055. Col. Lomas 4 sección. C.P. 78216. San Luis Potosí S.L.P. * Corresponding author: elizabeth.romero@inin.gob.mx ABSTRACT Hydroxyapatite is a calcium phosphate in the apatite group. It has numerous applications due to its particular properties including the sorption of metallic ions. This makes it useful for the treatment of contaminated groundwater and for soil decontamination. The least expensive source of hydroxyapatite for synthesis is bovine bone, since this is a waste material. Vivianite is an iron phosphate which has received little study. Like hydroxyapatite, it has particular properties. This paper describes the method of obtaining these phosphates; calcium phosphate from bovine bone, and iron phosphate by synthesis. Also described are the methods of purifying the materials and characterization of these two phosphates by X-ray diffraction, infrared analysis, thermogravimetric and differential scanning calorimetric analysis, scanning electron microscopy, and surface area by the BET method. Physicochemical characteristics of hydroxyapatite obtained from bovine bone are described, and preliminary results are presented of an investigation into whether hydroxyapatite and iron phosphate are suitable as a permeable reactive barrier for the treatment of metallic and radionuclide contaminants. Key words: Phosphates, surface, site density, mass titration 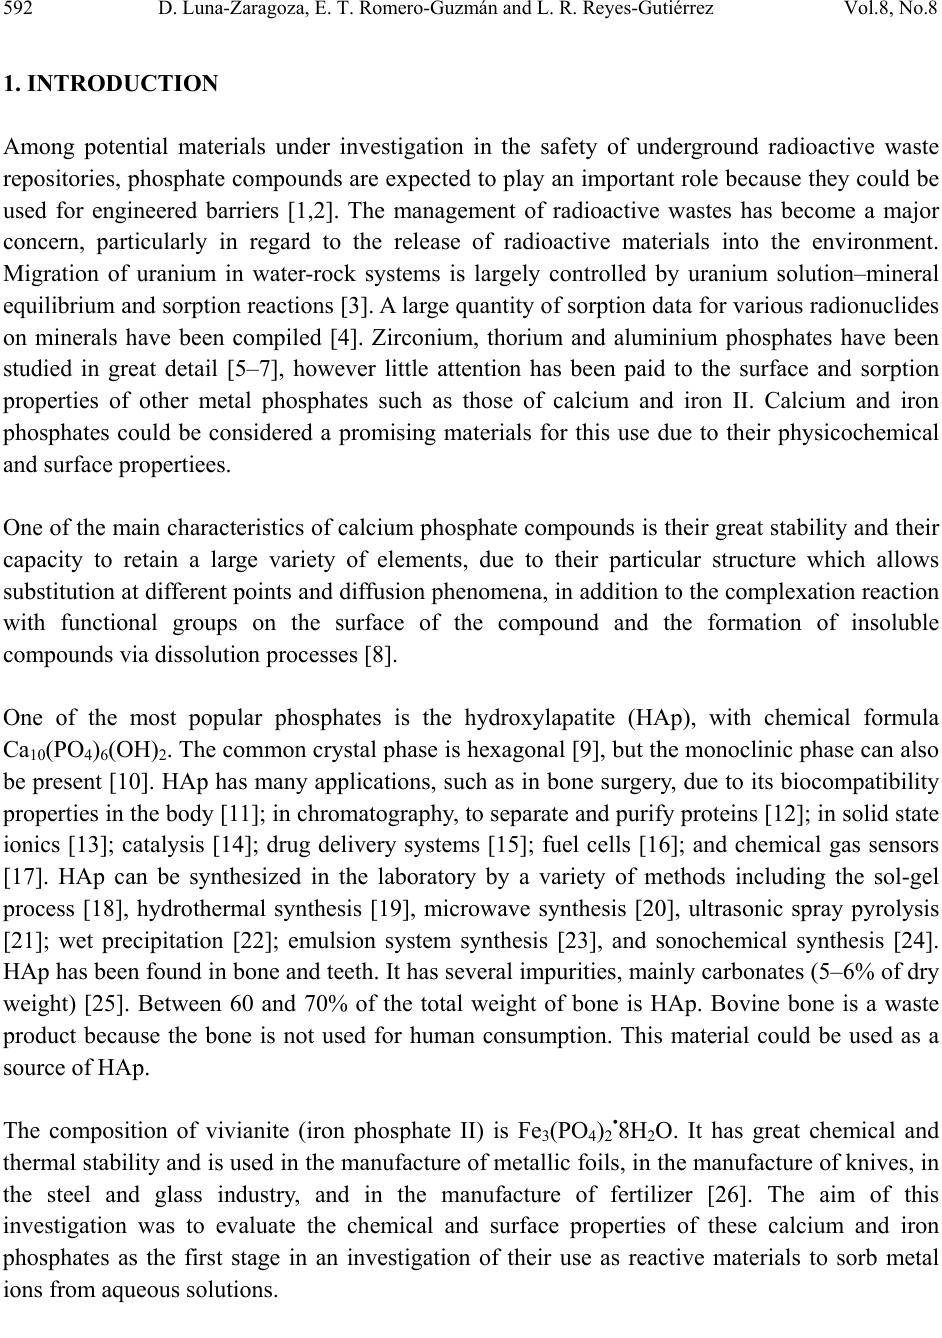 592 D. Luna-Zaragoza, E. T. Romero-Guzmán and L. R. Reyes-Gutiérrez Vol.8, No.8 1. INTRODUCTION Among potential materials under investigation in the safety of underground radioactive waste repositories, phosphate compounds are expected to play an important role because they could be used for engineered barriers [1,2]. The management of radioactive wastes has become a major concern, particularly in regard to the release of radioactive materials into the environment. Migration of uranium in water-rock systems is largely controlled by uranium solution–mineral equilibrium and sorption reactions [3]. A large quantity of sorption data for various radionuclides on minerals have been compiled [4]. Zirconium, thorium and aluminium phosphates have been studied in great detail [5–7], however little attention has been paid to the surface and sorption properties of other metal phosphates such as those of calcium and iron II. Calcium and iron phosphates could be considered a promising materials for this use due to their physicochemical and surface propertiees. One of the main characteristics of calcium phosphate compounds is their great stability and their capacity to retain a large variety of elements, due to their particular structure which allows substitution at different points and diffusion phenomena, in addition to the complexation reaction with functional groups on the surface of the compound and the formation of insoluble compounds via dissolution processes [8]. One of the most popular phosphates is the hydroxylapatite (HAp), with chemical formula Ca10(PO4)6(OH)2. The common crystal phase is hexagonal [9], but the monoclinic phase can also be present [10]. HAp has many applications, such as in bone surgery, due to its biocompatibility properties in the body [11]; in chromatography, to separate and purify proteins [12]; in solid state ionics [13]; catalysis [14]; drug delivery systems [15]; fuel cells [16]; and chemical gas sensors [17]. HAp can be synthesized in the laboratory by a variety of methods including the sol-gel process [18], hydrothermal synthesis [19], microwave synthesis [20], ultrasonic spray pyrolysis [21]; wet precipitation [22]; emulsion system synthesis [23], and sonochemical synthesis [24]. HAp has been found in bone and teeth. It has several impurities, mainly carbonates (5–6% of dry weight) [25]. Between 60 and 70% of the total weight of bone is HAp. Bovine bone is a waste product because the bone is not used for human consumption. This material could be used as a source of HAp. The composition of vivianite (iron phosphate II) is Fe3(PO4)2•8H2O. It has great chemical and thermal stability and is used in the manufacture of metallic foils, in the manufacture of knives, in the steel and glass industry, and in the manufacture of fertilizer [26]. The aim of this investigation was to evaluate the chemical and surface properties of these calcium and iron phosphates as the first stage in an investigation of their use as reactive materials to sorb metal ions from aqueous solutions. 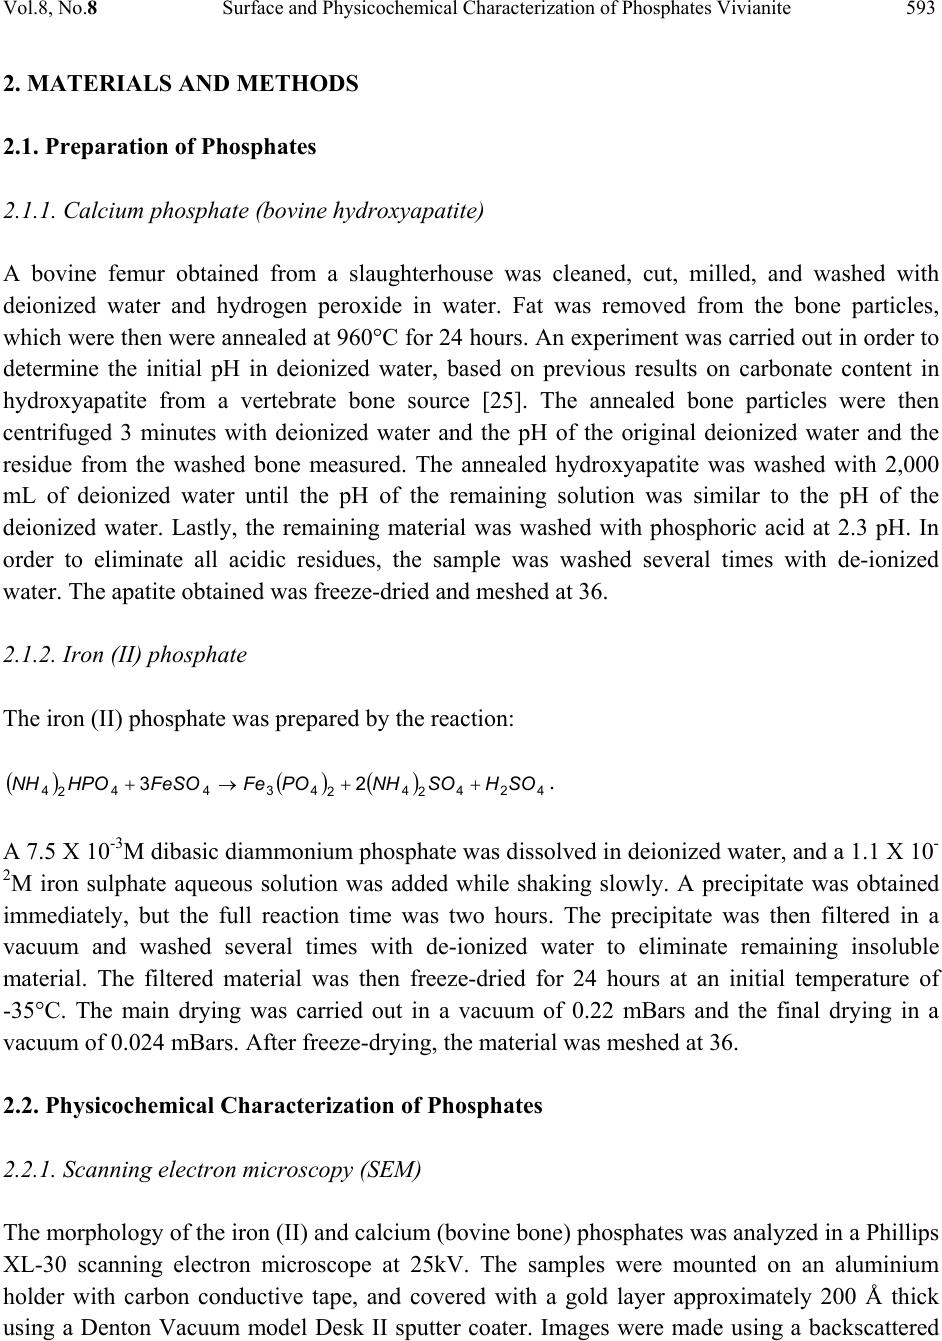 Vol.8, No.8 Surface and Physicochemical Characterization of Phosphates Vivianite 593 2. MATERIALS AND METHODS 2.1. Preparation of Phosphates 2.1.1. Calcium phosphate (bovine hydroxyapatite) A bovine femur obtained from a slaughterhouse was cleaned, cut, milled, and washed with deionized water and hydrogen peroxide in water. Fat was removed from the bone particles, which were then were annealed at 960°C for 24 hours. An experiment was carried out in order to determine the initial pH in deionized water, based on previous results on carbonate content in hydroxyapatite from a vertebrate bone source [25]. The annealed bone particles were then centrifuged 3 minutes with deionized water and the pH of the original deionized water and the residue from the washed bone measured. The annealed hydroxyapatite was washed with 2,000 mL of deionized water until the pH of the remaining solution was similar to the pH of the deionized water. Lastly, the remaining material was washed with phosphoric acid at 2.3 pH. In order to eliminate all acidic residues, the sample was washed several times with de-ionized water. The apatite obtained was freeze-dried and meshed at 36. 2.1.2. Iron (II) phosphate The iron (II) phosphate was prepared by the reaction: () () ( ) 424 2 4 2 4344 2 423 SOHSONHPOFeFeSOHPONH ++→+ . A 7.5 X 10⁻³M dibasic diammonium phosphate was dissolved in deionized water, and a 1.1 X 10- 2M iron sulphate aqueous solution was added while shaking slowly. A precipitate was obtained immediately, but the full reaction time was two hours. The precipitate was then filtered in a vacuum and washed several times with de-ionized water to eliminate remaining insoluble material. The filtered material was then freeze-dried for 24 hours at an initial temperature of -35°C. The main drying was carried out in a vacuum of 0.22 mBars and the final drying in a vacuum of 0.024 mBars. After freeze-drying, the material was meshed at 36. 2.2. Physicochemical Characterization of Phosphates 2.2.1. Scanning electron microscopy (SEM) The morphology of the iron (II) and calcium (bovine bone) phosphates was analyzed in a Phillips XL-30 scanning electron microscope at 25kV. The samples were mounted on an aluminium holder with carbon conductive tape, and covered with a gold layer approximately 200 Å thick using a Denton Vacuum model Desk II sputter coater. Images were made using a backscattered 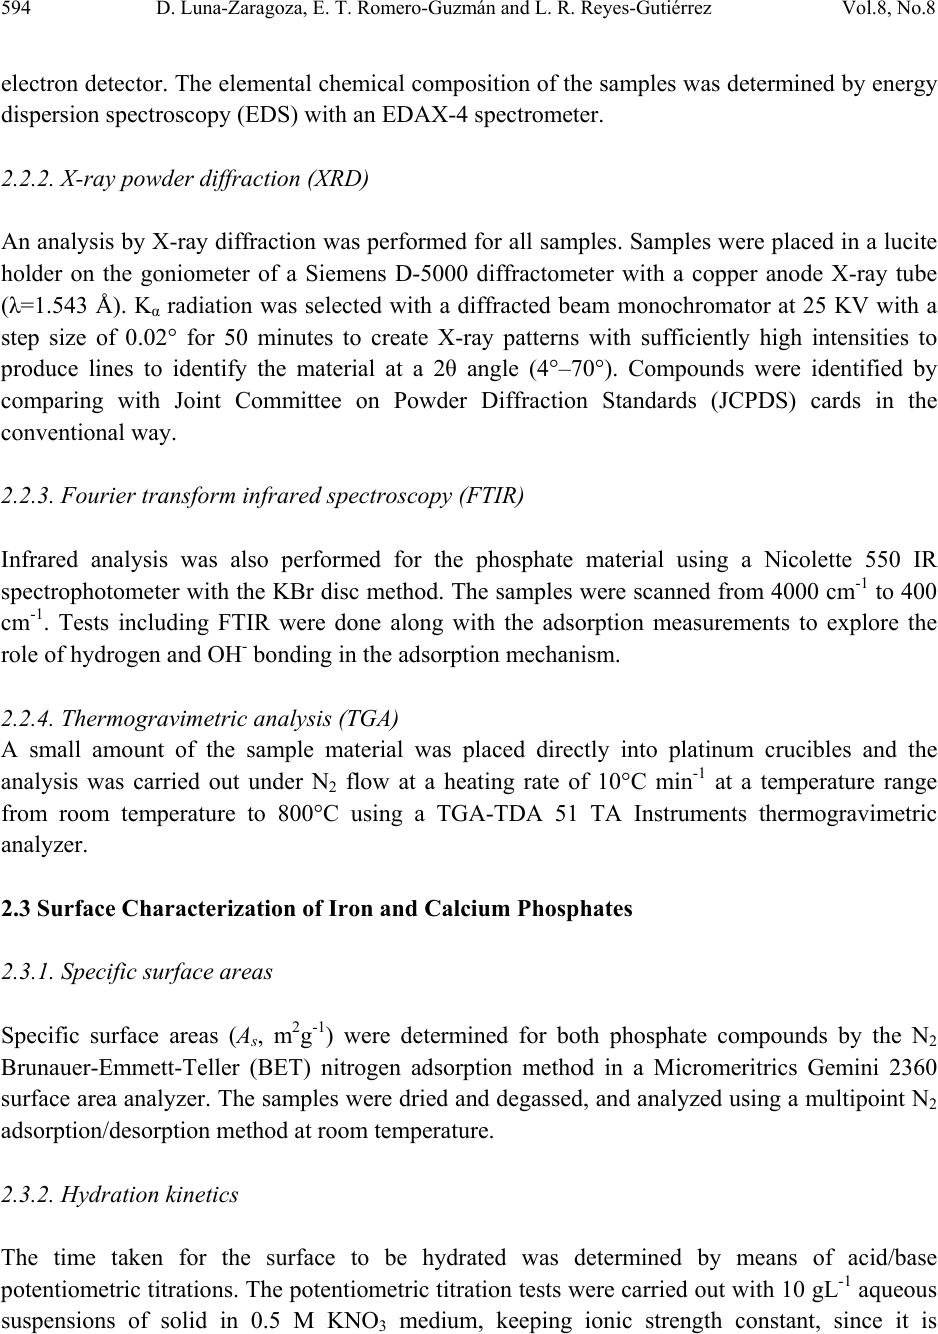 594 D. Luna-Zaragoza, E. T. Romero-Guzmán and L. R. Reyes-Gutiérrez Vol.8, No.8 electron detector. The elemental chemical composition of the samples was determined by energy dispersion spectroscopy (EDS) with an EDAX-4 spectrometer. 2.2.2. X-ray powder diffraction (XRD) An analysis by X-ray diffraction was performed for all samples. Samples were placed in a lucite holder on the goniometer of a Siemens D-5000 diffractometer with a copper anode X-ray tube (λ=1.543 Å). Kα radiation was selected with a diffracted beam monochromator at 25 KV with a step size of 0.02° for 50 minutes to create X-ray patterns with sufficiently high intensities to produce lines to identify the material at a 2θ angle (4°–70°). Compounds were identified by comparing with Joint Committee on Powder Diffraction Standards (JCPDS) cards in the conventional way. 2.2.3. Fourier transform infrared spectroscopy (FTIR) Infrared analysis was also performed for the phosphate material using a Nicolette 550 IR spectrophotometer with the KBr disc method. The samples were scanned from 4000 cm-1 to 400 cm-1. Tests including FTIR were done along with the adsorption measurements to explore the role of hydrogen and OH- bonding in the adsorption mechanism. 2.2.4. Thermogravimetric analysis (TGA) A small amount of the sample material was placed directly into platinum crucibles and the analysis was carried out under N2 flow at a heating rate of 10°C min-1 at a temperature range from room temperature to 800°C using a TGA-TDA 51 TA Instruments thermogravimetric analyzer. 2.3 Surface Characterizat i o n of Iron and Calcium Phosphates 2.3.1. Specific surface areas Specific surface areas (As, m2g-1) were determined for both phosphate compounds by the N2 Brunauer-Emmett-Teller (BET) nitrogen adsorption method in a Micromeritrics Gemini 2360 surface area analyzer. The samples were dried and degassed, and analyzed using a multipoint N2 adsorption/desorption method at room temperature. 2.3.2. Hydration kinetics The time taken for the surface to be hydrated was determined by means of acid/base potentiometric titrations. The potentiometric titration tests were carried out with 10 gL-1 aqueous suspensions of solid in 0.5 M KNO3 medium, keeping ionic strength constant, since it is  Vol.8, No.8 Surface and Physicochemical Characterization of Phosphates Vivianite 595 recognized that K+ and NO3- ions do not usually sorb specifically [27]. Distilled water and nitrogen-controlled atmosphere were used in order to avoid the presence of carbonates. In situ pH values were measured with a combined ORION® glass electrode. The precision of the measured pH values was estimated to be ± 0.2 units. The sample was shaken continuously to prevent settling. For the hydration step, the suspensions were shaken for 0, 1, 2, 3, 4, 5, 6, 7, 24, 48 and 72 hour contact times at room temperature. A kinetic study showed that 24 hours is sufficient to reach hydration equilibrium. After hydration, the pH of the initial suspension was adjusted to a value lower than the pHpzc (pH close to 2) using a 0.5 M HNO3 solution. The solution was shaken for 5 min. until pH value was constant. The solid was titrated by adding incremental volumes of a 0.1 M KOH solution. 2.3.3. Point of zero charge (PZC) determination by mass titration Mass titration experiments were performed with 0.01, 0.05, 0.10, 0.2, 0.5, 1.0, 1.5 and 2 g of calcium and iron (II) phosphates in polypropylene tubes with 10 mL of 0.5 M KNO3 (Fermont™) solution. In these solutions, the solid in suspension acts a pH buffer [28]. The resulting suspensions were shaken for 24 hours to allow complete hydration of the solid surface before being centrifuged at 3500 rpm for 15 minutes. The pH values of the supernatant were then measured untill they reached a constant value (pHpzc). The pH at which the solid surface attains a zero net charge is known as the point of zero charge or pHpzc. 2.3.4. Active site density Surface site density (Ns) can be determined directly from the potentiometric titration curve of the suspension (20 gL-1) [5]. This was adjusted to an initial pH value close to 2 using a 0.5 M HNO3 solution. The solution was shaken for 5 minutes until the pH value was constant and then titrated by adding incremental volumes of a 0.1 M KOH solution. If we plot the mole number of OH- ions added to the suspension versus the mole number of these aqueous ions, it can be related to the pH measurement. The final part of the resulting curve is linear. In this range, the reaction no longer occurs and the total quantity of hydroxide ions introduced is entirely in solution. The solid surface has reacted completely and the amphoteric sites are no longer protonated. The titration curve obtained for the background salt alone (without phosphates) shows a linear part as well. After extrapolation of this linear part to a zero OH- concentration for both suspensions and background salt, we can determine OH- uptake by the solid phase by subtracting these two values. Thus knowing the specific surface area and the quantity of powdered solid in the suspension, we can calculate surface site density using the formula () 2 9 21 10 2 TSs A SVCA N nn N ⎟ ⎠ ⎞ ⎜ ⎝ ⎛− =  596 D. Luna-Zaragoza, E. T. Romero-Guzmán and L. R. Reyes-Gutiérrez Vol.8, No.8 where n1 and n2 are the number of moles of OH consumed by the solid, NA is the Avogrado Number, As is the specific area, Cs is the solid concentration and VT corresponds to the total volume of titration solution. 3. RESULTS AND DISCUSSION 3.1. Physicochemical Characterization 3.1.1. Scanning electron microscopy The morphology and the chemical composition of the calcium phosphate annealed at 960°C were determined by means of SEM, considering the physical characteristics of particles in the materials. The treatment at high temperature produces changes in the surface of particles in the bone. These materials consist of agglomerates of rigid crystal. In addition, a significant increase in the number of pores is observed. This is to be expected, since once the bone is annealed, this material is between 30 and 40% organic matter, which is transformed into gases (mainly CO2) and obviously where before there was organic matter, now there are holes as can be seen in Figure 1. These pores seem to be connected by solid walls to form separated continuous networks with a surface texture varying from rough to smooth. Some particles show pores between particles (200X). Similar results were reported by Mostafa, 2005 [29]. When approaching 4000X (Figure 1b), the surfaces of the bone that are not seen to be porous at low amplification show smaller pores, although these particles do not show agglomerates. The common chemical elements of the calcium phosphate (phosphorus, calcium and oxygen) can also be observed by EDS. Iron (II) phosphate shows crystals with radial growth and crystalline aggregates. The size of the crystals varies from 5 to 10 µm. The EDS chemical analysis showed that the main elements of the sample were P, O and Fe, Figure 2. 3.1.2. X-ray diffracti on Identification of the mineralogical components of the annealed bone was carried out by X-ray diffraction. The main mineral found in the sample is hydroxyapatite, Ca3(PO4)5OH (JCPDS card 9-0432), according to the Joint Committee on Powder Diffraction Standard (JCPDS) [30], Figure 3. Each JCPDS card has the crystallographic information of the chemical composition and a table of interplanar distances of 2θ angles against intensity. The bovine samples annealed at 960°C show highly crystalline structure and all the interplanar distances reported for this mineral, which agrees with the hexagonal structure of the reference data. The diffractograms of the annealed sample indicate that there were no changes in crystallinity, nor in the structural of calcium phosphate, which indicates that the compound is still calcium phosphate. X-ray  Vol.8, No.8 Surface and Physicochemical Characterization of Phosphates Vivianite 597 diffraction analysis was carried out on the iron (II) phosphate. The diffraction standard of vivianite was found. The diffractogram showed that the material is also highly crystalline, consistent with JCPDS card 30-622 [30], Figure 3. Figure 1. Scanning Electron Microscope (SEM) micrograph of HAp at 1000X, 4000X and 20,000X, and the respective Energy Dispersion Spectroscopy (EDS) spectrum showing a high abundance of the principal components of calcium phosphate.  598 D. Luna-Zaragoza, E. T. Romero-Guzmán and L. R. Reyes-Gutiérrez Vol.8, No.8 Figure 2. Scanning Electron Microscope (SEM) micrograph of iron (II) phosphate at 1000X and 2500X, and the respective Energy Dispersion Spectroscopy (EDS) spectrum showing a high abundance of the principal components of iron (II) phosphate. 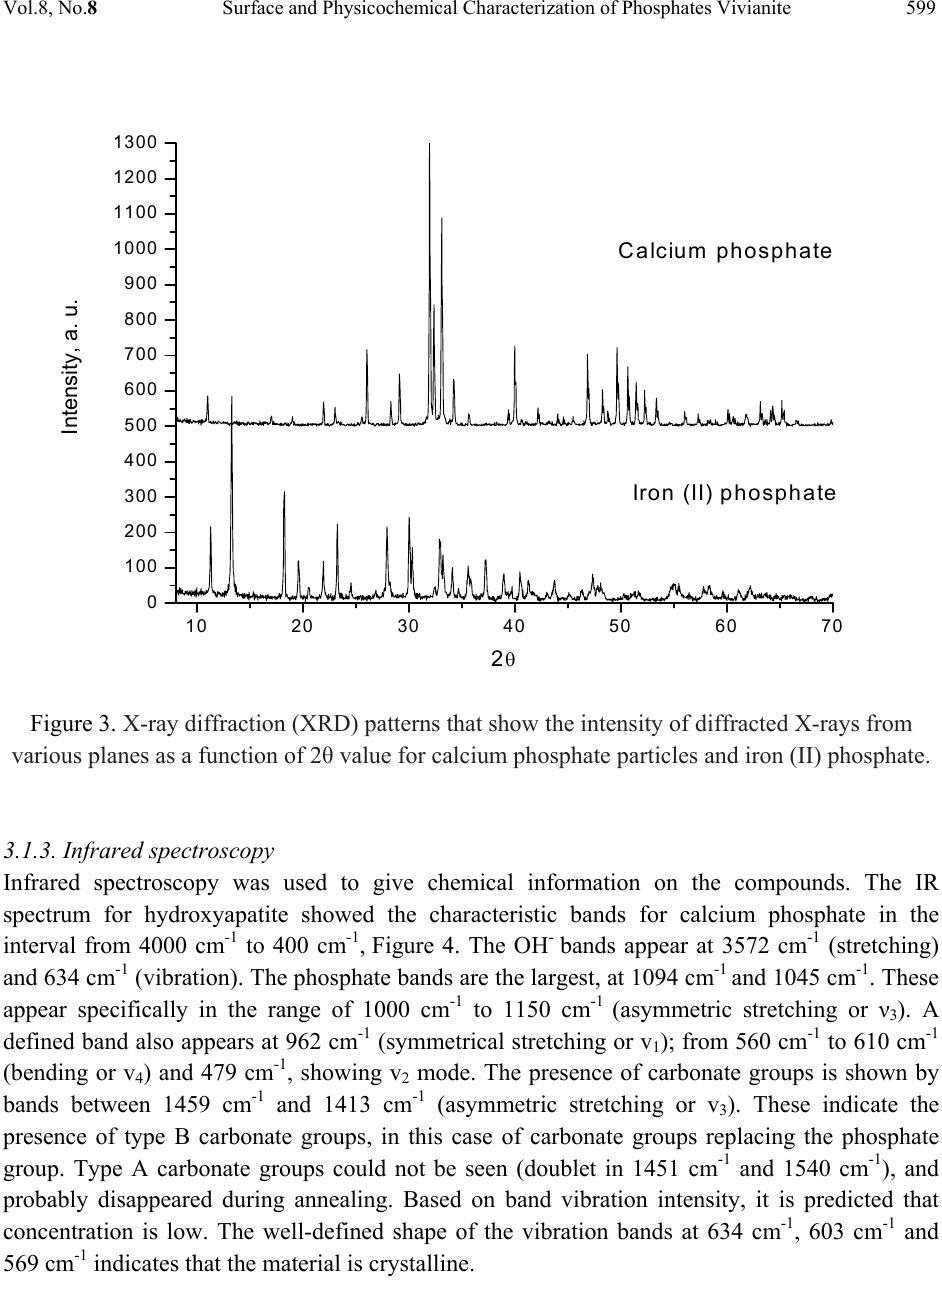 Vol.8, No.8 Surface and Physicochemical Characterization of Phosphates Vivianite 599 10 20 30 40 50 60 70 0 100 200 300 400 500 600 700 800 900 1000 1100 1200 1300 Intensity, a. u. 2θ C alcium phosphate Iron (I I) p h os p ha te Figure 3. X-ray diffraction (XRD) patterns that show the intensity of diffracted X-rays from various planes as a function of 2θ value for calcium phosphate particles and iron (II) phosphate. 3.1.3. Infrared spectroscopy Infrared spectroscopy was used to give chemical information on the compounds. The IR spectrum for hydroxyapatite showed the characteristic bands for calcium phosphate in the interval from 4000 cm-1 to 400 cm-1, Figure 4. The OH- bands appear at 3572 cm-1 (stretching) and 634 cm-1 (vibration). The phosphate bands are the largest, at 1094 cm-1 and 1045 cm-1. These appear specifically in the range of 1000 cm-1 to 1150 cm-1 (asymmetric stretching or ν3). A defined band also appears at 962 cm-1 (symmetrical stretching or v1); from 560 cm-1 to 610 cm-1 (bending or v4) and 479 cm-1, showing v2 mode. The presence of carbonate groups is shown by bands between 1459 cm-1 and 1413 cm-1 (asymmetric stretching or v3). These indicate the presence of type B carbonate groups, in this case of carbonate groups replacing the phosphate group. Type A carbonate groups could not be seen (doublet in 1451 cm-1 and 1540 cm-1), and probably disappeared during annealing. Based on band vibration intensity, it is predicted that concentration is low. The well-defined shape of the vibration bands at 634 cm-1, 603 cm-1 and 569 cm-1 indicates that the material is crystalline. 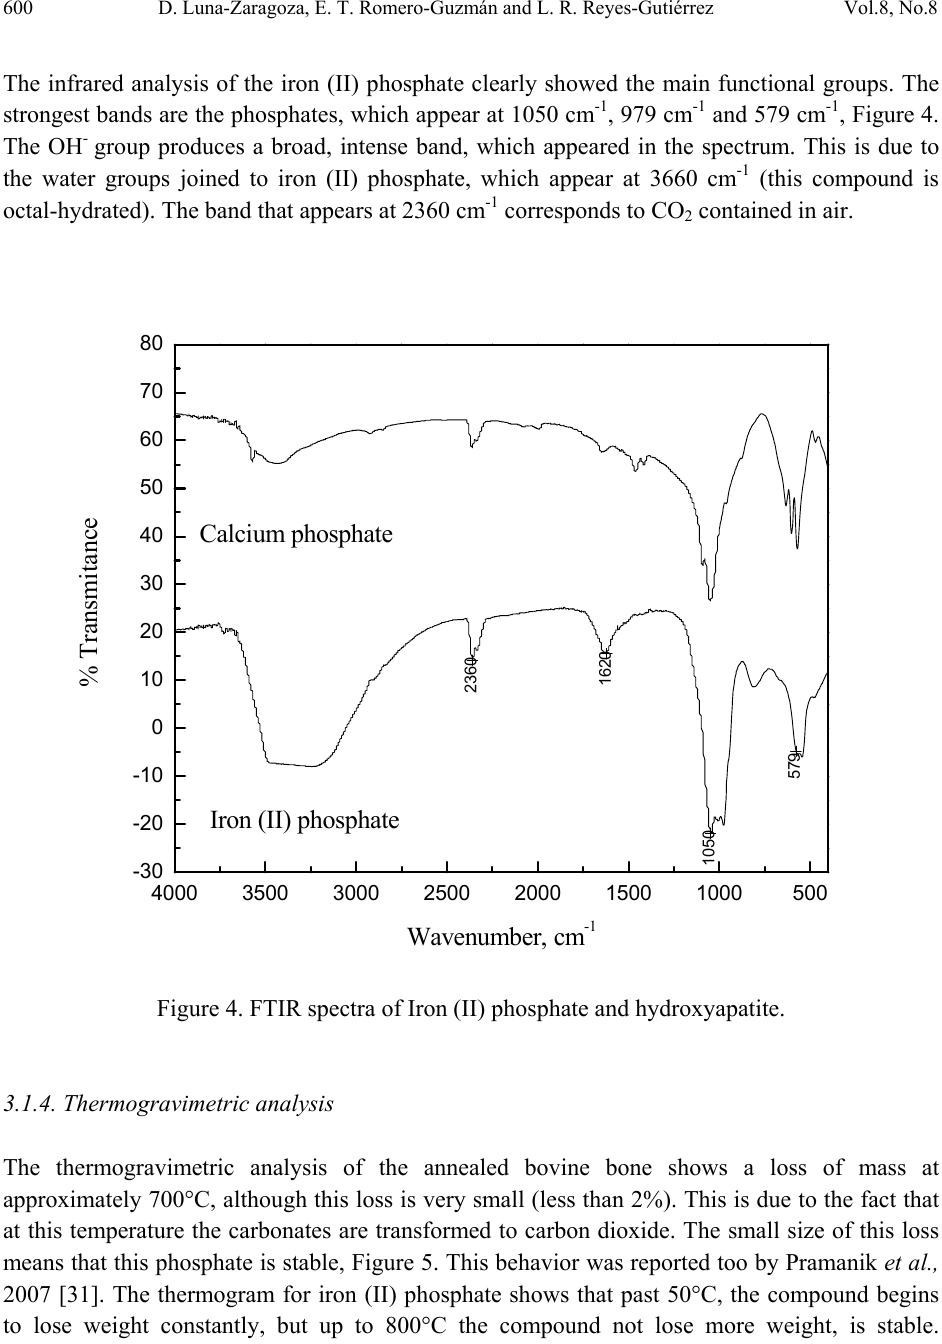 600 D. Luna-Zaragoza, E. T. Romero-Guzmán and L. R. Reyes-Gutiérrez Vol.8, No.8 The infrared analysis of the iron (II) phosphate clearly showed the main functional groups. The strongest bands are the phosphates, which appear at 1050 cm-1, 979 cm-1 and 579 cm-1, Figure 4. The OH- group produces a broad, intense band, which appeared in the spectrum. This is due to the water groups joined to iron (II) phosphate, which appear at 3660 cm-1 (this compound is octal-hydrated). The band that appears at 2360 cm-1 corresponds to CO2 contained in air. 4000 3500 3000 2500 2000 1500 1000500 -30 -20 -10 0 10 20 30 40 50 60 70 80 579 1050 1620 2360 % Transmitance Wavenumber, cm-1 Calcium phosphate Iron (II) phosphate Figure 4. FTIR spectra of Iron (II) phosphate and hydroxyapatite. 3.1.4. Thermogravimetric analysis The thermogravimetric analysis of the annealed bovine bone shows a loss of mass at approximately 700°C, although this loss is very small (less than 2%). This is due to the fact that at this temperature the carbonates are transformed to carbon dioxide. The small size of this loss means that this phosphate is stable, Figure 5. This behavior was reported too by Pramanik et al., 2007 [31]. The thermogram for iron (II) phosphate shows that past 50°C, the compound begins to lose weight constantly, but up to 800°C the compound not lose more weight, is stable. 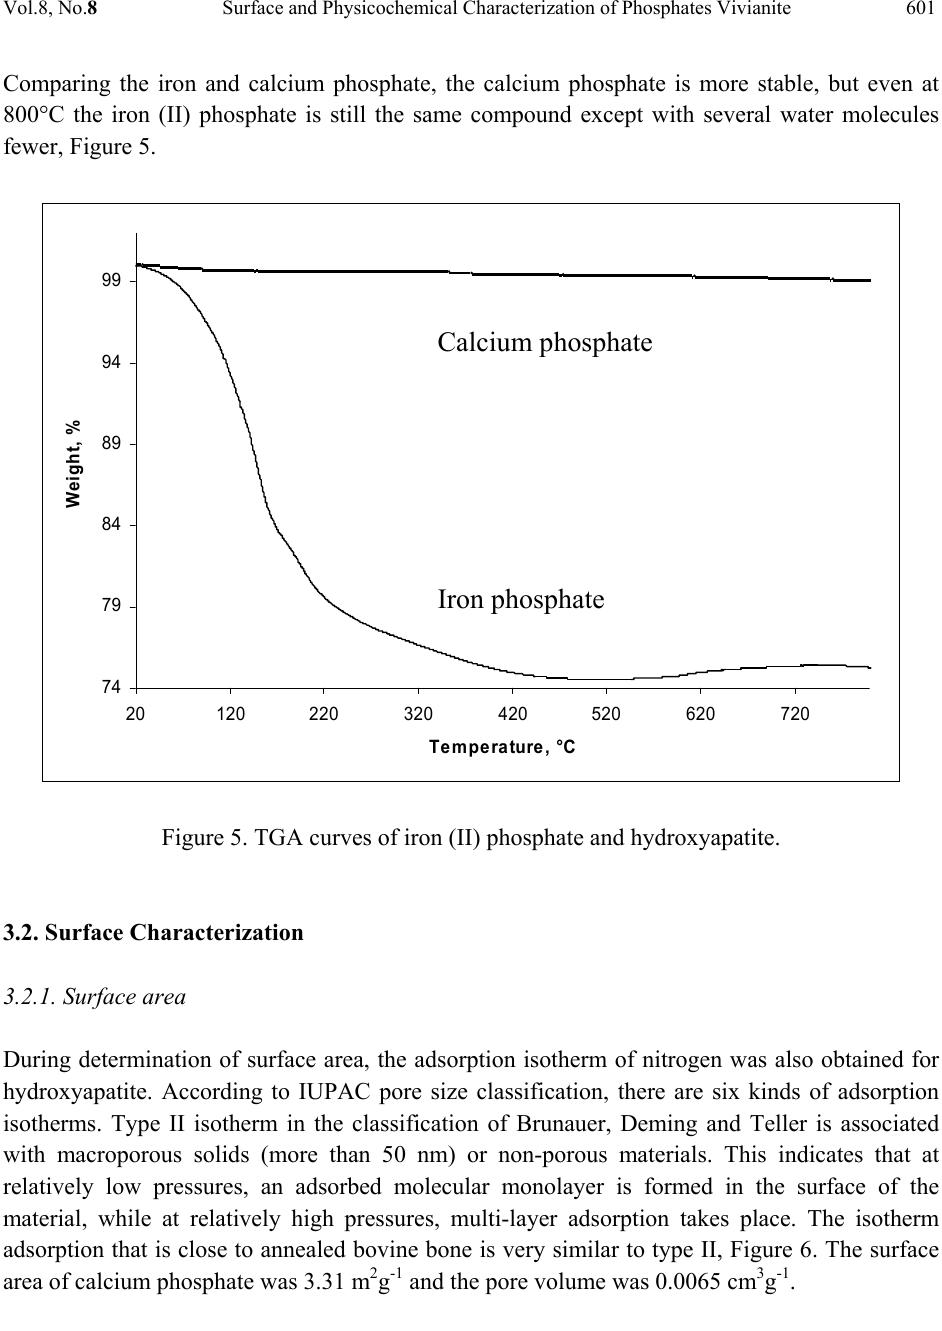 Vol.8, No.8 Surface and Physicochemical Characterization of Phosphates Vivianite 601 Comparing the iron and calcium phosphate, the calcium phosphate is more stable, but even at 800°C the iron (II) phosphate is still the same compound except with several water molecules fewer, Figure 5. Figure 5. TGA curves of iron (II) phosphate and hydroxyapatite. 3.2. Surface Characterization 3.2.1. Surface area During determination of surface area, the adsorption isotherm of nitrogen was also obtained for hydroxyapatite. According to IUPAC pore size classification, there are six kinds of adsorption isotherms. Type II isotherm in the classification of Brunauer, Deming and Teller is associated with macroporous solids (more than 50 nm) or non-porous materials. This indicates that at relatively low pressures, an adsorbed molecular monolayer is formed in the surface of the material, while at relatively high pressures, multi-layer adsorption takes place. The isotherm adsorption that is close to annealed bovine bone is very similar to type II, Figure 6. The surface area of calcium phosphate was 3.31 m2g-1 and the pore volume was 0.0065 cm3g-1. 74 79 84 89 94 99 20120220 320 420520 620 720 Temperature, °C Weight, % Calcium phosphate Iron phosphate  602 D. Luna-Zaragoza, E. T. Romero-Guzmán and L. R. Reyes-Gutiérrez Vol.8, No.8 The specific area for the iron (II) phosphate by the BET method was 10.5 m2g-1. As can be seen in the Figure 6, the two compounds presents a very similar behaviour but the iron (II) phosphate sorbs more rapidly than the calcium phosphate. This is consistent with the surface area of both compounds to sorb chemical species in solution, both are IUPAC type II. Figure 6. Sorption isotherm of hydroxyapatite and iron (II) phosphate. 3.2.2. Hydration kinetics The time required for the hydroxyapatite from bovine bone to reach equilibrium in solution was determined. Several titrations were carried out at different times. Equilibrium is reached once the curve at time t is the same for several curves, giving the final value for time. The results obtained from the hydratation kinetics for calcium phosphate was shown in Figure 7. 0 2 4 6 8 10 12 00.2 0.4 0.6 0.81 Adsorbed volume, cm3/g STP Relative pressure, P/Po Iron (II) phosphate Calcium phosphate 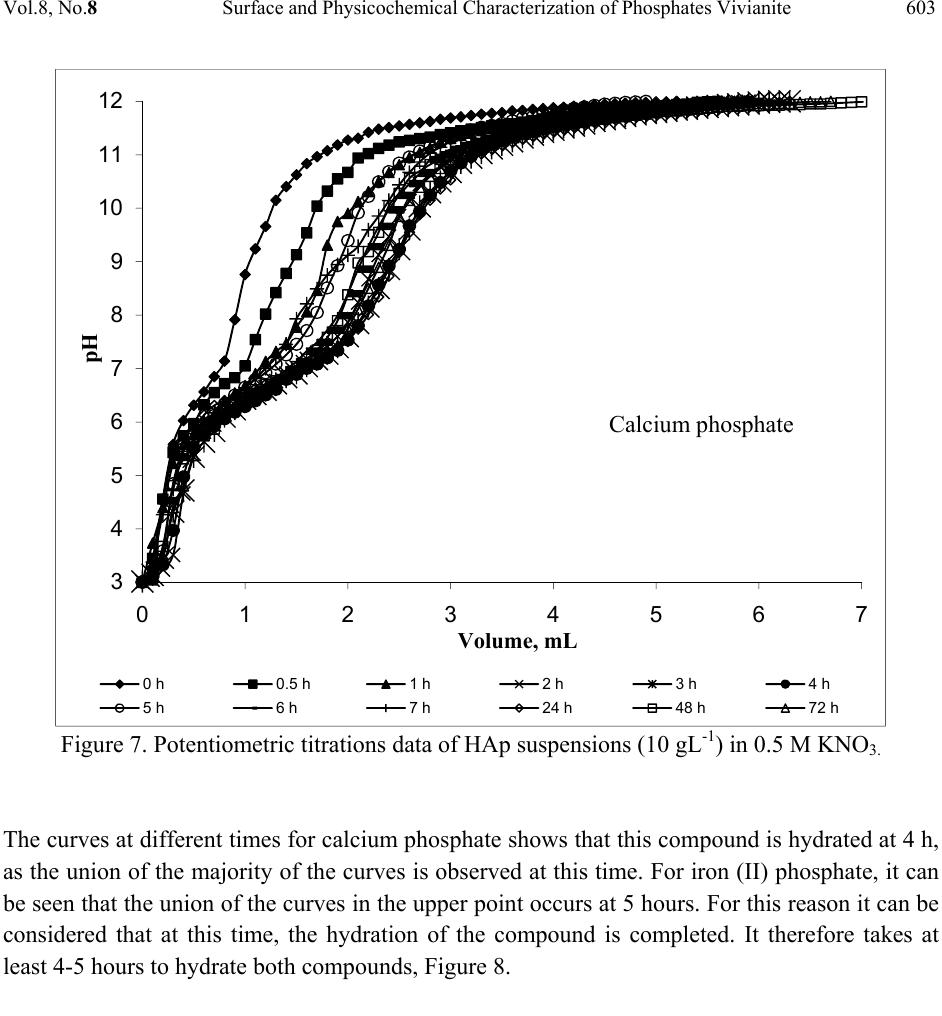 Vol.8, No.8 Surface and Physicochemical Characterization of Phosphates Vivianite 603 Figure 7. Potentiometric titrations data of HAp suspensions (10 gL-1) in 0.5 M KNO3. The curves at different times for calcium phosphate shows that this compound is hydrated at 4 h, as the union of the majority of the curves is observed at this time. For iron (II) phosphate, it can be seen that the union of the curves in the upper point occurs at 5 hours. For this reason it can be considered that at this time, the hydration of the compound is completed. It therefore takes at least 4-5 hours to hydrate both compounds, Figure 8. 3 4 5 6 7 8 9 10 11 12 01234567 pH Volume, mL 0 h0.5 h1 h2 h3 h4 h 5 h6 h7 h24 h48 h72 h Calcium phosphate  604 D. Luna-Zaragoza, E. T. Romero-Guzmán and L. R. Reyes-Gutiérrez Vol.8, No.8 Figure 8. Potentiometric titrations data of iron (II) phosphate suspensions (10 gL-1) in 0.5 M KNO3. 3.2.3. Point of zero charge The point of zero charge (PZC) was determined in order to find the pH at which the solution has been prepared to removed the heavy metal waste. The PZC for the calcium phosphate was 10.9 pH, as seen in Figure 9. In contrast, the PZC for iron (II) phosphate, at 3.3 pH, was acidic. 1 2 3 4 5 6 7 8 9 10 11 12 01234567891011121314 pH Volume, mL 0h 1h 2h 3h 4h 5h 6h 24h 48h 72h Iron (II) phosphate  Vol.8, No.8 Surface and Physicochemical Characterization of Phosphates Vivianite 605 Figure 9. Mass titration data of iron (II) phosphate and hydroxyapatite. 3.2.4. Surface sites In order to find the surface sites of calcium phosphate, 0.5 M KNO3 was used. The results of active surface sites were determined for the equation 29 2 )10(][ ) 2 ( )( VcA N nOH sitesnmd s A s= −. The number of OH- left by the material (nOH-) is the difference between the values of the ordinates at origin, and this was equal to 0.00125 sitesnm-2. The surface area (SA) of calcium phosphate is 3.31 m2g-1. The concentration (c) of calcium phosphate in solution was 16.67 gL-1, with a surface area of 3.31 m2g-1, nOH- are 4.5 sites nm-2 for the calcium phosphate surface, Figure 10. 0 2 4 6 8 10 12 012345 pH We ight, g Calcium Iron (II)  606 D. Luna-Zaragoza, E. T. Romero-Guzmán and L. R. Reyes-Gutiérrez Vol.8, No.8 0 0.001 0.002 0.00 3 0.00 4 0.00 5 0.00 6 0 0.0002 0.000 4 0.000 6 0.0008 0. 001 O H- neutralized/mol OH- fr ees/m ol Calcium p hos p ha te + 0.5 M KN O 3 0.5 M KNO 3 Figure 10. Comparation of curves of titration solution of 0.5M KNO3 and 0.5M KNO3 + calcium phosphate. 4. CONCLUSIONS The main objective of this work was the surface and physicochemical characterization of calcium phosphate obtained from bovine bone and iron (II) phosphate. The chemical elemental compositions determined by EDS were Ca, P and O for the hydryapatite and Fe, P and O for the iron (II) phosphate. The minerals identified by XRD were hydroxylapatite and vivianite for the iron (II) phosphate. The calcium phosphate is more stable than iron (II) phosphate. On the other hand, the surface properties obtained suggests that iron (II) phosphate has the best surface characteristics, specific area (10.5 m2g-1), sorbed volume, hydration time (5 hr) and wide range of pH to evaluate the heavy metal sorption with this phosphate. The next step will be to evaluate the sorption process for both compounds in metals and radionuclides. One of the main characteristics of phosphates compounds is their great stability and their capacity to retain a large variety of elements, due to their particular structure which allows substitution at different points and diffusion phenomena, in addition to the complexation reaction with functional groups in the surface of the compound and the formation of insoluble compounds via dissolution processes.  Vol.8, No.8 Surface and Physicochemical Characterization of Phosphates Vivianite 607 AKNOWLEDGEMENTS We thank Rastro de Toluca for technical support, ININ Project CONACYT 36348. To Leticia Carapia Morales and Jorge Pérez Del Prado from the Instituto Nacional de Investigaciones Nucleares for their technical help. Finally to, Liliana Romero Guzmán for all her help. REFERENCES [1] Ferguson, J. E., 1990, The Heavy Elements, In: Chemistry, Environmental Impact and Health Effects, Oxford, Pergamon Press., 211–212. [2] Hasan, M. A., Moore, R.C., Holt, K. C., and Hasan, A. A., 2003, “Overview on backfill materials and permeable reactive barriers for nuclear waste disposal facilities.” Sandia National Laboratories. New México, USA, pp. 1–27. [3] Romero, G. E. T., 2000, “Migración de uranio en la zona no saturada.” Ph.D. Thesis, Toluca México, Universidad Autónoma del Estado de México. [4] Romero, G. E. T., Ordoñez, R. En., Esteller, A. M. V., Rojas, H. A., Reyes, G. L. R. and Ordoñez, R. Ed., 2006, “Contamination of corn growing areas due to intensive fertilization in the high plane of Mexico.” Water Air and Soil Pollution, Vol. 175, pp. 77–98. [5] Drot, R., Lindecker, C., Fourest, B. and Simoni, E., 1998, “Surface characterization of zirconium and thorium phosphate compounds.” New J. Chem., pp. 1105–1109. [6] Romero, G. E. T., Esteller, A. M. V. and Ordoñez, R. E., 2002, “Uranium and phosphate behaviour in the vadose zone of a fertilised corn field.” Journal of Radioanalytical and Nuclear Chemistry, Vol. 254, No. 3, pp. 509–517. [7] Wang, D., Qian, L., Zhang, M., Xu, J., and Wu, W., 2008, “Sorption of Eu(III) and Am(III) on thorium phosphate diphosphate.” Journal of Nuclear and Radiochemistry, Vol. 30, No. 3, pp.156–161. [8] Perrone, J., Fourest, B., and Giffaut, E., 2002, “Surface characterization of synthetic and mineral carbonate fluoroapatites.” J. Colloidal and Interface Science, Vol. 249, pp. 441–452. [9] Badillo, A. V. and Ly, J., 2001, “Retención de especies aniónicas homólogas de dos productos de fisión en una hidroxiapatita.” México Nuclear, Vol. 2, No. 3, pp. 83–92. [10] Narasaraju, T. S. B., and Phebe, D. E., 1996, “Review, some physicochemical aspects of hydroxyapatite.” Journal of Materials Sciences, Vol. 31, pp. 1–21. [11] Coughlin, M. J., Grines, J. J. and Kennedy, M. P., 2006, “Coralline Hydroxyapatite bone graft substitute in hind foot.” Foot Ankle Int., Vol. 27, No. 1, pp. 19–22. [12] Morales, J. G., Burgues, J. J., Boix, T., Fraile, J., and Clemente, R. R. (2001). Precipitation of stoichiometric hydroxyapatite by continuous method. Cryst. Res. Technol., 36(1), 15–26. [13] Aizawa, M., Howell, F. S., Itatani, K., Yokogawa, Y., Nishizawa, K., Toriyama, M., and Kameyama, T., 2000, “Fabrication of porous ceramic with well-controlled open porous by sintering of fibrous hydroxyapatite.” J. Ceram. Soc. Jpn., Vol. 108, pp. 249–253.  608 D. Luna-Zaragoza, E. T. Romero-Guzmán and L. R. Reyes-Gutiérrez Vol.8, No.8 [14 ] Tanaka, H., Chikazawa, M., Kandori, K., and Ishikawa, T., 2000, “Influence of thermal treatment on the structure of calcium hydroxyapatite.” Phys. Chem. Chem. Phys., Vol. 2, pp. 2647. [15] Panda, R. N., Ming-Fa, H., Chung, R. J., and Chin, T. S., 2001, “X-ray diffractometry and X-ray photoelectron spectroscopy investigations on nanocrystalline hydroxyapatite synthesized by hydroxide gel technique.” Jpn. J. Appl. Phys., Vol. 40, pp. 5030–5035. [16] Gross, K. A., Berndt, C. C., Stephens, P., and Innebier, R., 1998, “Oxiapatite in hydroxyapatite coating.” J. Mater. Sci., Vol. 33, pp. 3985–3991. [17] Verges, M. A., González, C. F, Martínez, G. M., Solier, J. D., Cachadina, I., and Matijevic, E., 2000, “A new route for the synthesis of calcium deficient hydroxyapatites with low Ca/P ratio: Both spectroscopic and electric.” J. Mater. Res., Vol. 15, pp. 2526–2533. [18] Andersson, J., Areva, S., Bernd, S., and Lindén, M., 2005, “Sol-gel synthesis of multifunctional hierachically porous silica/apatite composition.” Biomaterials, Vol. 26, No. 34, pp. 6827–6835. [19] Wang, Y., Zhang, S., Wei, K., Zhao, N., Chen, J., and Wang, X., 2006, “Hydrothermal synthesis of hydroxyapatite nanopowders using cationic surfactant as a template.” Material Letters, Vol. 60, No. 12, pp. 1484–1487. [20] Liu, J., Li, K., Wang, H., Zhu, M., and Yam, H., 2004, “Rapid formation of hydroxyapatite nanostructures by microwave irradiation.” Chemical Physiscs Letters, Vol. 396, No. 4–6, pp. 429–432. [21] Aizawa, M., Hanazawa, T., Itatani, K., Howell, F. S., and Kishioka, A., 1999, “Characterization of hydroxyapatite powders prepared by ultrasonic spray-pyrolysis technique.” J. Mater. Sci., Vol. 34, pp. 2865–2873. [22] Silva, C. C., Rocha, H. H., Freire, F. N. A., Santos, M. R. P., Saboia, K. A., Góes, J. C., and Sombra, A. S. B., 2005, “Hydroxyapatite screen-printed thick films: optical and electrical properties.” Material, Chemistry and Physics, Vol. 92, No. 1, pp. 260–268. [23] Chen, C. W., Riman, R. E., Kener, S. T., and Kelly, B., 2004, “Mechanochemical- hydrothermal synthesis of hydroxypapatite from noionic surfactant emulsions precursors.” J. Crystal Growth., Vol. 270, No. 3–4, pp. 615–623. [24] Kim, W., and Saito, F., 2001, “Sonochemical synthesis of hydroxylapatite from H3PO4 solution with Ca(OH) 2.” Ultrasonic Sonochemistry, Vol. 8, pp. 65–88. [25] Danilchenko, S. N., Pokrovskiy, V. A., Bogatyrov, V. M., Sukhodub, L. F., and Sulkio- Cleff, B., 2005, “Carbonate location in bone tissue mineral by X-ray diffraction and temperature- programmed desorption mass spectrometry.” Cryst. Res. Technol., Vol. 40, No. 7, 692–697. [26] Fontanetto, H. B., 1993, Efecto del método de aplicación del fertilizante fosfórico en maíz a dos niveles de disponibilidad hídrica. Tesis Magister Scientiae. Facultad de Ciencias Agrarias, Universidad Nacional de Mar del Plata, Argentina, 61. [27] Dzombak, D. A., and Morel, F.M.M., 1990, “Surface Complexation Modeling, In: Hydrous Ferric Oxide”, (J. Wiley & Sons Eds), New York.  Vol.8, No.8 Surface and Physicochemical Characterization of Phosphates Vivianite 609 [28] Noh, J. S., and Schwarz, J.A., 1990, “Estimation of surface ionization constant for amphoteric solids.” Journal of Colloid and Interface Science, Vol. 139, pp. 139–148. [29] Mostafa, N. Y., 2005, “Characterization, thermal stability and sintering of hydroxyapatite powders prepared by different routes.” Materials Chemistr y and Physics, Vol. 94, pp. 333–341. [30] Bayliss, P., 1986, Mineral Powder Diffraction File Date Book: Swarthmore, PA, Joint Committee on Powder Diffraction Standards (JCPDS). [31] Pramanik, S., Kumar, A. A., Rai, K.N., and Garg, A., 2007, “Development of high strength hydroxyapatite by solid-state-sintering process.” Ceramics International, Vol. 33, pp. 419–426. |