Paper Menu >>
Journal Menu >>
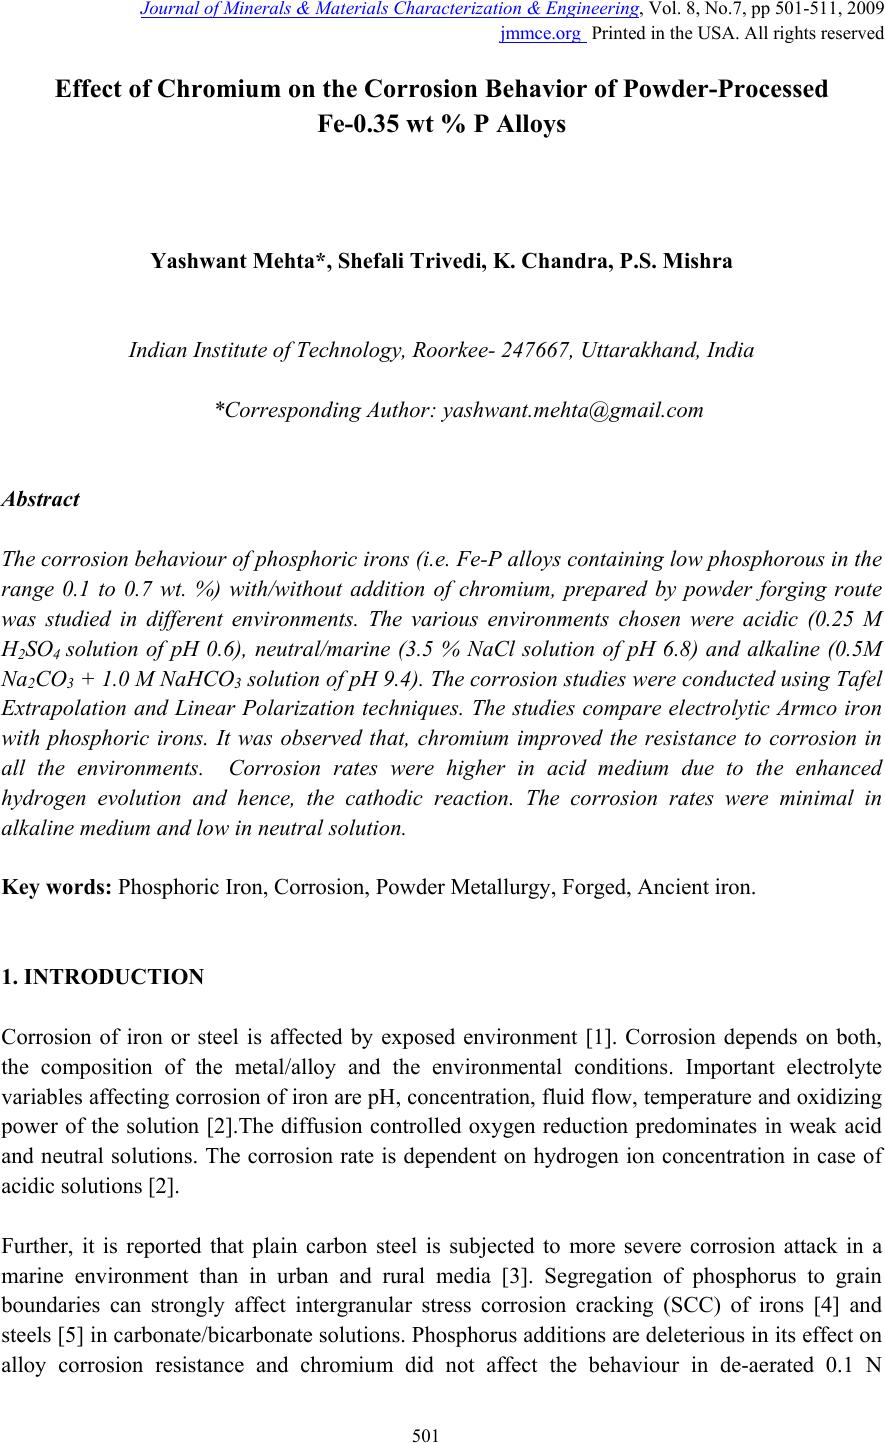 Journal of Minerals & Materials Characteri zation & Engineering, Vol. 8, No.7, pp 501-511, 2009 jmmce.org Printed in the USA. All rights reserved 501 Effect of Ch romium on the Corrosion Behavior of Powder-Processed Fe-0.35 wt % P Alloys Yashwant Mehta*, Shefali Trivedi, K. Chandra, P.S. Mishra Indian Institute of Technology, Roorkee- 247667, Uttarakhand, India *Corresponding Author: yashwant.mehta@gmail.com Abstract The corrosion behaviour of phospho ric irons (i.e. Fe-P alloys conta ining low phosphorous in th e range 0.1 to 0.7 wt. %) with/without addition of chromium, prepared by powder forging route was studied in different environments. The various environments chosen were acidic (0.25 M H2SO4 solution of pH 0.6), neutral/marine (3.5 % NaCl solution of pH 6.8) and alkaline (0.5M Na2CO3 + 1.0 M NaHCO3 solution of pH 9.4). The corrosion studies were conducted using Tafel Extrapolation and Linear Polarization techniques. The studies compare electrolytic Armco iron with phosphoric irons. It was observed that, chromium improved the resistance to corrosion in all the environments. Corrosion rates were higher in acid medium due to the enhanced hydrogen evolution and hence, the cathodic reaction. The corrosion rates were minimal in alkaline medium and low in neutral solution. Key words: Phosphoric Iron, Corrosion, Powder Metallurgy, Forged, Ancient iron. 1. INTRODUCTION Corrosion of iron or steel is affected by exposed environment [1]. Corrosion depends on both, the composition of the metal/alloy and the environmental conditions. Important electrolyte variables affecting corrosion of iron are pH, concentration, fluid flow, temperature and oxidizing power of the solution [2].The diffusion controlled oxygen reduction predominates in weak acid and neutral solutions. The corrosion rate is dependent on hydrogen ion concentration in case of acidic solutions [2]. Further, it is reported that plain carbon steel is subjected to more severe corrosion attack in a marine environment than in urban and rural media [3]. Segregation of phosphorus to grain boundaries can strongly affect intergranular stress corrosion cracking (SCC) of irons [4] and steels [5] in carbonate/bicarbonate solutions. Phosphorus additions are deleterious in its effect on alloy corrosion resistance and chromium did not affect the behaviour in de-aerated 0.1 N 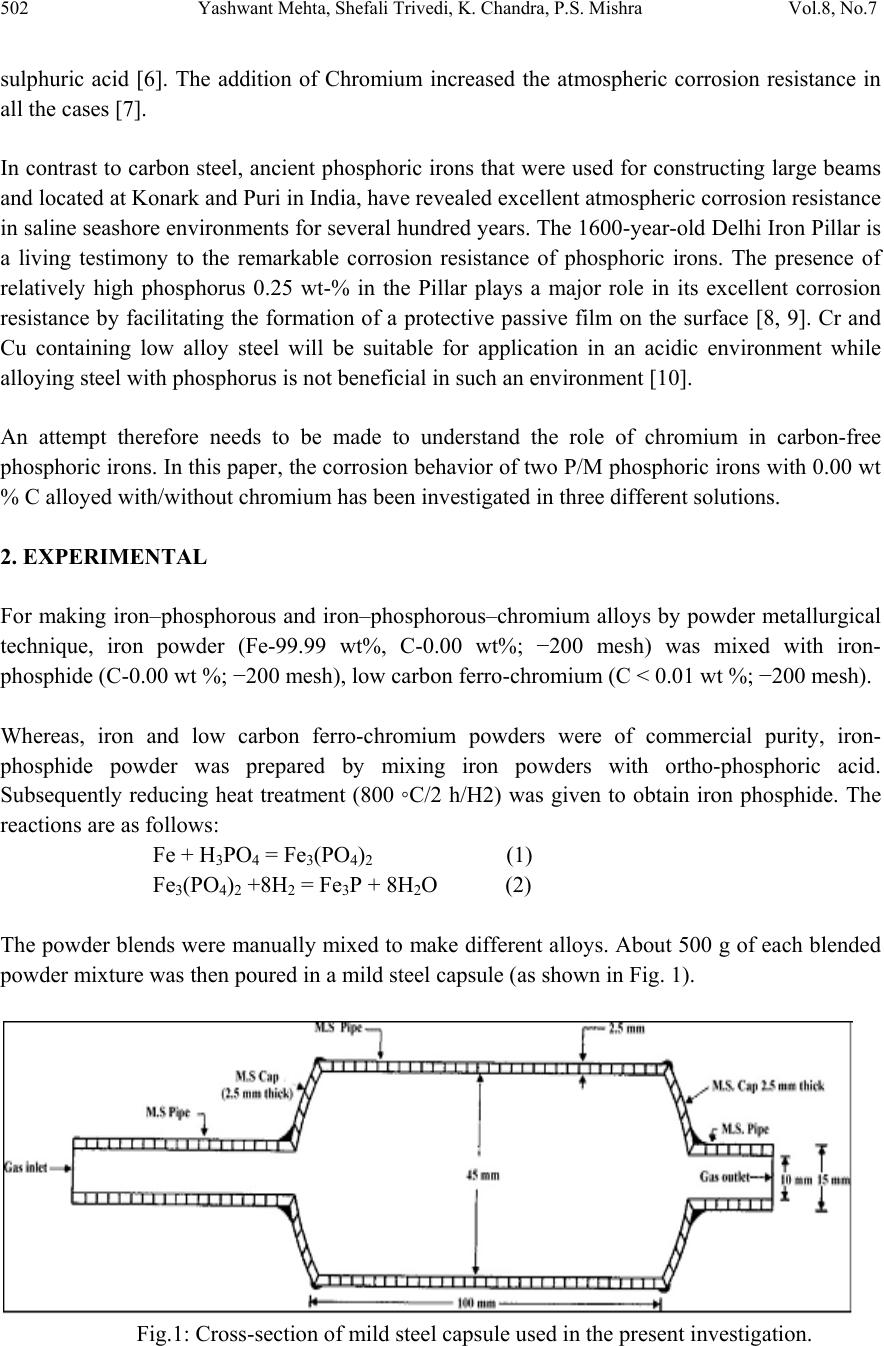 502 Yashwant Mehta, Shefali Trivedi, K. Chandra, P.S. Mishra Vol.8, No.7 sulphuric acid [6]. The addition of Chromium increased the atmospheric corrosion resistance in all the cases [7]. In contrast to carbon steel, ancient phosphoric irons that were used for constructing large beams and located at Konark and Puri in India, have revealed excellent atmospheric corrosion resistance in saline seashore environments for several hundred years. The 1600-year-old Delhi Iron Pillar is a living testimony to the remarkable corrosion resistance of phosphoric irons. The presence of relatively high phosphorus 0.25 wt-% in the Pillar plays a major role in its excellent corrosion resistance by facilitating the formation of a protective passive film on the surface [8, 9]. Cr and Cu containing low alloy steel will be suitable for application in an acidic environment while alloying steel with phosphorus is not beneficial in such an environment [10]. An attempt therefore needs to be made to understand the role of chromium in carbon-free phosphoric irons. In this paper, the corrosion behavior of two P/M phosphoric irons with 0.00 wt % C alloyed with/without chromium has been investigated in three different solutions. 2. EXPERIMENTAL For making iron–phosphorous and iron–phosphorous–chromium alloys by powder metallurgical technique, iron powder (Fe-99.99 wt%, C-0.00 wt%; −200 mesh) was mixed with iron- phosphide (C-0.00 wt %; −200 mesh), low carbon ferro-chromium (C < 0.01 wt %; −200 mesh). Whereas, iron and low carbon ferro-chromium powders were of commercial purity, iron- phosphide powder was prepared by mixing iron powders with ortho-phosphoric acid. Subsequently reducing heat treatment (800 ◦C/2 h/H2) was given to obtain iron phosphide. The reactions are as follows: Fe + H3PO4 = Fe3(PO4)2 (1) Fe3(PO4)2 +8H2 = Fe3P + 8H2O (2) The powder blends were manually mixed to make different alloys. About 500 g of each blended powder mixture was then poured in a mild steel capsule (as shown in Fig. 1). Fig.1: Cross-section of mild steel capsule used in the present investigation. 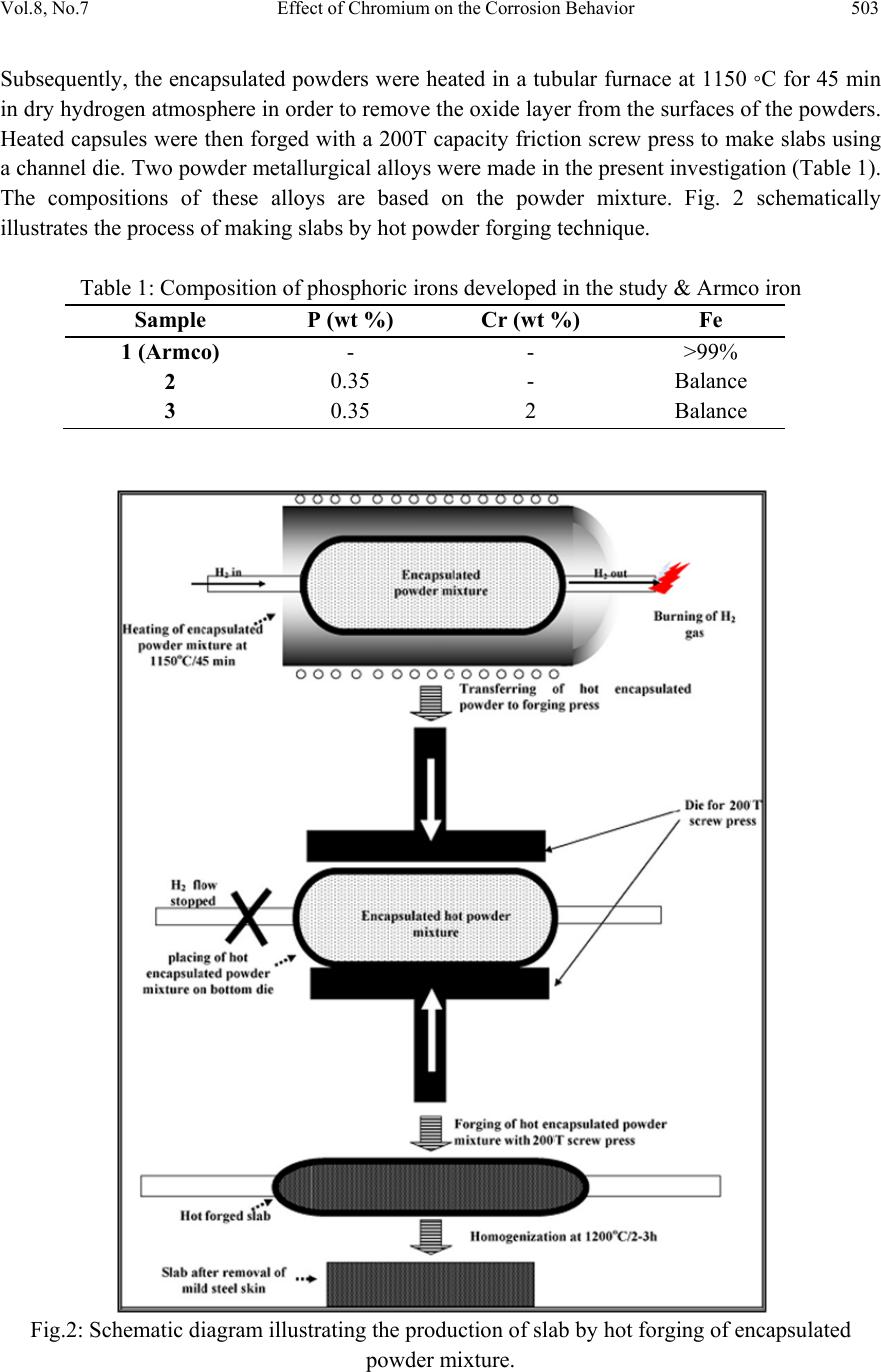 Vol.8, No.7 Effect of Chromium on the Corrosion Behavior 503 Subsequently, the encapsulated powders were heated in a tubular furnace at 1150 ◦C for 45 min in dry hydrogen atmosphere in order to remove the oxide layer from the surfaces of the powders. Heated capsules were then forged with a 200T capacity friction screw press to make slabs using a channel die. Two powder metallurgical alloys were made in the present investigation (Table 1). The compositions of these alloys are based on the powder mixture. Fig. 2 schematically illustrates the process of making slabs by hot powder forging technique. Table 1: Composition of phosphoric irons developed in the study & Armco iron Sample P (wt %) Cr (wt %) Fe 1 (Armco) - - >99% 2 0.35 - Balance 3 0.35 2 Balance Fig.2: Schematic diagram illustrating the production of slab by hot forging of encapsulated powder mixture. 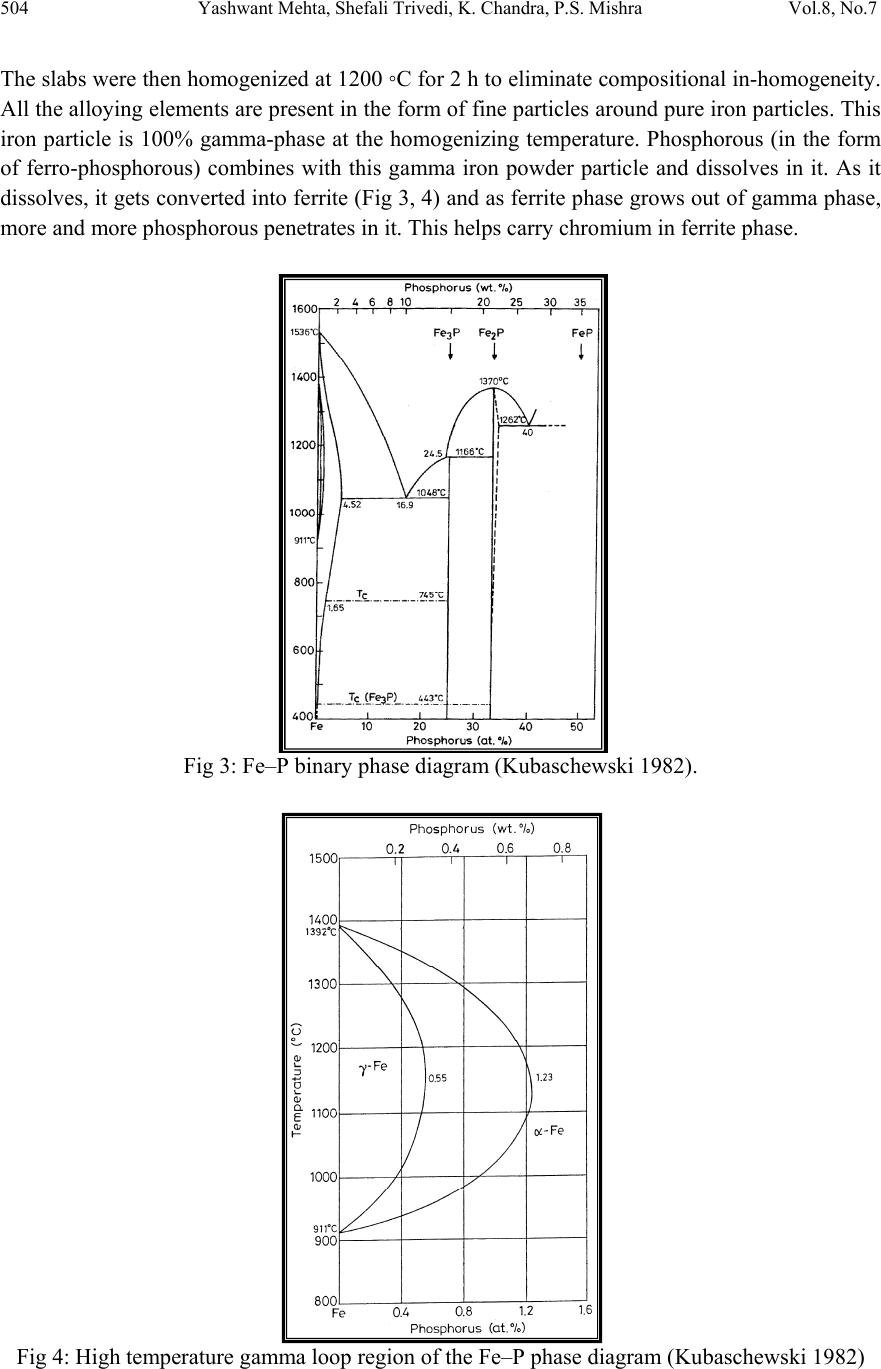 504 Yashwant Mehta, Shefali Trivedi, K. Chandra, P.S. Mishra Vol.8, No.7 The slabs were then homogenized at 1200 ◦C for 2 h to eliminate compositional in-homogeneity. All the alloying elements are present in the form of fine particles around pure iron particles. This iron particle is 100% gamma-phase at the homogenizing temperature. Phosphorous (in the form of ferro-phosphorous) combines with this gamma iron powder particle and dissolves in it. As it dissolves, it gets converted into ferrite (Fig 3, 4) and as ferrite phase grows out of gamma phase, more and more phosphorous penetrates in it. This helps carry chromium in ferrite phase. Fig 3: Fe–P binary phase diagram (Kubaschewski 1982). Fig 4: High temperature gamma loop region of the Fe–P phase diagram (Kubaschewski 1982) 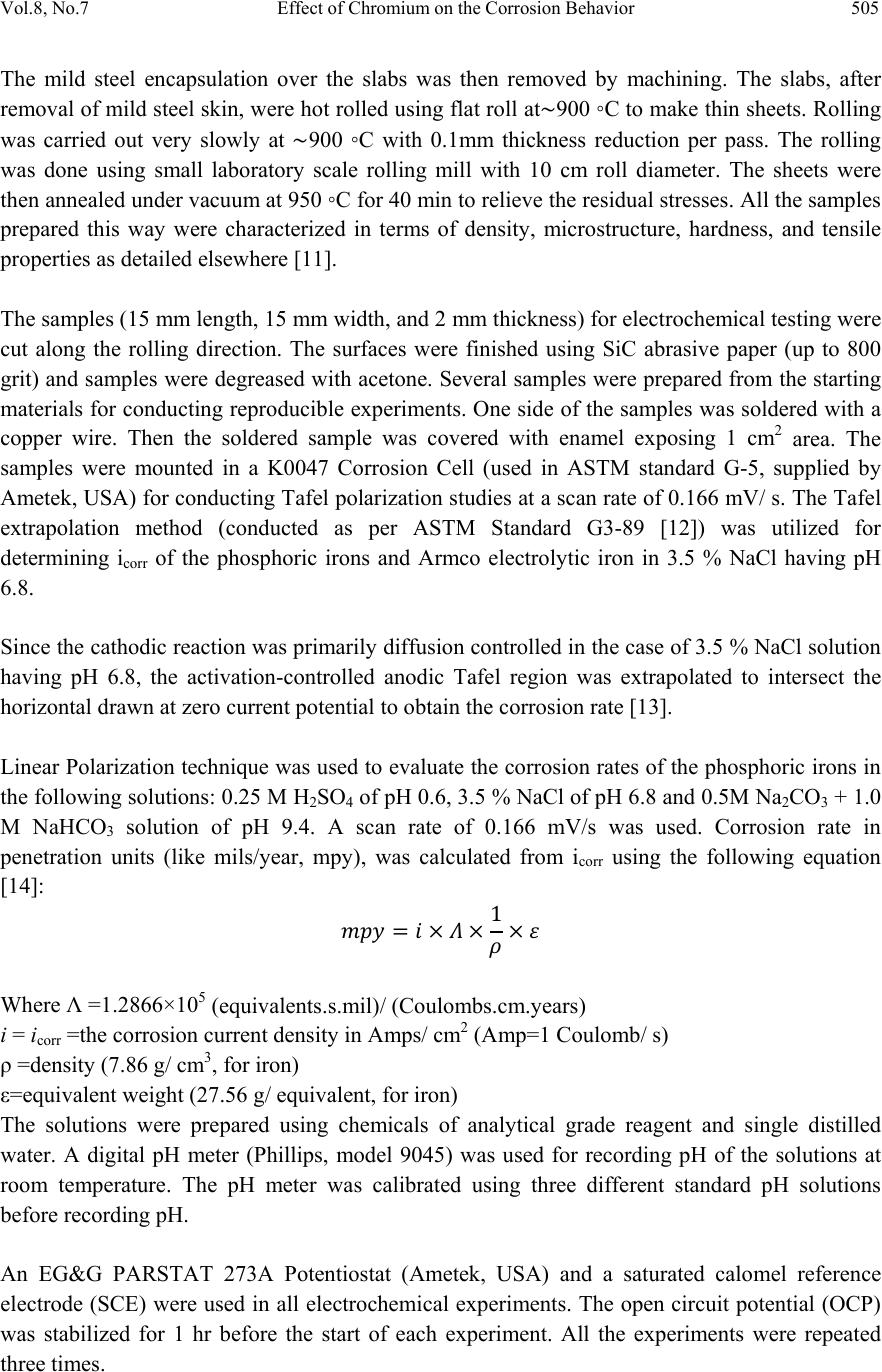 Vol.8, No.7 Effect of Chromium on the Corrosion Behavior 505 The mild steel encapsulation over the slabs was then removed by machining. The slabs, after removal of mild steel skin, were hot rolled using flat roll at900 ◦C to make thin sheets. Rolling was carried out very slowly at 900 ◦C with 0.1mm thickness reduction per pass. The rolling was done using small laboratory scale rolling mill with 10 cm roll diameter. The sheets were then annealed under vacuum at 950 ◦C for 40 min to relieve the residual stresses. All the samples prepared this way were characterized in terms of density, microstructure, hardness, and tensile properties as detailed elsewhere [11]. The samples (15 mm length, 15 mm width, and 2 mm thickness) for electrochemical testing were cut along the rolling direction. The surfaces were finished using SiC abrasive paper (up to 800 grit) and samples were degreased with acetone. Several samples were prepared from the starting materials for conducting reproducible experiments. One side of the samples was soldered with a copper wire. Then the soldered sample was covered with enamel exposing 1 cm2 area. The samples were mounted in a K0047 Corrosion Cell (used in ASTM standard G-5, supplied by Ametek, USA) for conducting Tafel polarization studies at a scan rate of 0.166 mV/ s. The Tafel extrapolation method (conducted as per ASTM Standard G3-89 [12]) was utilized for determining icorr of the phosphoric irons and Armco electrolytic iron in 3.5 % NaCl having pH 6.8. Since the cathodic reaction was primarily diffusion controlled in the case of 3.5 % NaCl solution having pH 6.8, the activation-controlled anodic Tafel region was extrapolated to intersect the horizontal drawn at zero current potential to obtain the corrosion rate [13]. Linear Polarization technique was used to evaluate the corrosion rates of the phosphoric irons in the following solutions: 0.25 M H2SO4 of pH 0.6, 3.5 % NaCl of pH 6.8 and 0.5M Na2CO3 + 1.0 M NaHCO3 solution of pH 9.4. A scan rate of 0.166 mV/s was used. Corrosion rate in penetration units (like mils/year, mpy), was calculated from icorr using the following equation [14]: 1 Where Λ =1.2866×10⁵ (equivalents.s.mil)/ (Coulombs.cm.years) i = icorr =the corrosion current density in Amps/ cm2 (Amp=1 Coulomb/ s) ρ =density (7.86 g/ cm3, for iron) ε=equivalent weight (27.56 g/ equivalent, for iron) The solutions were prepared using chemicals of analytical grade reagent and single distilled water. A digital pH meter (Phillips, model 9045) was used for recording pH of the solutions at room temperature. The pH meter was calibrated using three different standard pH solutions before recording pH. An EG&G PARSTAT 273A Potentiostat (Ametek, USA) and a saturated calomel reference electrode (SCE) were used in all electrochemical experiments. The open circuit potential (OCP) was stabilized for 1 hr before the start of each experiment. All the experiments were repeated three times.  506 Yashwant Mehta, Shefali Trivedi, K. Chandra, P.S. Mishra Vol.8, No.7 3. RESULTS AND DISCUSSION The corrosion rates determined by the Tafel extrapolation method in aerated solution of 0.25 M H2SO4 of pH 0.6 & 3.5 % NaCl of pH 6.8 and those determined by the linear polarization method in aerated solutions of 0.5M Na2CO3 + 1.0 M NaHCO3 of pH 9.4 are discussed separately below. The cathodic reaction for the samples obtained in all the three solutions discussed above consists of a composite reaction of [15] hydrogen evolution 2H++2e−→H2, 2H2O+2e-→H2+2OH− And oxygen reduction 1/2O2+H2O+2e−→2OH− This is also evident from Pourbaix diagram of the Fe-H2O system. 3.1. Tafel Extrapolation Method 3.1.1. 0.25 M H2SO4 solution (pH 0.6) As pH decreases, hydrogen evolution rate will dominate over oxygen reduction rate at Ecorr. Thus, at pH 0.6, the contribution of hydrogen evolution at Ecorr is significant. The exchange current density io for hydrogen evolution H+/H2 and icorr increase on increasing the concentration of H+ ion or decreasing the pH [16]. Hence corrosion rate increases. The beta anodic & cathodic slopes, Ecorr, icorr and corrosion rate (mpy) obtained from the tafel curves of the samples are tabulated in Table 2 and displayed in Fig. 5. The Ecorr lies between -466 mVsce & -523 mVsce. The corrosion rate for sample 3 is 61 mpy. This is similar to that obtained for copper-chromium based corrosion resistant TATA steel (46 mpy). The corrosion rate for sample 2 is 185 mpy and is much less than that obtained for plain carbon steel (250 mpy) [10]. -800 -700 -600 -500 -400 -6 -5 -4 -3 -2 -1 1 2 3 log i (Amp/cm2) Esce (mV) Figure 5: Tafel curves for Phosphoric irons in 0.25 M H2SO4 solution (0.6 pH).  Vol.8, No.7 Effect of Chromium on the Corrosion Behavior 507 Table 2: Corrosion data (Tafel) for Phosphoric irons in 0.25 M H2SO4 solution (0.6 pH) Sample Beta Anodi c V/decade Beta Cathodi c V/decade E(I=0) mV Icorr µA Corrosion Ra t (mpy) 1 -509.0E33 181.9E-3 -553.0 174.7 78.8 2 29.69E-3 111.6E-3 -466.0 410.1 185.0 3 75.04E-3 138.3E-3 -523.6 135.1 60.9 3.3.2. 3.5 % NaCl solution (pH 6.8) The Tafel plots obtained in aerated 3.5 % NaCl solution are shown in Fig. 6. Tafel polarization curves showed diffusion controlled cathodic reaction in all cases. In this case, the diffusion- controlled oxygen reduction reaction is the dominant reaction at Ecorr [15].The activation controlled anodic Tafel slopes, icorr and corrosion rate (mpy) obtained from the Tafel polarization curves of samples (Fig. 5) are tabulated in Table 3. Since the cathodic reaction is diffusion controlled, hence the cathodic Tafel slopes are not provided in Table 3 [13]. -800 -700 -600 -500 -400 -300 -8 -6 -4 -2 log i (Amp/cm2) Esce(mV) 1 2 3 Figure 6: Tafel curves for Phosphoric irons in 3.5 % NaCl solution (6.8 pH) Table 3: Corrosion data (Tafel) for Phosphoric irons in 3.5 % NaCl solution (6.8 pH). Sampl e Beta Anod i V/decad e E(I=0) mV Icorr µA Corrosion Ra t (mpy) 1. 67.08E-3-424.6 2.897 1.3 2. 61.15E-3-559.4 16.42 7.4 3. 37.20E-3-479.8 7.644 3.4  508 Yashwant Mehta, Shefali Trivedi, K. Chandra, P.S. Mishra Vol.8, No.7 The corrosion rate was obtained from the Tafel extrapolation method matched with literature data, as discussed below. The corrosion rate of iron is 12 mpy as obtained by the Tafel extrapolation method after 24 hours of immersion in unstirred, air saturated 3.5 % NaCl solution [17]. The actual corrosion rate of plain carbon steel (AISI 1020 steel) in quiet surface water is up to 15 mpy in the first year and then decreases to 5 mpy after 1000 days [18]. The Ecorr of the samples lies between −600 mVSCE and −690 mVSCE . The corrosion rate of samples obtained by the Tafel extrapolation method after 1 h immersion in 3.5 % NaCl was in the range of 6 to 10 mpy [10]. In the present study, the corrosion rate of samples obtained by the Tafel extrapolation method after 1 h immersion in 3.5 % NaCl was in the range of 3.4 to 7.4 mpy. The Ecorr of the samples lies between −480 mVSCE and −560 mVSCE. 3.2. Linear Polarization Method 3.2.1. 0.5M Na2CO3 + 1.0 M NaHCO3 solution (pH 9.4) This solution was chosen to evaluate the corrosion resistance of the samples against soil (buried condition). Alkaline solutions are known to cause intergranular SCC due to segregation of Phosphorous in low alloy steels [19]. The Rp, Ecorr, icorr and corrosion rate (mpy) obtained from the linear polarization curves of samples are tabulated in Table 4 and displayed in Fig. 7. The Ecorr lies between -241 mVsce & - 243 mVsce. The corrosion rate is low and lies between 0.46-0.57 mpy (mils per year). These materials can be used in buried (in soil) conditions. Fig 7: Bar chart displaying corrosion data (Linear Polarization) for Phosphoric irons in 0.5M Na2CO3 + 1.0 M NaHCO3 solution (9.4 pH) 0 0.1 0.2 0.3 0.4 0.5 0.6 123 mpy/9.4pH 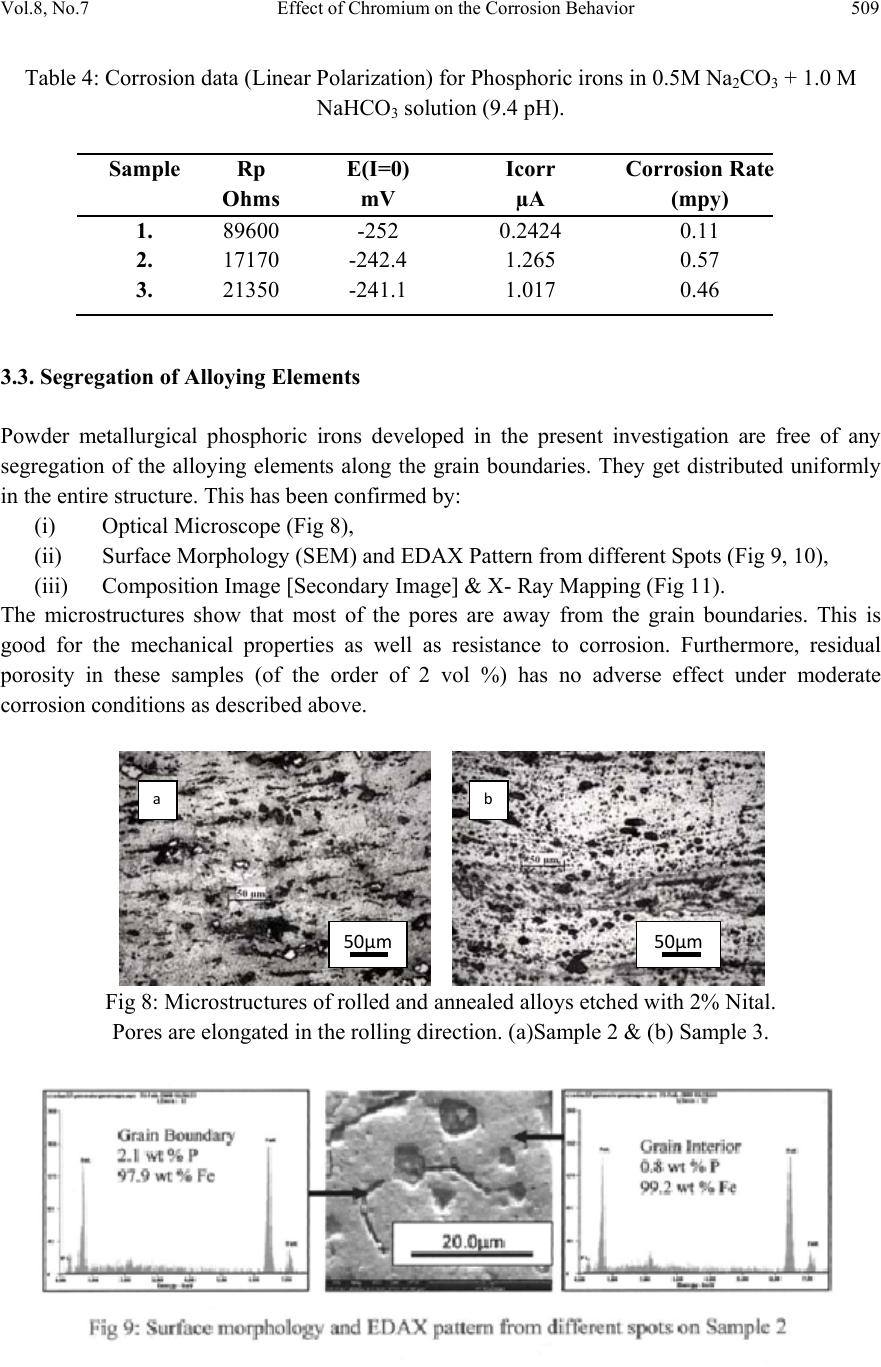 Vol.8, No.7 Effect of Chromium on the Corrosion Behavior 509 Table 4: Corrosion data (Linear Polarization) for Phosphoric irons in 0.5M Na2CO3 + 1.0 M NaHCO3 solution (9.4 pH). 3.3. Segregation of Alloying Elements Powder metallurgical phosphoric irons developed in the present investigation are free of any segregation of the alloying elements along the grain boundaries. They get distributed uniformly in the entire structure. This has been confirmed by: (i) Optical Microscope (Fig 8), (ii) Surface Morphology (SEM) and EDAX Pattern from different Spots (Fig 9, 10), (iii) Composition Image [Secondary Image] & X- Ray Mapping (Fig 11). The microstructures show that most of the pores are away from the grain boundaries. This is good for the mechanical properties as well as resistance to corrosion. Furthermore, residual porosity in these samples (of the order of 2 vol %) has no adverse effect under moderate corrosion conditions as described above. Fig 8: Microstructures of rolled and annealed alloys etched with 2% Nital. Pores are elongated in the rolling direction. (a)Sample 2 & (b) Sample 3. SampleRp Ohms E(I=0) mV Icorr µA Corrosion Rat e (mpy) 1. 89600 -252 0.2424 0.11 2. 17170 -242.4 1.265 0.57 3. 21350 -241.1 1.017 0.46 50µm50µm ab 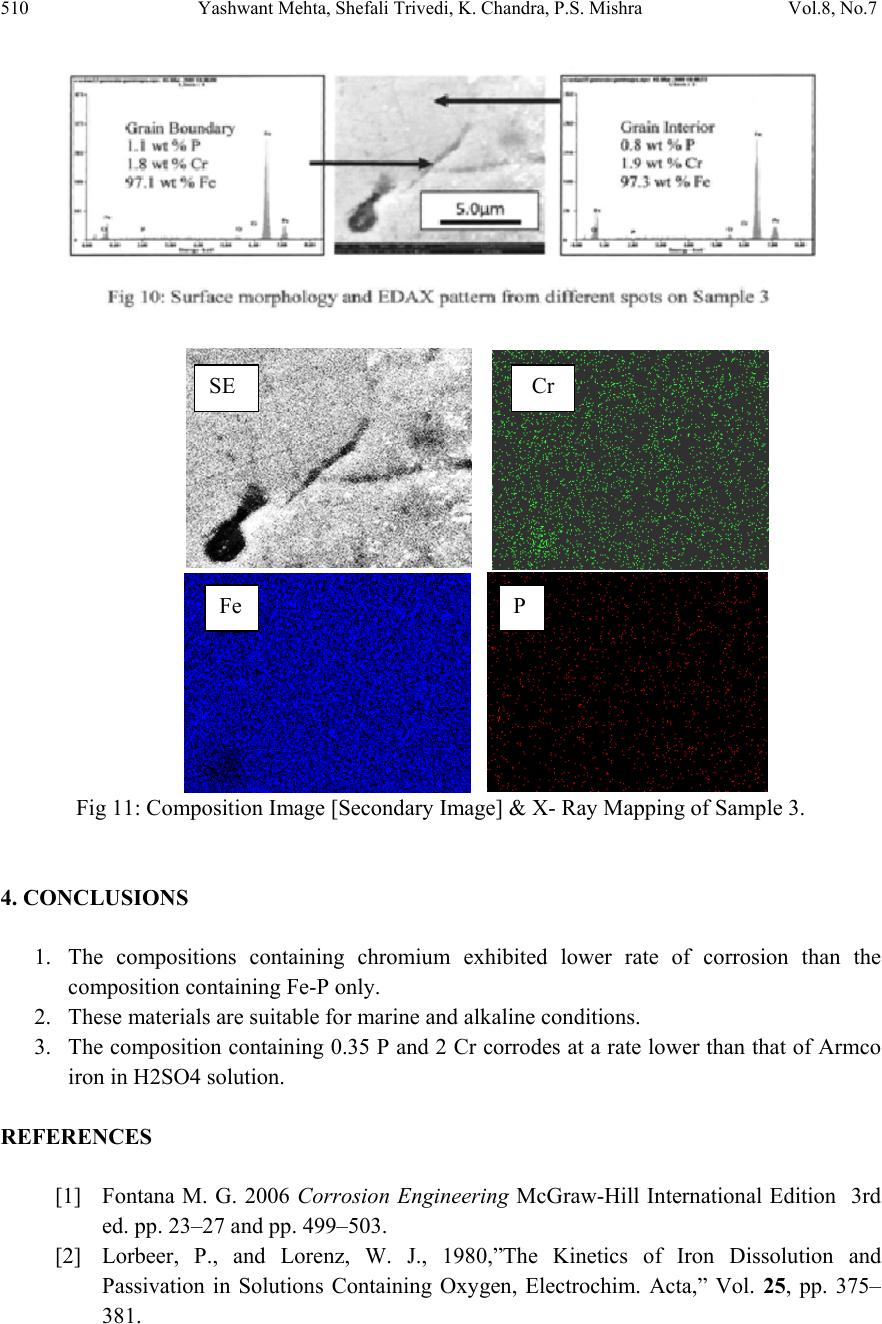 510 Yashwant Mehta, Shefali Trivedi, K. Chandra, P.S. Mishra Vol.8, No.7 Fig 11: Composition Image [Secondary Image] & X- Ray Mapping of Sample 3. 4. CONCLUSIONS 1. The compositions containing chromium exhibited lower rate of corrosion than the composition containing Fe-P only. 2. These materials are suitable for marine and alkaline conditions. 3. The composition containing 0.35 P and 2 Cr corrodes at a rate lower than that of Armco iron in H2SO4 solution. REFERENCES [1] Fontana M. G. 2006 Corrosion Engineering McGraw-Hill International Edition 3rd ed. pp. 23–27 and pp. 499–503. [2] Lorbeer, P., and Lorenz, W. J., 1980,”The Kinetics of Iron Dissolution and Passivation in Solutions Containing Oxygen, Electrochim. Acta,” Vol. 25, pp. 375– 381. P Fe Cr SE 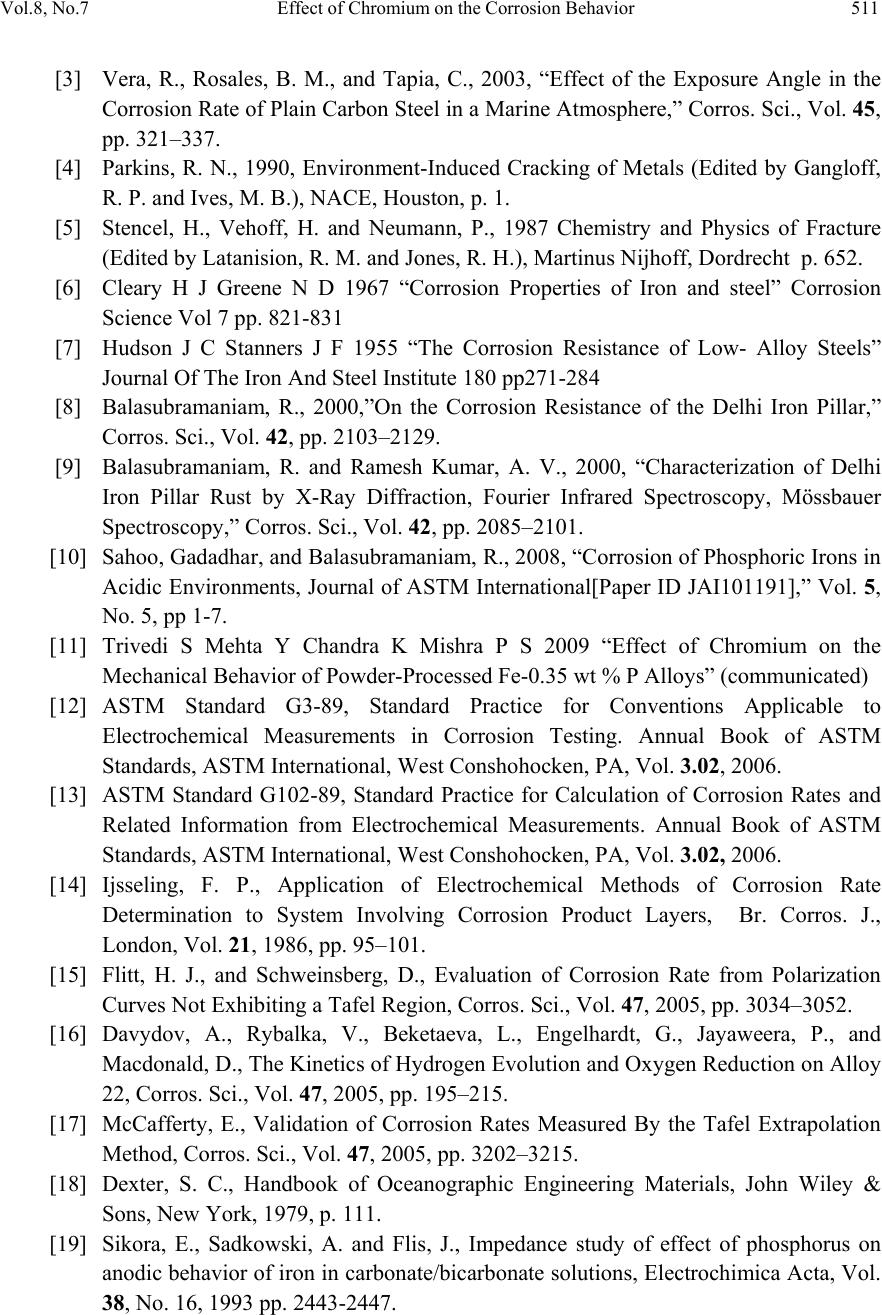 Vol.8, No.7 Effect of Chromium on the Corrosion Behavior 511 [3] Vera, R., Rosales, B. M., and Tapia, C., 2003, “Effect of the Exposure Angle in the Corrosion Rate of Plain Carbon Steel in a Marine Atmosphere,” Corros. Sci., Vol. 45, pp. 321–337. [4] Parkins, R. N., 1990, Environment-Induced Cracking of Metals (Edited by Gangloff, R. P. and Ives, M. B.), NACE, Houston, p. 1. [5] Stencel, H., Vehoff, H. and Neumann, P., 1987 Chemistry and Physics of Fracture (Edited by Latanision, R. M. and Jones, R. H.), Martinus Nijhoff, Dordrecht p. 652. [6] Cleary H J Greene N D 1967 “Corrosion Properties of Iron and steel” Corrosion Science Vol 7 pp. 821-831 [7] Hudson J C Stanners J F 1955 “The Corrosion Resistance of Low- Alloy Steels” Journal Of The Iron And Steel Institute 180 pp271-284 [8] Balasubramaniam, R., 2000,”On the Corrosion Resistance of the Delhi Iron Pillar,” Corros. Sci., Vol. 42, pp. 2103–2129. [9] Balasubramaniam, R. and Ramesh Kumar, A. V., 2000, “Characterization of Delhi Iron Pillar Rust by X-Ray Diffraction, Fourier Infrared Spectroscopy, Mössbauer Spectroscopy,” Corros. Sci., Vol. 42, pp. 2085–2101. [10] Sahoo, Gadadhar, and Balasubramaniam, R., 2008, “Corrosion of Phosphoric Irons in Acidic Environments, Journal of ASTM International[Paper ID JAI101191],” Vol. 5, No. 5, pp 1-7. [11] Trivedi S Mehta Y Chandra K Mishra P S 2009 “Effect of Chromium on the Mechanical Behavior of Powder-Processed Fe-0.35 wt % P Alloys” (communicated) [12] ASTM Standard G3-89, Standard Practice for Conventions Applicable to Electrochemical Measurements in Corrosion Testing. Annual Book of ASTM Standards, ASTM International, West Conshohocken, PA, Vol. 3.02, 2006. [13] ASTM Standard G102-89, Standard Practice for Calculation of Corrosion Rates and Related Information from Electrochemical Measurements. Annual Book of ASTM Standards, ASTM International, West Conshohocken, PA, Vol. 3.02, 2006. [14] Ijsseling, F. P., Application of Electrochemical Methods of Corrosion Rate Determination to System Involving Corrosion Product Layers, Br. Corros. J., London, Vol. 21, 1986, pp. 95–101. [15] Flitt, H. J., and Schweinsberg, D., Evaluation of Corrosion Rate from Polarization Curves Not Exhibiting a Tafel Region, Corros. Sci., Vol. 47, 2005, pp. 3034–3052. [16] Davydov, A., Rybalka, V., Beketaeva, L., Engelhardt, G., Jayaweera, P., and Macdonald, D., The Kinetics of Hydrogen Evolution and Oxygen Reduction on Alloy 22, Corros. Sci., Vol. 47, 2005, pp. 195–215. [17] McCafferty, E., Validation of Corrosion Rates Measured By the Tafel Extrapolation Method, Corros. Sci., Vol. 47, 2005, pp. 3202–3215. [18] Dexter, S. C., Handbook of Oceanographic Engineering Materials, John Wiley & Sons, New York, 1979, p. 111. [19] Sikora, E., Sadkowski, A. and Flis, J., Impedance study of effect of phosphorus on anodic behavior of iron in carbonate/bicarbonate solutions, Electrochimica Acta, Vol. 38, No. 16, 1993 pp. 2443-2447. |