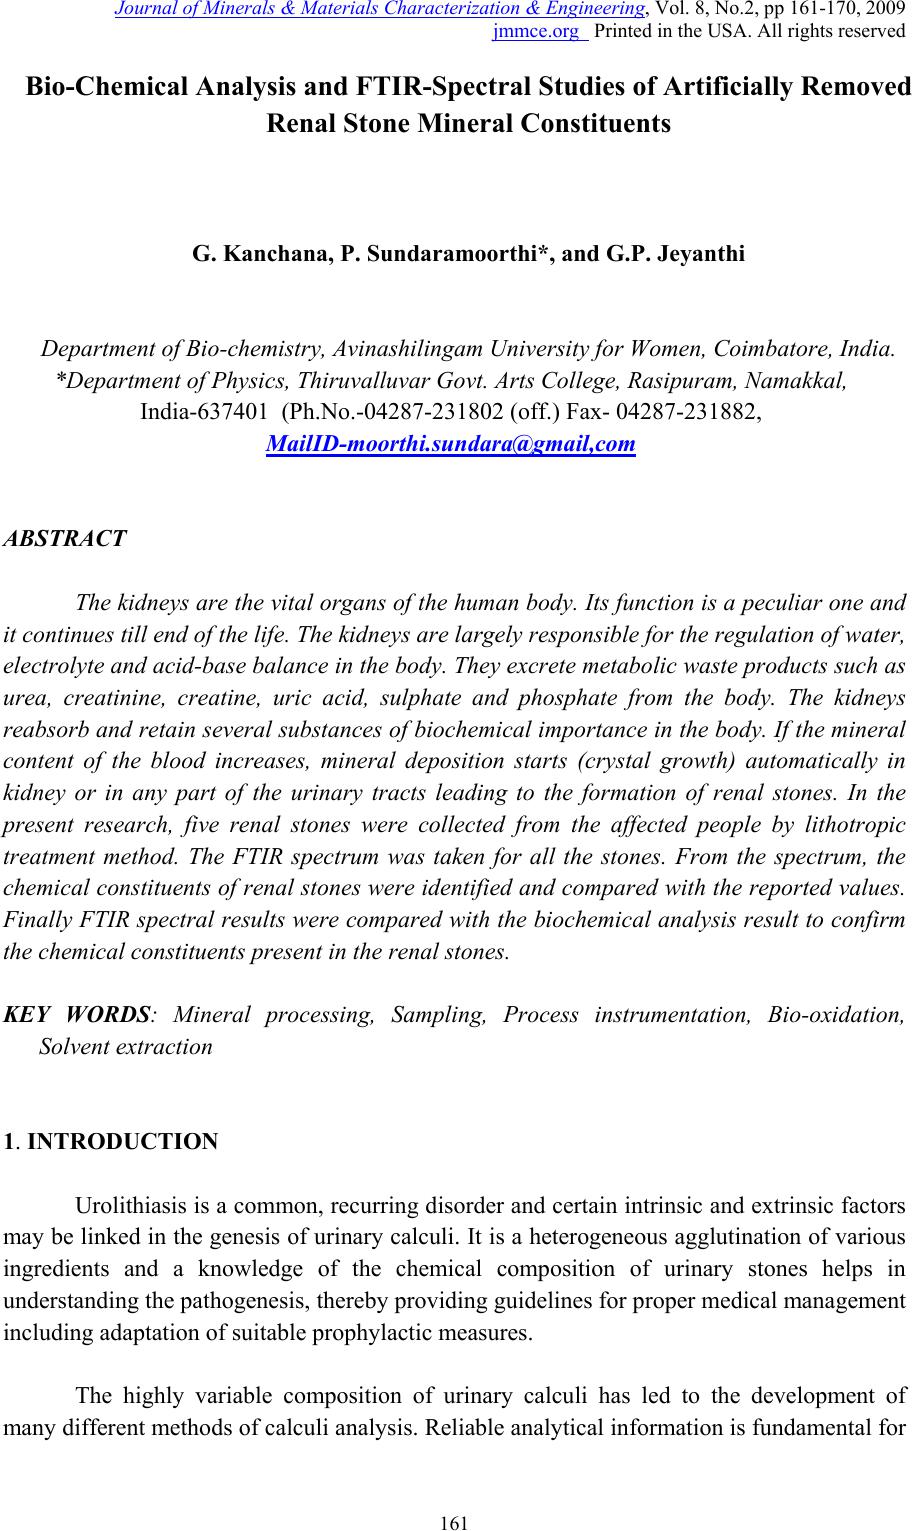
 Journal of Minerals & Materials Characterization & Engineering, Vol. 8, No.2, pp 161-170, 2009 jmmce.org Printed in the USA. All rights reserved Bio-Chemical Analysis and FTIR-Spectral Studies of Artificially Removed Renal Stone Mineral Constituents G. Kanchana, P. Sundaramoorthi*, and G.P. Jeyanthi Department of Bio-chemist r y , Avinashilingam University for Women, Coimbatore, India. *Department of Physics, Thiruvalluvar Govt. Arts College, Rasipuram, Namakkal, India-637401 (Ph.No.-04287-231802 (off.) Fax- 04287-231882, MailID-moorthi.sundara@gmail,com ABSTRACT The kidneys are the vital organs of the human body. Its function is a peculiar one and it continues till end of the life . The kidneys are largely responsible for the regulation of water, electrolyte and acid-base balance in the body. They excrete metabolic waste products such as urea, creatinine, creatine, uric acid, sulphate and phosphate from the body. The kidneys reabsorb and retain several substances of biochemical importance in the body. If the mineral content of the blood increases, mineral deposition starts (crystal growth) automatically in kidney or in any part of the urinary tracts leading to the formation of renal stones. In the present research, five renal stones were collected from the affected people by lithotropic treatment method. The FTIR spectrum was taken for all the stones. From the spectrum, the chemical constituents of renal stones were identified and compared with the reported values. Finally FTIR spectral results were compared with the biochemical analysis result to confirm the chemical constituents present in the renal stones. KEY WORDS: Mineral processing, Sampling, Process instrumentation, Bio-oxidation, Solvent extraction 1. INTRODUCTION Urolithiasis is a common, recurring disorder and certain intrinsic and extrinsic factors may be linked in the genesis of urinary calculi. It is a heterogeneous agglutination of various ingredients and a knowledge of the chemical composition of urinary stones helps in understanding the pathogenesis, thereby providing guidelines for proper medical management including adaptation of suitable prophylact ic measures. The highly variable composition of urinary calculi has led to the development of many different methods of calculi analysis. Reliable analytical information is fundamental for 161  162 G. Kanchana, P. Sundaramoorthi, and G.P. Jeyanthi Vol.8, No.2 a study of the etiology of formation of stones and is required for planning the policy of medical management. In general, analytical methods can be divided into chemical and physical methods. These include biochemical analysis, X-ray diffraction (Mandel, 1986; Sutor, 1968), polarization microscopy (Alexandar, 1942), infrared spectroscopy (Hesse, 1982; Berthelot, 1987; Leeman, 1988), Raman spectroscopy (Venkataramana and Kodati, 1990), scanning electron microscopy with energy dispersive X–ray analysis, transmission electron microscopy, computed tomography, magnetic resonance imaging and thermo gravimetric analysis, (AlanRose, 1976)). In this study, biochemical analysis was done for all the stones after surgical removal and they were also studied by FTIR spectral analysis technique. 2. BIOCHEMICAL ANALYSIS OF URINARY STONES Chemical analysis remains the most suitable procedure in routine work (Beeler, 1964) and is normally used in hospitals since the protocols are straightforward. It does not require expensive specialized equipment. Qualitative chemical tests provide the rough indication of the presence of different constituents in mixed stones. The determination of the nature of the calculi has an important diagnostic value and the various tests are performed for the chemical examination of urinary calculi. Surgically removed urinary stones were procured from Siva Hospital, Rasipuram. The stones were washed with distilled water to remove loose debris such as blood, mucous and casts and then air-dried. For analyzing the urinary stone constituents, stones were hack-sawed into halves and the powder obtained from all the layers was intimately mixed in agate mortar. This powder stone sample was used for the analysis. A total of five stones were collected and the samples were coded as A, B, C, D, and E. From the biochemical analysis, the sample A shows the presence of oxalate, phosphate, calcium, magnesium and ammonium group. Thus, the constituents of sample A may be calcium oxalate, calcium phosphate and magnesium ammonium phosphate. Sample B, C and D which were analyzed by biochemical method shows the presence of uric acid, oxalate, phosphate, carbonate, calcium, magnesium and ammonium. Thus, the constituents of sample B, C and D may be calcium oxalate, calcium phosphate (carbonated) uric acid and magnesium ammonium phosphate. Sample E shows the presence of oxalate, cystine, phosphate, calcium, and magnesium and ammonium group. The constituents of sample E may be calcium oxalate, calcium phosphate, cystine and magnesium ammonium phosphate. The Stones are shown in Figure-1 and the constituents of urinary stones (A, B, C, D and E) analyzed by biochemical methods are shown in Table-1.  Vol.8, No.2 Bio-Chemical Analysis and FTIR-Spectral Studies 163 Table-1 Chemical constituents of urinary stones. S.No. Samples Name Chemical constit uents present in the samples 1 A Calcium oxalate, Calcium phosphate and Magnesium ammonium phosphate 2 B Calcium oxalate, Carbonate apatite, Magnesium ammonium phosphate and Uric acid 3 C Calcium oxalate, Carbonate apatite, Magnesium ammonium phosphate and Uric acid 4 D Calcium oxalate, Carbonate apatite, Magnesium ammonium phosphate and Uric acid 5 E Calcium oxalate, Calcium phosphate, Magnesium ammonium phosphate and Cystine A C B D E Fig.-1. (A, B, C, D and E) Renal stones.  164 G. Kanchana, P. Sundaramoorthi, and G.P. Jeyanthi Vol.8, No.2 3. FOURIER TRANSFORM INFRA RED (FTIR) SPECTROSCOPY ANALYSIS OF URINARY CALCULI FTIR spectroscopy has being used extensively for the identification of organic and inorganic compounds (Hess, 1982; Beeler, 1964). FTIR spectroscopy has been often used to study urolithialsis. This technique is specific, rapid and versatile and thus can be used for analysis of urinary stone. FTIR spectroscopy provides qualitative and semi-quantitative analysis. Depending on the chemical bonding conditions and also on the particular structure, every molecule gives a characteristic absorption spectrum in the infrared region. The vibration motions of atoms in bonds (bond stretching/ contracting/ bond wagging) are measured by passing FTIR through the powdered stone sample, which has been compressed into a nearly transparent wafer with adequate quantity of potassium bromide. In the FTIR region (4000-200 cm–1), oscillations can be induced in molecules and crystals which bring about an alteration of the dipole moment of the oscillating system. When infrared radiation is incident on the urinary stone, characteristic attenuations of the incident energy occur depending on the ability of the molecules in the compound to oscillate at certain wavelengths. The number of oscillations possible in a molecule depends on the number and nature of the atoms present and the angular structure of the molecule. FTIR spectroscopy is an ideal choice for the characterization of crystalline and non- crystalline samples. For the FTIR spectroscopic investigation, the powdered urinary stone material is homogenously mixed with potassium bromide, an inert carrier substance which does not show any absorption in the spectral region to be investigated. It is then pressed into a pellet using evacuated disc under high pressure. Analysis of the constituents in urinary calculi using FTIR spectrum was made for all the five samples. Sample A was found to be a mixture of calcium oxalate monohydrate and calcium phosphate. The important spectral characteristics of pure COM is that it shows grouping of five bands between 3477–3047 cm-1, which is due to symmetric and asymmetric O-H stretch. Absorptions at 1620 cm-1 and 1320 cm-1 may be due to vibration of C=O and C- O respectively (Yean-Chin Tsay, 1982). The absorption band at 885 cm-1 is due to C – C stretching mode. The bands at 662 and 781 cm-1 are due to the out -of- plane O-H bending and C-H bending mode respectively and band at 517 cm-1 arises due to O-C-O in-plane bending (Sundaramoorthi, 2007). The discrete formation of the two bands at 780 and 517 cm- 1 is important for distinguishing COM from COD. PO4 group usually has an absorption range of 1000- 1100 cm-1 (Yean-Chin Tsay, 1982). The absorbance values of calculi (A) containing COM and calcium phosphate with their wave numbers are shown in Table-2. The FTIR spectrum of the combination of COM and calcium phosphate calculi is shown in Figure-.2. Three stones (B, C and D) were found to be the combination of calcium oxalate dehydrate (COD), calcium phosphate and magnesium ammonium phosphate hexahydrate (struvite). The broad band at 3000 cm–1 is due to the presence of O-H group. The absorbance at1670 and 1348 cm-1 shows the presence of C=O and C-O stretching vibrations. The broad band at 3000 cm-1 may be due to the dihydrate form of calcium oxalate. The method of 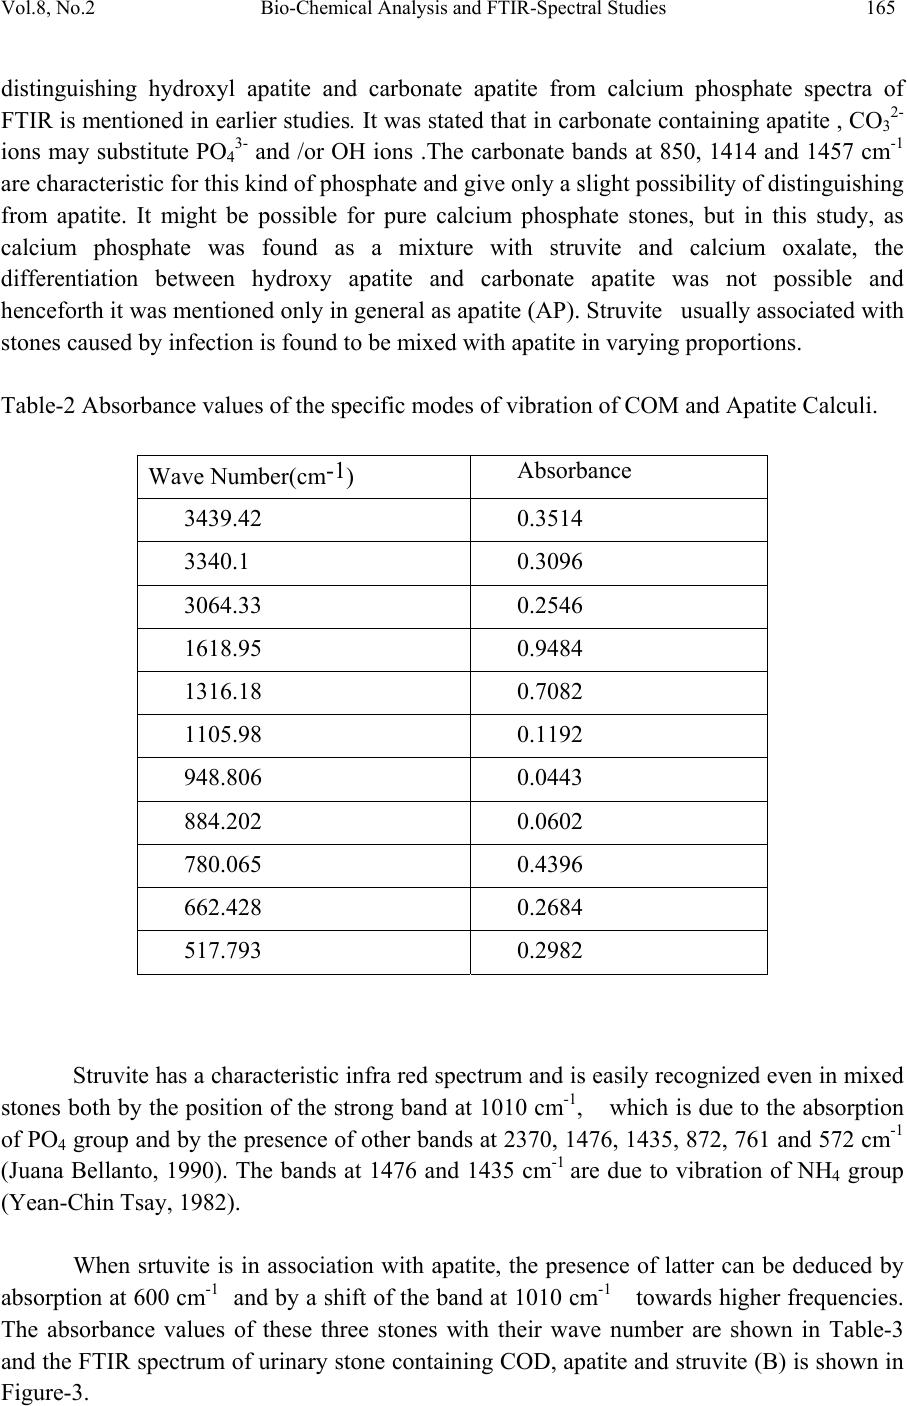 Vol.8, No.2 Bio-Chemical Analysis and FTIR-Spectral Studies 165 distinguishing hydroxyl apatite and carbonate apatite from calcium phosphate spectra of FTIR is mentioned in earlier studies. It was stated that in carbonate containing apatite , CO32- ions may substitute PO43- and /or OH ions .The carbonate bands at 850, 1414 and 1457 cm-1 are characteristic for this kind of phosphate and give only a slight possibility of distinguishing from apatite. It might be possible for pure calcium phosphate stones, but in this study, as calcium phosphate was found as a mixture with struvite and calcium oxalate, the differentiation between hydroxy apatite and carbonate apatite was not possible and henceforth it was mentioned only in general as apatite (AP). Struvite usually associated with stones caused by infection is found to be mixed with apatite in varying proportions. Table-2 Absorbance values of the specific modes of vibration of COM and Apatite Calculi. Wave Number(cm-1) Absorbance 3439.42 0.3514 3340.1 0.3096 3064.33 0.2546 1618.95 0.9484 1316.18 0.7082 1105.98 0.1192 948.806 0.0443 884.202 0.0602 780.065 0.4396 662.428 0.2684 517.793 0.2982 Struvite has a characteristic infra red spectrum and is easily recognized even in mixed stones both by the position of the strong band at 1010 cm-1, which is due to the absorption of PO4 group and by the presence of other bands at 2370, 1476, 1435, 872, 761 and 572 cm-1 (Juana Bellanto, 1990). The bands at 1476 and 1435 cm-1 are due to vibration of NH4 group (Yean-Chin Tsay, 1982). When srtuvite is in association with apatite, the presence of latter can be deduced by absorption at 600 cm-1 and by a shift of the band at 1010 cm-1 towards higher frequencies. The absorbance values of these three stones with their wave number are shown in Table-3 and the FTIR spectrum of urinary stone containing COD, apatite and struvite (B) is shown in Figure-3.  166 G. Kanchana, P. Sundaramoorthi, and G.P. Jeyanthi Vol.8, No.2 Table-3 Absorbance values of the specific modes of vibrations of urinary calculi containing Apatite and MAPH. Samples B C D Wave Number (cm-1) Absorbance Wave Number (cm-1) Absorbance Wave Number (cm-1) Absorbance 3007.44 0.2193 3019.01 0.7978 3013.23 1.537 1666.2 0.2315 1696.09 1.467 1674.87 0.8953 _ _ 1485.88 0.8940 1485.88 0.3833 1433.82 0.2009 1433.82 1.0155 1433.82 0.4210 1348 0.2146 1348.96 1.184 1348.96 0.5056 1024.98 0.1456 1025.94 0.4842 1024.98 0.2035 876.488 0.1530 876.488 0.4977 876.488 0.2081 782.958 0.2377 783.922 1.278 782.958 0.6307 618.074 0.1874 619.038 0.7047 618.074 0.2948 571.79 0.1865 572.755 0.6438 572.755 0.2908 519.722 0.1718 520.686 0.5858 520.686 0.2533 Fig-2 FTIR spectrum of urinary stone containing COM and calcium phosphate 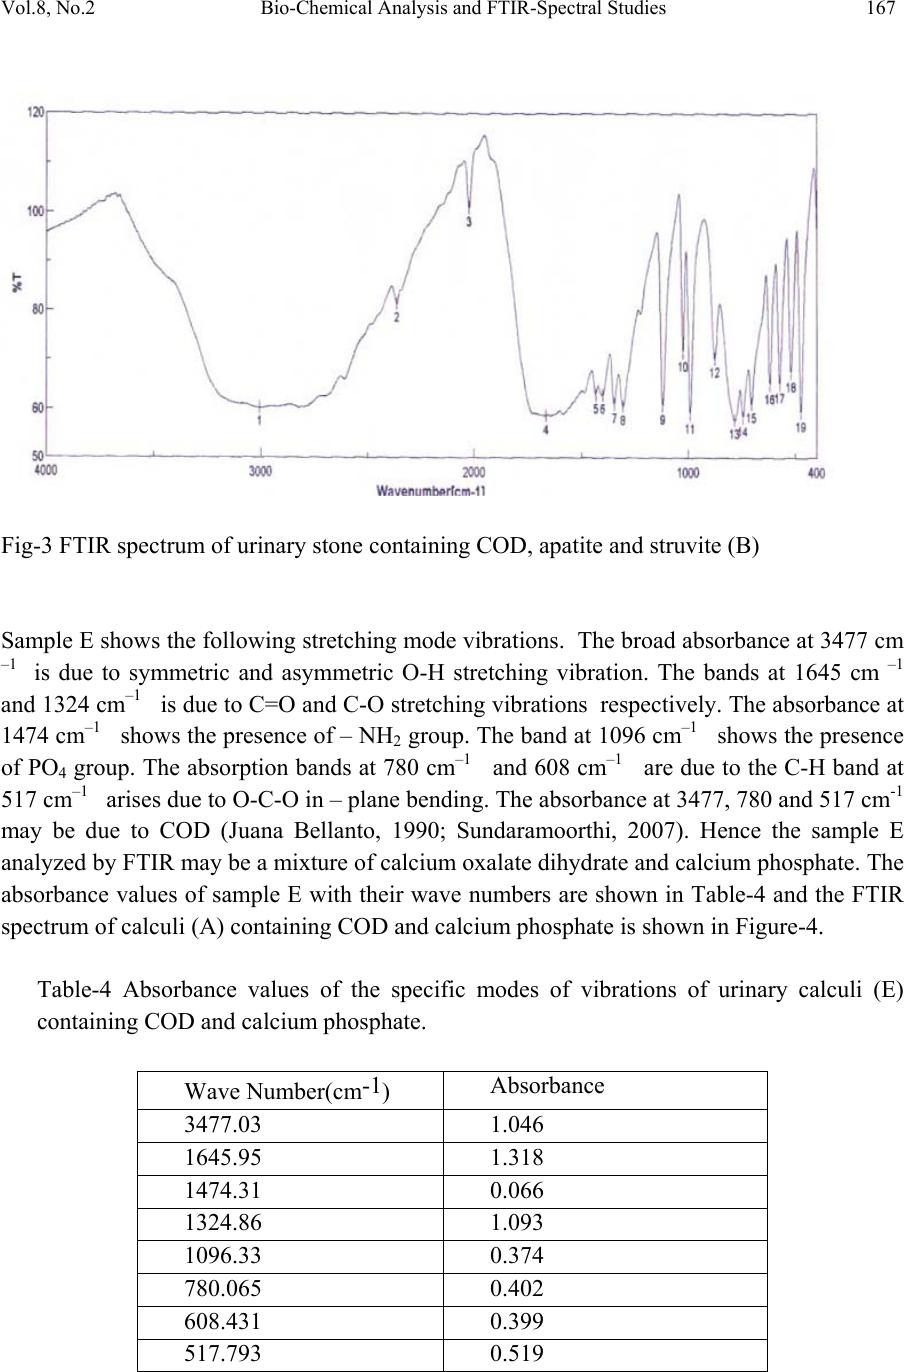 Vol.8, No.2 Bio-Chemical Analysis and FTIR-Spectral Studies 167 Fig-3 FTIR spectrum of urinary stone containing COD, apatite and struvite (B) Sample E shows the following stretching mode vibrations. The broad absorbance at 3477 cm –1 is due to symmetric and asymmetric O-H stretching vibration. The bands at 1645 cm –1 and 1324 cm–1 is due to C=O and C-O stretching vibrations respectively. The absorbance at 1474 cm–1 shows the presence of – NH2 group. The band at 1096 cm–1 shows the presence of PO4 group. The absorption bands at 780 cm–1 and 608 cm–1 are due to the C-H band at 517 cm–1 arises due to O-C-O in – plane bending. The absorbance at 3477, 780 and 517 cm-1 may be due to COD (Juana Bellanto, 1990; Sundaramoorthi, 2007). Hence the sample E analyzed by FTIR may be a mixture of calcium oxalate dihydrate and calcium phosphate. The absorbance values of sample E with their wave numbers are shown in Table-4 and the FTIR spectrum of calculi (A) containing COD and calcium phosphate is shown in Figure-4. Table-4 Absorbance values of the specific modes of vibrations of urinary calculi (E) containing COD and calcium phosphate. Wave Number(cm-1) Absorbance 3477.03 1.046 1645.95 1.318 1474.31 0.066 1324.86 1.093 1096.33 0.374 780.065 0.402 608.431 0.399 517.793 0.519 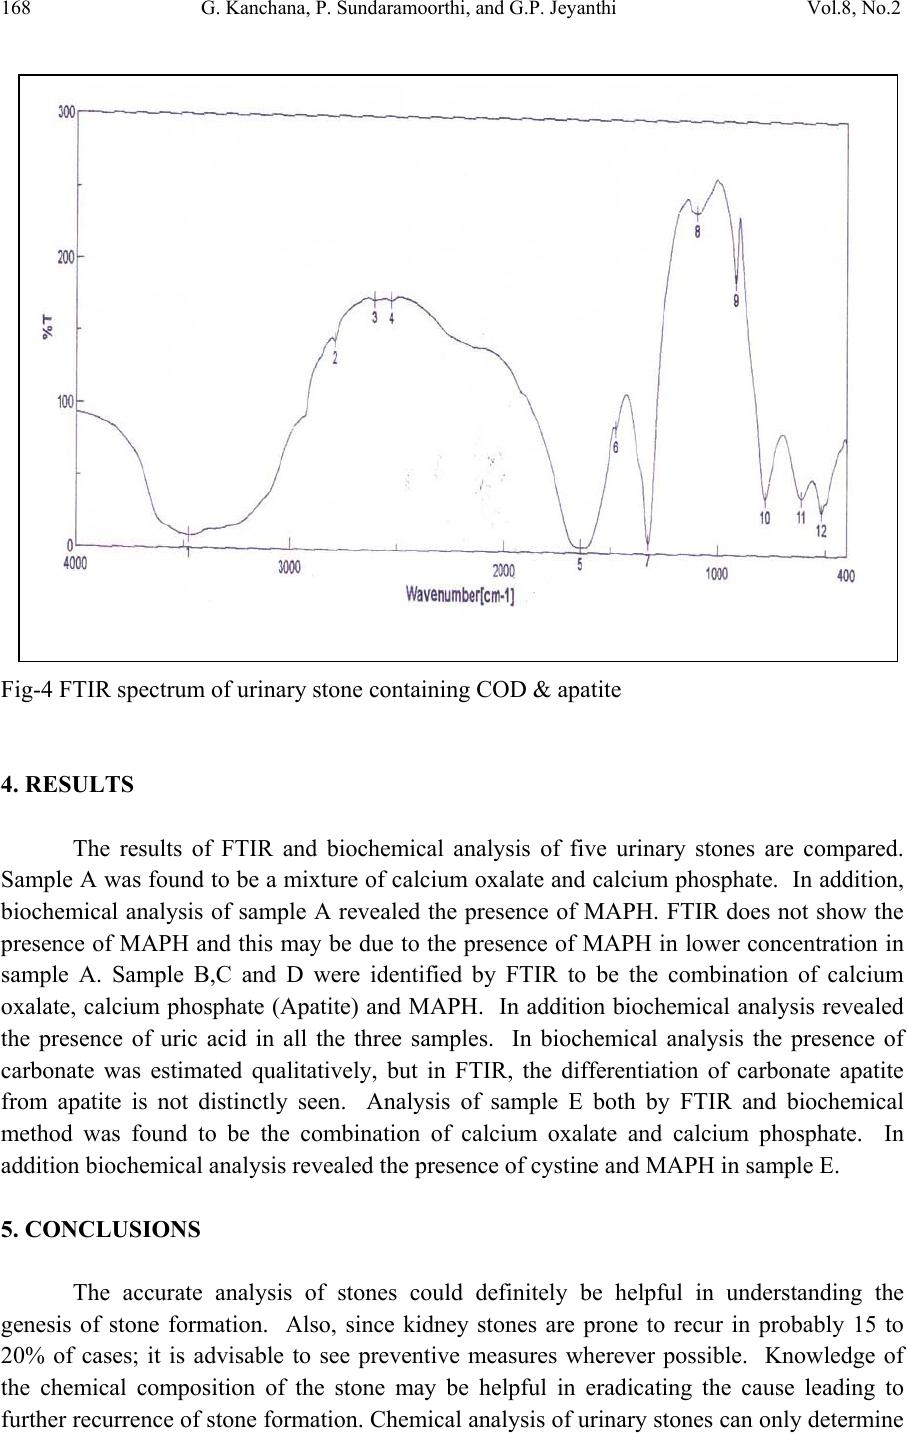 168 G. Kanchana, P. Sundaramoorthi, and G.P. Jeyanthi Vol.8, No.2 Fig-4 FTIR spectrum of urinary stone containing COD & apatite 4. RESULTS The results of FTIR and biochemical analysis of five urinary stones are compared. Sample A was found to be a mixture of calcium oxalate and calcium phosphate. In addition, biochemical analysis of sample A revealed the presence of MAPH. FTIR does not show the presence of MAPH and this may be due to the presence of MAPH in lower concentration in sample A. Sample B,C and D were identified by FTIR to be the combination of calcium oxalate, calcium phosphate (Apatite) and MAPH. In addition biochemical analysis revealed the presence of uric acid in all the three samples. In biochemical analysis the presence of carbonate was estimated qualitatively, but in FTIR, the differentiation of carbonate apatite from apatite is not distinctly seen. Analysis of sample E both by FTIR and biochemical method was found to be the combination of calcium oxalate and calcium phosphate. In addition biochemical analysis revealed the presence of cystine and MAPH in sample E. 5. CONCLUSIONS The accurate analysis of stones could definitely be helpful in understanding the genesis of stone formation. Also, since kidney stones are prone to recur in probably 15 to 20% of cases; it is advisable to see preventive measures wherever possible. Knowledge of the chemical composition of the stone may be helpful in eradicating the cause leading to further recurrence of stone formation. Chemical analysis of urinary stones can only determine  Vol.8, No.2 Bio-Chemical Analysis and FTIR-Spectral Studies 169 the ions of salts and from that the chemical composition of the salt is derived. The different degree of hydration cannot be determined by chemical method. Chemical methods also cannot resolve similar crystalline entities, e.g,. Whewellite Vs Weddellite, Apatite Vs Brushite, etc. Physical methods of analysis provide results on the actual salts including their degree of hydration when exists. The differentiation of calcium oxalate from COM is possible by FTIR technique which was not possible with biochemical analysis. FTIR is useful in identifying both the crystalline and amorphous nature of a stone even with a small amount of sample. The presence of apatite as carbonate apatite was noted in a mixture of apatite and struvite stones. In those cases qualitative chemical analysis is sufficient to confirm the presence of carbonate in apatite stones. In conclusion, at least two complementary techniques can be combined to obtain enough information on the morphology as well as on the molecular and crystalline composition of stones. REFERENCES Mandel N. (1986), ‘Urinary tract calculi’, Lab. Med., Vol.17, pp.449-458. Mitcheson H.D., Zamenhof R.G., Bankoff M.S. and Prien E.L. (1983), ‘Determination of the chemical composition of urinary calculi by computerized tomography’, J. Urol., Vol.130, pp.814-819. Sutor D.J. and Scheidt S. (1968), ‘Identification standards for human urinary calculus components using crystallographic methods’, Br. J. Urol., Vol.40, pp22-28. Alexander Randall, (1942), ‘Analysis of urinary calculi through the use of the polarizing microscope,’ J.Urol., Vol.48, pp.642-649. Hesse A. and Bach D., (1982), ‘Stone analysis by infrared spectroscopy’. In. Urinary Stones: Clinical and Laboratory Aspects, Ed. Alan Rose G., University Park Press, Baltimore, pp.165-171. Berthelot M., Cornu G., Daudon M., Helbert M. and Laurence C. (1987), ‘Computer- aided infrared analysis of urinary calculi,’ Cli n. Ch em., Vol.33, pp.2070-2073. Leemann C.A., McClure G.L.and Smdens I. (1988), ‘Identification of renal calculi by computerized infrared spectroscopy’, Clin. Chem. Acta., Vol.173, pp.107-116. Venkata Ramana Kodati, Tomasi G.E., Turumin J.L. and Anthony T.Tu (1990), ‘Raman spectroscopic identification of calium oxalate type kidney stone’, Applied Spectroscopy, Vol.44, pp.1408-1411. Alan Rose G. and Woodfine C., (1976) ‘The Thermogravimetric analysis of renal stones(in clinical practice)’ Br.J.Urol., Vol.48, pp.403-412. Beeler M.F., Veith D.A., Morriss R.H., and Biskind G.R. (1964), ‘Analysis of Urinary Calculus, Comparision of Methods,’ Amer. J. Clin. Path., Vol.41, pp.553-560. Yean-Chin Tsay (1961), ‘Application of infrared spectroscopy to analysis of urinary calculi’, J. Urol., Vol.86, pp.838-854. Hesse A. and Siener R. (1997), ‘Current aspects of epidemiology and nutrition in urinary stone disease’, World J. Urol., Vol.15, pp.165-171  170 G. Kanchana, P. Sundaramoorthi, and G.P. Jeyanthi Vol.8, No.2 Juana Bellanto (1990), ‘Infrared spectroscopy of urinary calculi’. In. Renal Tract Stone: Metabolic Basis and Clinical Practise, Ed. Wickham J.E.A. and Colinbuck, A., Churchill Livingstone, Newyork, pp. 45-57. Sundaramoorthi.P, Kalainathan.S, (2007) Growth and characterizations studies of SMHP single crystal in silica gel medium and laser induced nucleation reduction process. J. Bio. Chem. Engg., 34 pp 244-249. Sundaramoorthi.P, Kalainathan.S, (2007) Growth and characterization of struvite crystals in silica gel medium and its nucleation reduction process. Asian J. Chem. 19 (4) pp 2783- 2791. Sundaramoorthi.P, Kalainathan.S, (2007) Characteristics studies of SHP crystals grown in silica gel medium. Asian J. Chem., 19 (5) pp 3739-3746
|