Paper Menu >>
Journal Menu >>
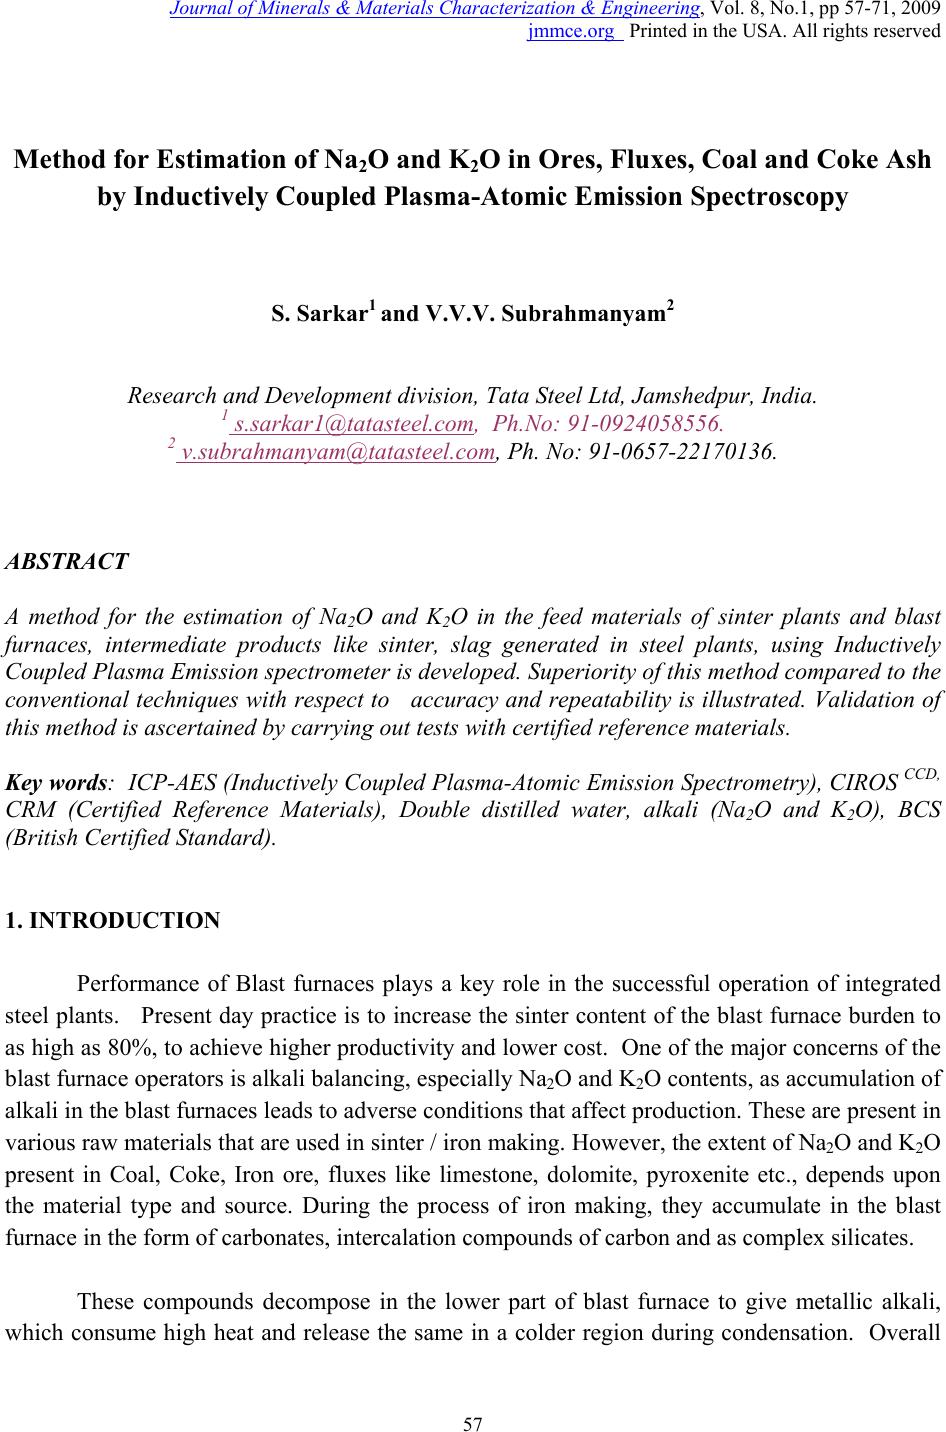 Journal of Minerals & Materials Characterization & Engineering, Vol. 8, No.1, pp 57-71, 2009 jmmce.org Printed in the USA. All rights reserved 57 Method for Estimation of Na2O and K2O in Ores, Fluxes, Coal and Coke Ash by Inductively Coupled Plasma-Atomic Emission Spectroscopy S. Sarkar1 and V.V.V. Subrahmanyam2 Research and Development division, Tata Steel Ltd, Jamshedpur, India. 1 s.sarkar1@tatasteel.com, Ph.No: 91-0924058556. 2 v.subrahmanyam@tatasteel.com, Ph. No: 91-0657-22170136. ABSTRACT A method for the estimation of Na2O and K2O in the feed materials of sinter plants and blast furnaces, intermediate products like sinter, slag generated in steel plants, using Inductively Coupled Plasma Emission spectrometer is developed. Superiority of this method compared to the conventional techniques with respect to accuracy and repeatability is illustrated. Validation of this method is ascertained by carrying out tests with certified reference materials. Key words: ICP-AES (Inductively Coupled Plasma-Atomic Emission Spectrometry), CIROS CCD, CRM (Certified Reference Materials), Double distilled water, alkali (Na2O and K2O), BCS (British Certified Standard). 1. INTRODUCTION Performance of Blast furnaces plays a key role in the successful operation of integrated steel plants. Present day practice is to increase the sinter content of the blast furnace burden to as high as 80%, to achieve higher productivity and lower cost. One of the major concerns of the blast furnace operators is alkali balancing, especially Na2O and K2O contents, as accumulation of alkali in the blast furnaces leads to adverse conditions that affect production. These are present in various raw materials that are used in sinter / iron making. However, the extent of Na2O and K2O present in Coal, Coke, Iron ore, fluxes like limestone, dolomite, pyroxenite etc., depends upon the material type and source. During the process of iron making, they accumulate in the blast furnace in the form of carbonates, intercalation compounds of carbon and as complex silicates. These compounds decompose in the lower part of blast furnace to give metallic alkali, which consume high heat and release the same in a colder region during condensation. Overall 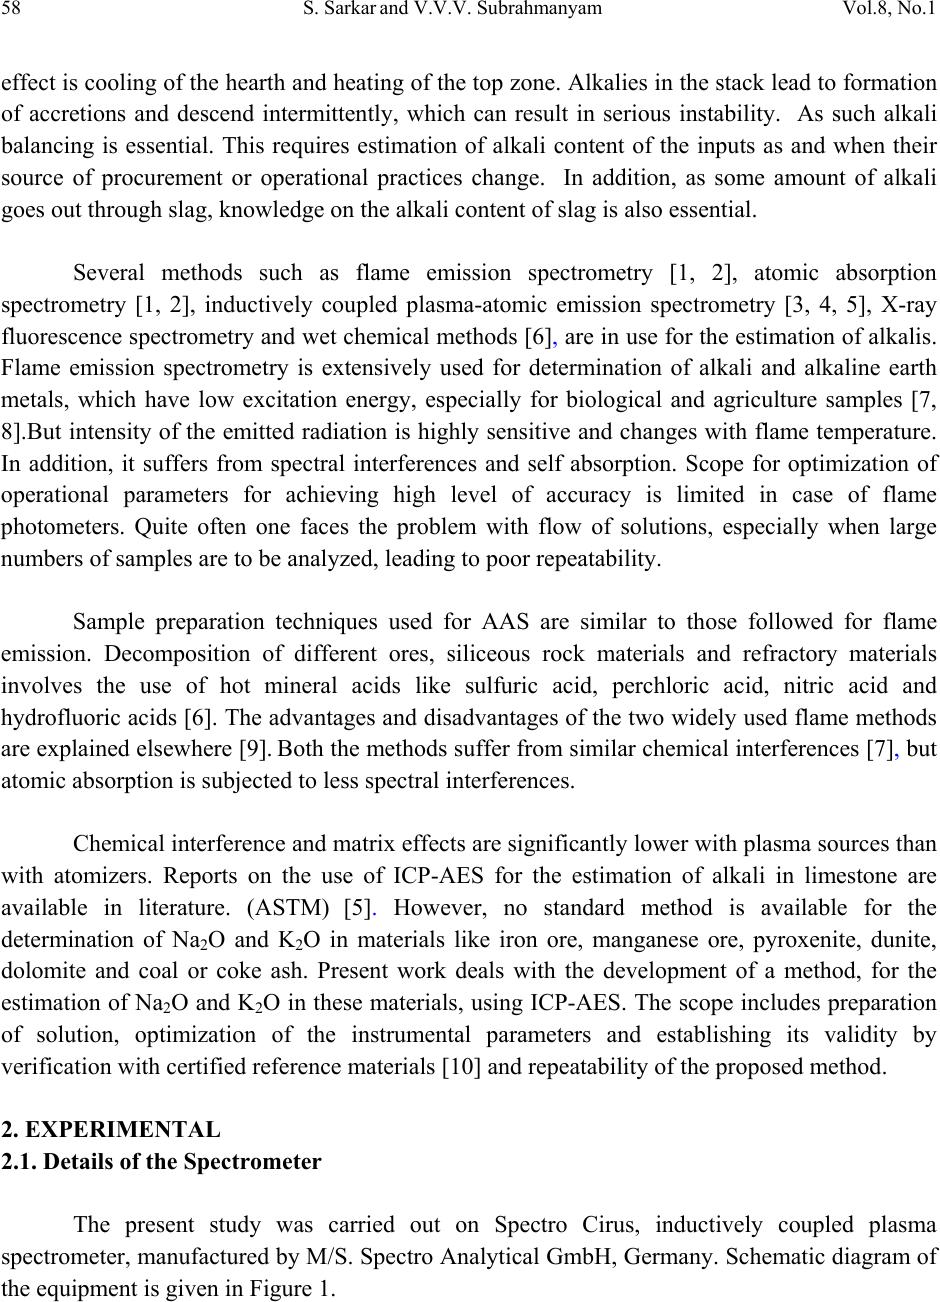 58 S. Sarkar and V.V.V. Subrahmanyam Vol.8, No.1 effect is cooling of the hearth and heating of the top zone. Alkalies in the stack lead to formation of accretions and descend intermittently, which can result in serious instability. As such alkali balancing is essential. This requires estimation of alkali content of the inputs as and when their source of procurement or operational practices change. In addition, as some amount of alkali goes out through slag, knowledge on the alkali content of slag is also essential. Several methods such as flame emission spectrometry [1, 2], atomic absorption spectrometry [1, 2], inductively coupled plasma-atomic emission spectrometry [3, 4, 5], X-ray fluorescence spectrometry and wet chemical methods [6], are in use for the estimation of alkalis. Flame emission spectrometry is extensively used for determination of alkali and alkaline earth metals, which have low excitation energy, especially for biological and agriculture samples [7, 8].But intensity of the emitted radiation is highly sensitive and changes with flame temperature. In addition, it suffers from spectral interferences and self absorption. Scope for optimization of operational parameters for achieving high level of accuracy is limited in case of flame photometers. Quite often one faces the problem with flow of solutions, especially when large numbers of samples are to be analyzed, leading to poor repeatability. Sample preparation techniques used for AAS are similar to those followed for flame emission. Decomposition of different ores, siliceous rock materials and refractory materials involves the use of hot mineral acids like sulfuric acid, perchloric acid, nitric acid and hydrofluoric acids [6]. The advantages and disadvantages of the two widely used flame methods are explained elsewhere [9]. Both the methods suffer from similar chemical interferences [7], but atomic absorption is subjected to less spectral interferences. Chemical interference and matrix effects are significantly lower with plasma sources than with atomizers. Reports on the use of ICP-AES for the estimation of alkali in limestone are available in literature. (ASTM) [5]. However, no standard method is available for the determination of Na2O and K2O in materials like iron ore, manganese ore, pyroxenite, dunite, dolomite and coal or coke ash. Present work deals with the development of a method, for the estimation of Na2O and K2O in these materials, using ICP-AES. The scope includes preparation of solution, optimization of the instrumental parameters and establishing its validity by verification with certified reference materials [10] and repeatability o f the proposed method. 2. EXPERIMENTAL 2.1. Details of the Spectrometer The present study was carried out on Spectro Cirus, inductively coupled plasma spectrometer, manufactured by M/S. Spectro Analytical GmbH, Germany. Schematic diagram of the equipment is given in Figure 1. 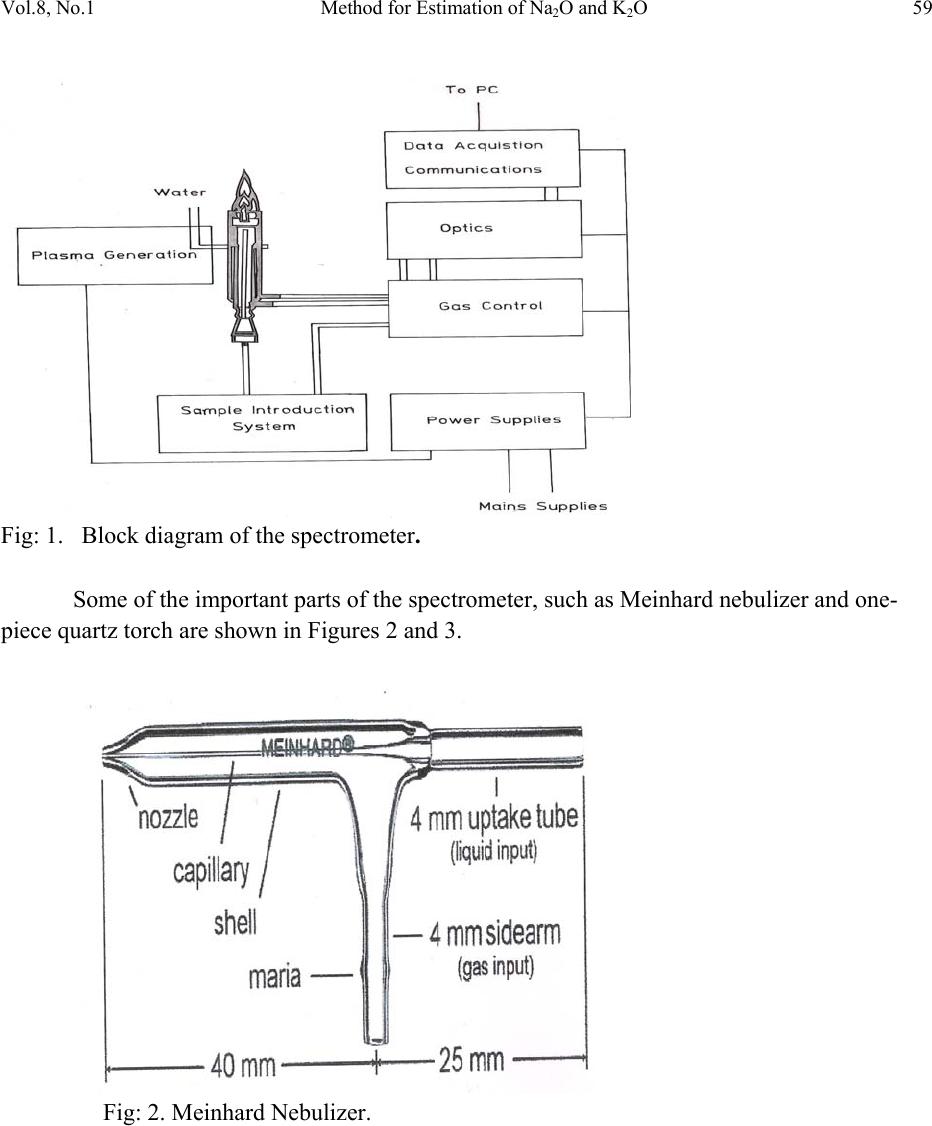 Vol.8, No.1 Method for Estimation of Na2O and K2O 59 Fig: 1. Block diagram of the spectrometer. Some of the important parts of the spectrometer, such as Meinhard nebulizer and one- piece quartz torch are shown in Figures 2 and 3. Fig: 2. Meinhard Nebulizer. 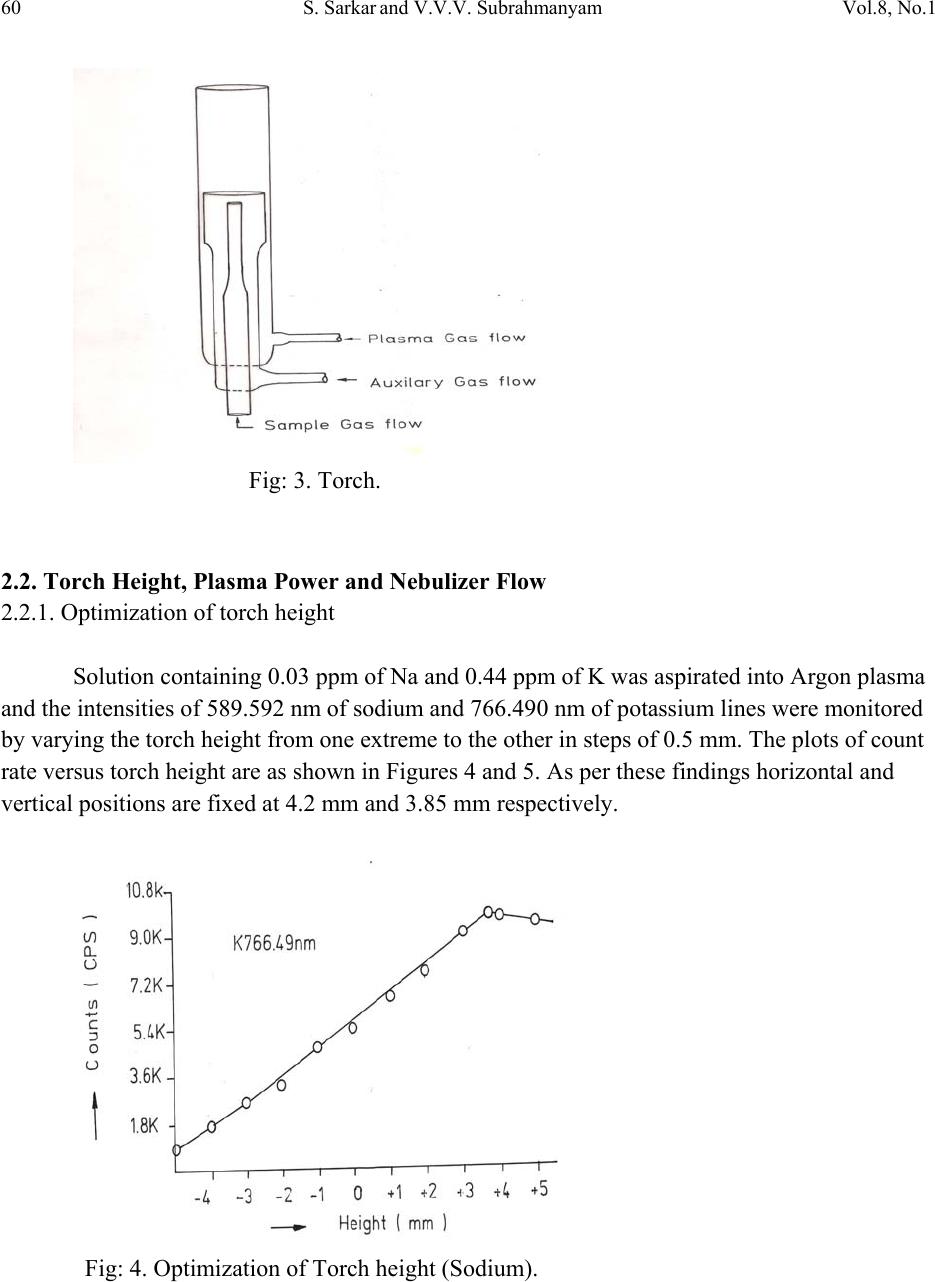 60 S. Sarkar and V.V.V. Subrahmanyam Vol.8, No.1 Fig: 3. Torch. 2.2. Torch Height, Plasma Power and Nebulizer Flow 2.2.1. Optimization of torch height Solution containing 0.03 ppm of Na and 0.44 ppm of K was aspirated into Argon plasma and the intensities of 589.592 nm of sodium and 766.490 nm of potassium lines were monitored by varying the torch height from one extreme to the other in steps of 0.5 mm. The plots of count rate versus torch he i g h t a re as shown in Figures 4 and 5. As per these findings horizontal and vertical positions are fixed at 4.2 mm and 3.85 mm respectively. Fig: 4. Optimization of Torch height (Sodium).  Vol.8, No.1 Method for Estimation of Na2O and K2O 61 Fig: 5. Optimization of Torch height (Potassium). 2.2.2. Optimization of plasma power Standard solution containing 0.16 ppm of Na and 2.16 ppm of K was aspirated into the plasma and the variation of count rate with respect to power is monitored to optimize the plasma power. It may be observed from Figures 6 and 7, that maximum count rate is obtained at 1200 Watts. Fig: 6. Count rate versus plasma power (Sodium).  62 S. Sarkar and V.V.V. Subrahmanyam Vol.8, No.1 Fig: 7. Count rate versus plasma power (Potassium). 2.2.3. Line selection For this purpose, four standard solutions covering the minimum and maximum concentrations were used. These solutions were aspirated into plasma one by one under the optimized conditions of torch position and power. In case of sodium four lines, viz 330.237, 330.298, 589.592 and 588.995 nm was monitored and the respective scans are shown in Figures 8, 9 and 10. Fig: 8.Wave length scans for Na (330.237 nm and 330.298 nm).  Vol.8, No.1 Method for Estimation of Na2O and K2O 63 Fig: 9.Wave length scans for Na (588.592 nm). Fig: 10.Wave length scans for Na (588.995 nm). It can be observed that the first two lines have problems of overlap, while third and fourth are free from overlaps. In addition, background signal in case of first two lines is significant and in fact it dominates the signal leading to erratic results with solution of low concentration. Hence, these were found to be unsuitable for quantitative analysis. Background in case of third and fourth lines was insignificant, almost zero even in case of the solution with low concentration.  64 S. Sarkar and V.V.V. Subrahmanyam Vol.8, No.1 In case of potassium, two lines viz., 404.721 and 766.490 nm were monitored and scans are given Figures 11 and 12. It can be observed that signal to background ratio is low in case of the first line (404.721nm), while it is quite high in case of second line (76 6.490 nm). Fig: 11. Wave length scans for K (404.721 nm). Fig: 12. Wave length scans for K (766.490 nm). Hence the lines 589.592 nm and 766.490 nm were selected for sodium and potassium respectively in the present study. 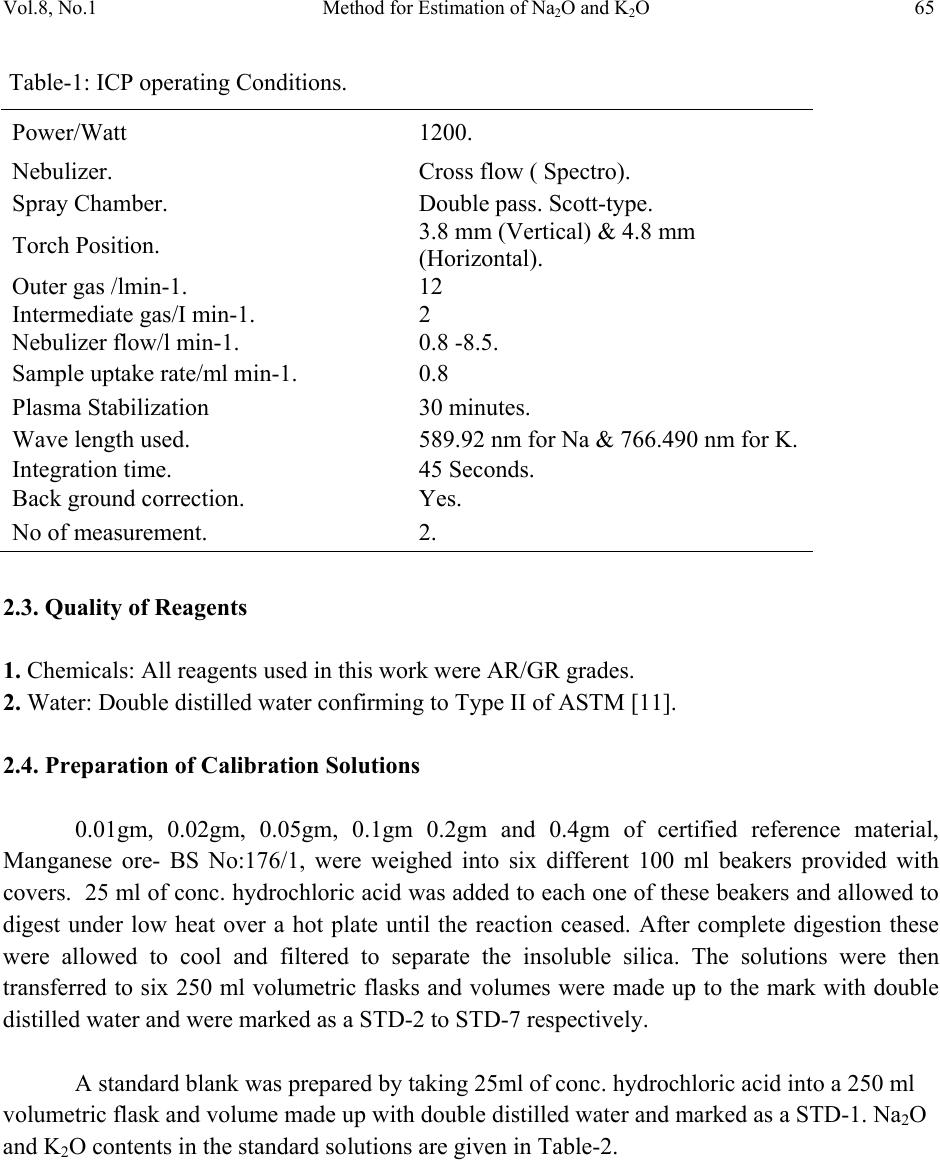 Vol.8, No.1 Method for Estimation of Na2O and K2O 65 Table-1: ICP operating Conditions. Power/Watt 1200. Nebulizer. Cross flow ( Spectro). Spray Chamber. Double pass. Scott-type. Torch Position. 3.8 mm (Vertical) & 4.8 mm (Horizontal). Outer gas /lmin-1. 12 Intermediate gas/I min-1. 2 Nebulizer flow/l min-1. 0.8 -8.5. Sample uptake rate/ml min-1. 0.8 Plasma Stabilization 30 minutes. Wave length used. 589.92 nm for Na & 766.490 nm for K. Integration time. 45 Seconds. Back ground correction. Yes. No of measurement. 2. 2.3. Quality of Reagents 1. Chemicals: All reagents used in this work were AR/GR grades. 2. Water: Double distilled water confirming to Type II of ASTM [11]. 2.4. Preparation of Calibration Solutions 0.01gm, 0.02gm, 0.05gm, 0.1gm 0.2gm and 0.4gm of certified reference material, Manganese ore- BS No:176/1, were weighed into six different 100 ml beakers provided with covers. 25 ml of conc. hydrochloric acid was added to each one of these beakers and allowed to digest under low heat over a hot plate until the reaction ceased. After complete digestion these were allowed to cool and filtered to separate the insoluble silica. The solutions were then transferred to six 250 ml volumetric flasks and volumes were made up to the mark with double distilled water and were marked as a STD-2 to STD-7 respectively. A standard blank was prepared by taking 25ml of conc. hydrochloric acid into a 250 ml volumetric flask and volume made up with double distilled water and marked as a STD-1. Na2O and K2O contents in the standard solutions are given in Table-2. 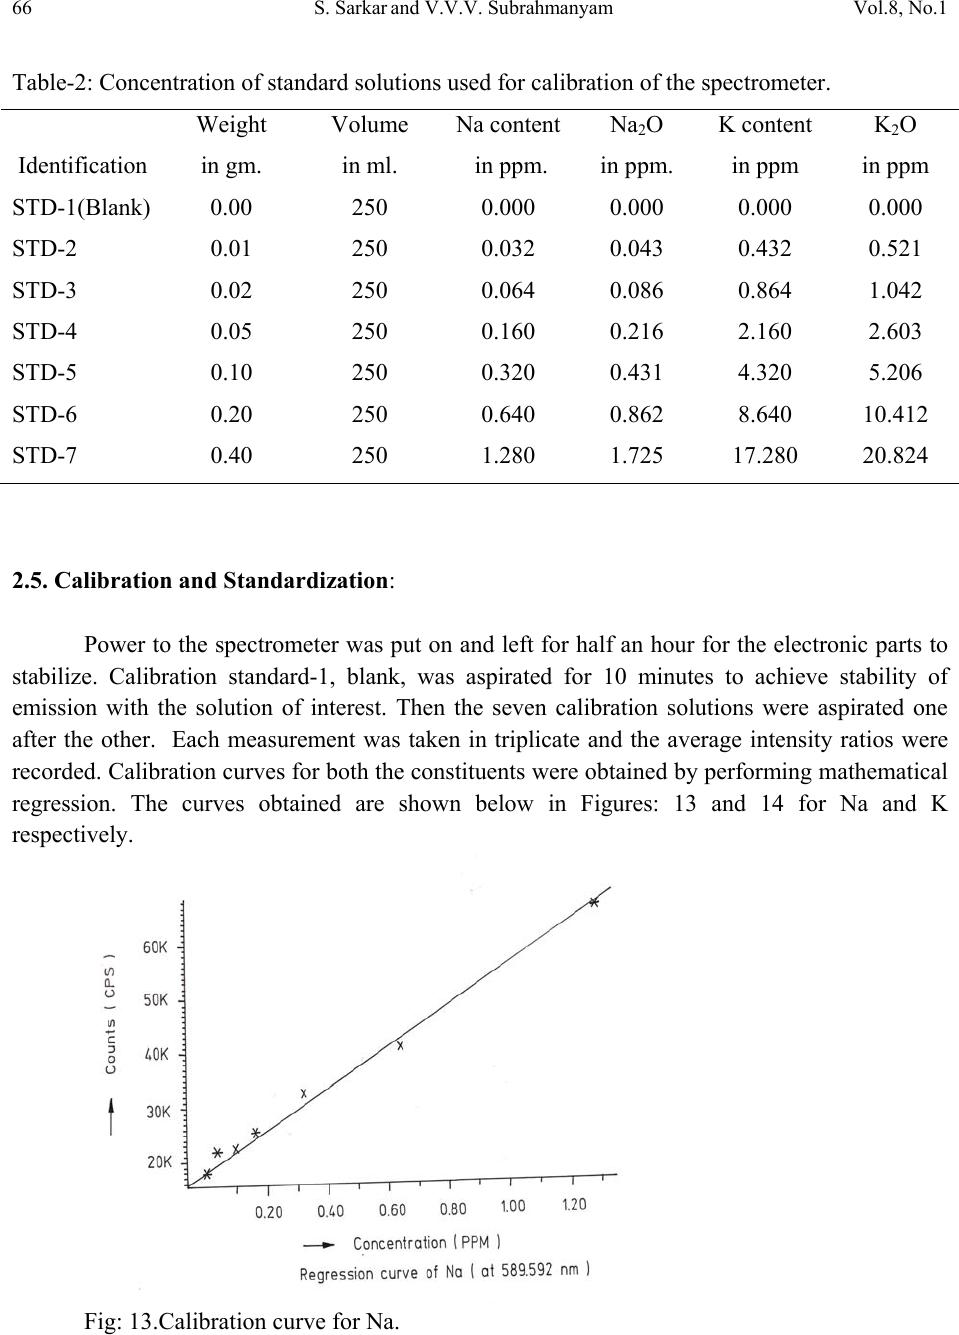 66 S. Sarkar and V.V.V. Subrahmanyam Vol.8, No.1 Table-2: Concentration of standard solutions used for calibration of the spectrometer. Identification Weight in gm. Volume in ml. Na content in ppm. Na2O in ppm. K content in ppm K2O in ppm STD-1(Blank) 0.00 250 0.000 0.000 0.000 0.000 STD-2 0.01 250 0.032 0.043 0.432 0.521 STD-3 0.02 250 0.064 0.086 0.864 1.042 STD-4 0.05 250 0.160 0.216 2.160 2.603 STD-5 0.10 250 0.320 0.431 4.320 5.206 STD-6 0.20 250 0.640 0.862 8.640 10.412 STD-7 0.40 250 1.280 1.725 17.280 20.824 2.5. Calibration and Standardization: Power to the spectrometer was put on and left for half an hour for the electronic parts to stabilize. Calibration standard-1, blank, was aspirated for 10 minutes to achieve stability of emission with the solution of interest. Then the seven calibration solutions were aspirated one after the other. Each measurement was taken in triplicate and the average intensity ratios were recorded. Calibration curves for both the constituents were obtained by performing mathematical regression. The curves obtained are shown below in Figures: 13 and 14 for Na and K respectively. Fig: 13.Calibration curve for Na. 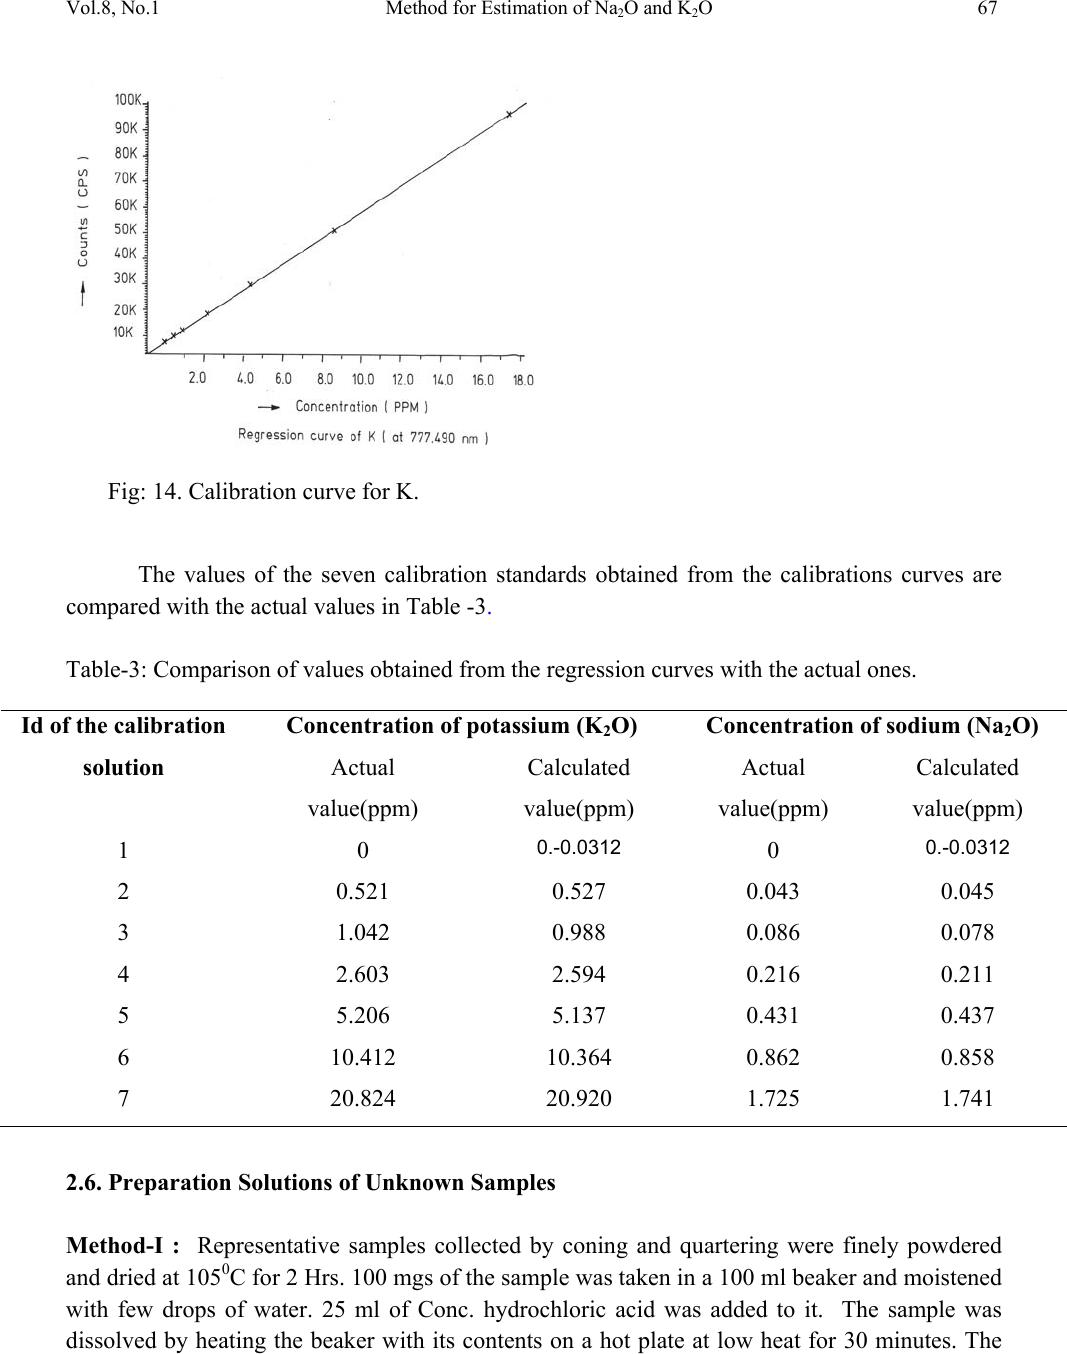 Vol.8, No.1 Method for Estimation of Na2O and K2O 67 Fig: 14. Calibration curve for K. The values of the seven calibration standards obtained from the calibrations curves are compared with the actual values in Table -3. Table-3: Comparison of values obtained from the regression curves with the actual ones. 2.6. Preparation Solutions of Unknown Samples Method-I : Representative samples collected by coning and quartering were finely powdered and dried at 1050C for 2 Hrs. 100 mgs of the sample was taken in a 100 ml beaker and moistened with few drops of water. 25 ml of Conc. hydrochloric acid was added to it. The sample was dissolved by heating the beaker with its contents on a hot plate at low heat for 30 minutes. The Id of the calibration solution Concentration of potassium (K2O) Concentration of sodium (Na2O) Actual value(ppm) Calculated value(ppm) Actual value(ppm) Calculated value(ppm) 1 0 0.-0.0312 0 0.-0.0312 2 0.521 0.527 0.043 0.045 3 1.042 0.988 0.086 0.078 4 2.603 2.594 0.216 0.211 5 5.206 5.137 0.431 0.437 6 10.412 10.364 0.862 0.858 7 20.824 20.920 1.725 1.741 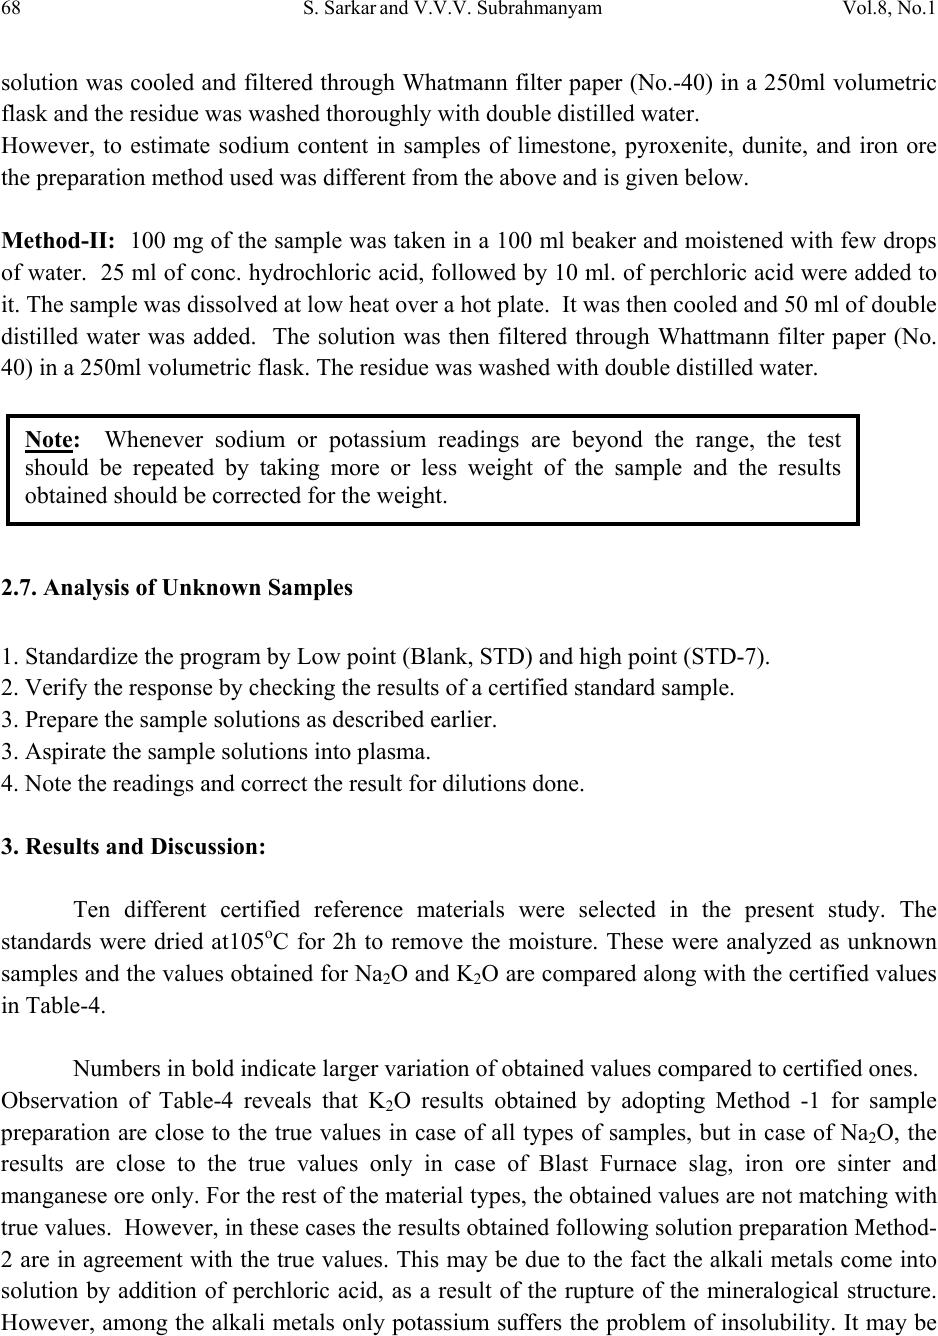 68 S. Sarkar and V.V.V. Subrahmanyam Vol.8, No.1 solution was cooled and filtered through Whatmann filter paper (No.-40) in a 250ml volumetric flask and the residue was washed thoroughly with double distilled water. However, to estimate sodium content in samples of limestone, pyroxenite, dunite, and iron ore the preparation method used was different from the above and is given below. Method-II: 100 mg of the sample was taken in a 100 ml beaker and moistened with few drops of water. 25 ml of conc. hydrochloric acid, followed by 10 ml. of perchloric acid were added to it. The sample was dissolved at low heat over a hot plate. It was then cooled and 50 ml of double distilled water was added. The solution was then filtered through Whattmann filter paper (No. 40) in a 250ml volumetric flask. The residue was washed with double distilled water. 2.7. Analysis of Unknown Samples 1. Standardize the program by Low point (Blank, STD) and high point (STD-7). 2. Verify the response by checking the results of a certified standard sample. 3. Prepare the sampl e so luti ons as described earlier. 3. Aspirate the sample solutions into plasma. 4. Note the readings a nd correct the result for dilutions done. 3. Results and Discussion: Ten different certified reference materials were selected in the present study. The standards were dried at105oC for 2h to remove the moisture. These were analyzed as unknown samples and the values obtained for Na2O and K2O are compared along with the certified values in Table-4. Numbers in bold indicate larger variation of obtained values compared to certified ones. Observation of Table-4 reveals that K2O results obtained by adopting Method -1 for sample preparation are close to the true values in case of all types of samples, but in case of Na2O, the results are close to the true values only in case of Blast Furnace slag, iron ore sinter and manganese ore only. For the rest of the material types, the obtained values are not matching with true values. However, in these cases the results obtained following solution preparation Method- 2 are in agreement with the true values. This may be due to the fact the alkali metals come into solution by addition of perchloric acid, as a result of the rupture of the mineralogical structure. However, among the alkali metals only potassium suffers the problem of insolubility. It may be Note: Whenever sodium or potassium readings are beyond the range, the test should be repeated by taking more or less weight of the sample and the results obtained should be corrected for the weight. 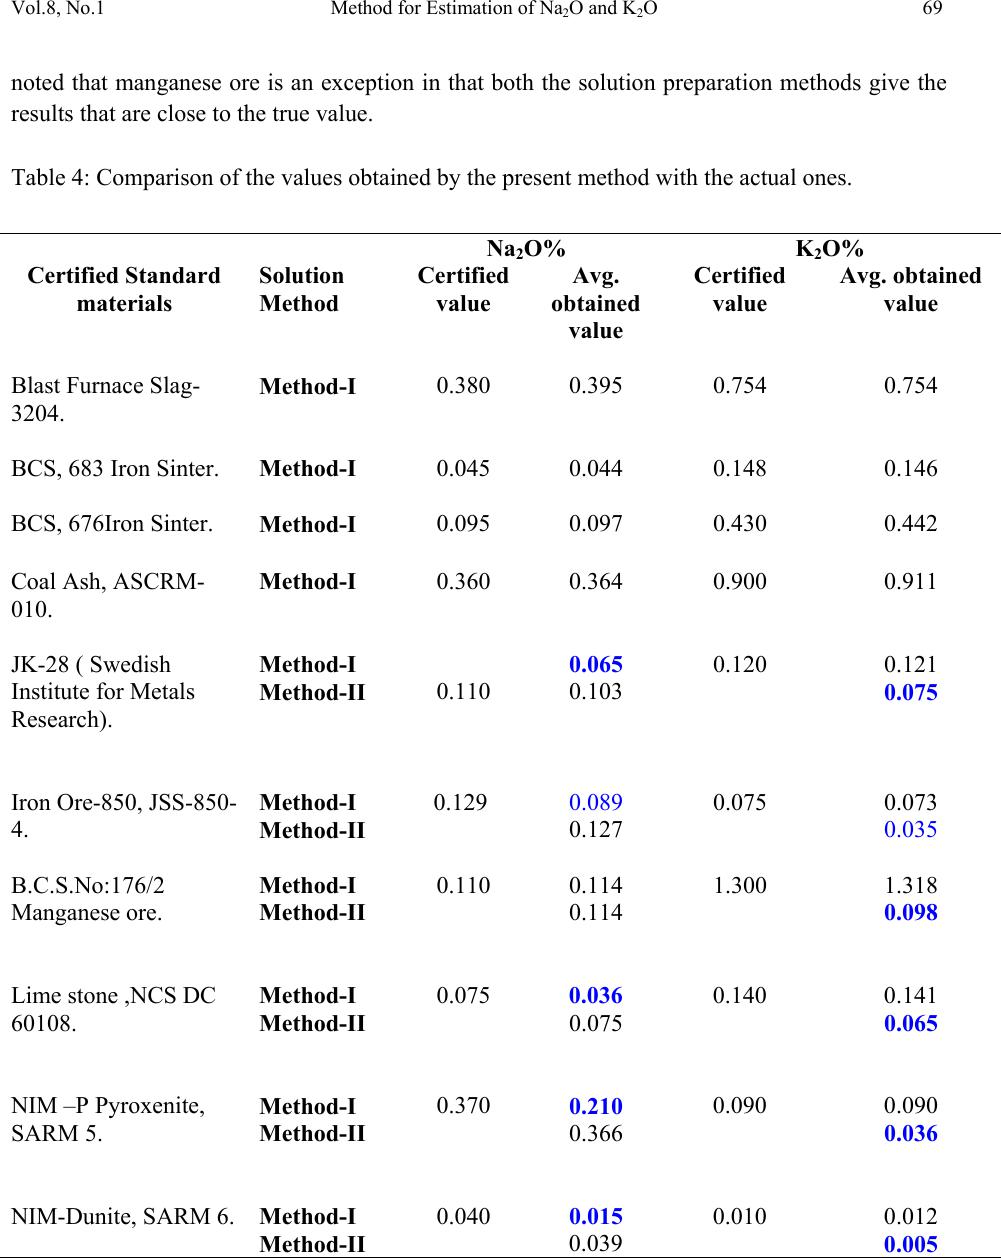 Vol.8, No.1 Method for Estimation of Na2O and K2O 69 noted that manganese ore is an exception in that both the solution preparation methods give the results that are close to the true value. Table 4: Comparison of the values obtained by the present method with the actual ones. Certified Standard materials Solution Method Na2O% K2O% Certified value Avg. obtained value Certified value Avg. obtained value Blast Furnace Slag- 3204. Method-I 0.380 0.395 0.754 0.754 BCS, 683 Iron Sinter. Method-I 0.045 0.044 0.148 0.146 BCS, 676Iron Sinter. Method-I 0.095 0.097 0.430 0.442 Coal Ash, ASCRM- 010. Method-I 0.360 0.364 0.900 0.911 JK-28 ( Swedish Institute for Metals Research). Method-I 0.110 0.065 0.120 0.121 Method-II 0.103 0.075 Iron Ore-850, JSS-850- 4. Method-I 0.129 0.089 0.075 0.073 Method-II 0.127 0.035 B.C.S.No:176/2 Manganese ore. Method-I 0.110 0.114 1.300 1.318 Method-II 0.114 0.098 Lime stone ,NCS DC 60108. Method-I 0.075 0.036 0.140 0.141 Method-II 0.075 0.065 NIM –P Pyroxenite, SARM 5. Method-I 0.370 0.210 0.090 0.090 Method-II 0.366 0.036 NIM-Dunite, SARM 6. Method-I 0.040 0.015 0.010 0.012 Method-II 0.039 0.005 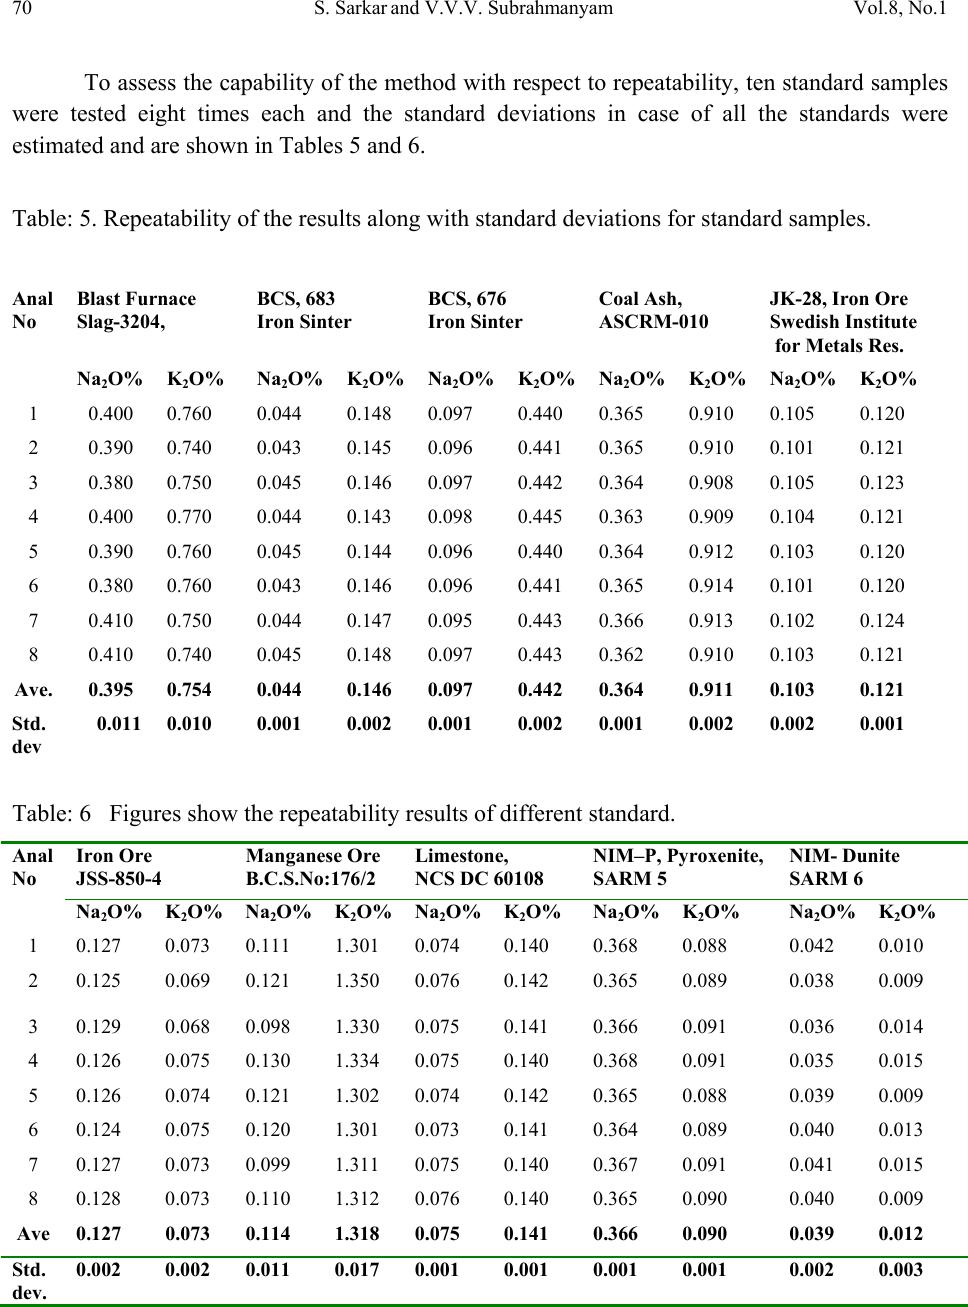 70 S. Sarkar and V.V.V. Subrahmanyam Vol.8, No.1 To assess the capability of the method with respect to repeatability, ten standard samples were tested eight times each and the standard deviations in case of all the standards were estimated and are shown in Tables 5 and 6. Table: 5. Repeatability of the results along with standard deviations for standard samples. Anal No Blast Furnace Slag-3204, BCS, 683 Iron Sinter BCS, 676 Iron Sinter Coal Ash, ASCRM-010 JK-28, Iron Ore Swedish Institute for Metals Res. Na2O% K2O% Na2O% K2O% Na2O% K2O% Na2O% K2O% Na2O% K2O% 1 0.400 0.760 0.044 0.148 0.097 0.440 0.365 0.910 0.105 0.120 2 0.390 0.740 0.043 0.145 0.096 0.441 0.365 0.910 0.101 0.121 3 0.380 0.750 0.045 0.146 0.097 0.442 0.364 0.908 0.105 0.123 4 0.400 0.770 0.044 0.143 0.098 0.445 0.363 0.909 0.104 0.121 5 0.390 0.760 0.045 0.144 0.096 0.440 0.364 0.912 0.103 0.120 6 0.380 0.760 0.043 0.146 0.096 0.441 0.365 0.914 0.101 0.120 7 0.410 0.750 0.044 0.147 0.095 0.443 0.366 0.913 0.102 0.124 8 0.410 0.740 0.045 0.148 0.097 0.443 0.362 0.910 0.103 0.121 Ave. 0.395 0.754 0.044 0.146 0.097 0.442 0.364 0.911 0.103 0.121 Std. dev 0.011 0.010 0.001 0.002 0.001 0.002 0.001 0.002 0.002 0.001 Table: 6 Figures show the repeatability results of different standard. Anal No Iron Ore JSS-850-4 Manganese Ore B.C.S.No:176/2 Limestone, NCS DC 60108 NIM–P, Pyroxenite, SARM 5 NIM- Dunite SARM 6 Na2O% K2O% Na2O% K2O% Na2O% K2O% Na2O% K2O% Na2O% K2O% 1 0.127 0.073 0.111 1.301 0.074 0.140 0.368 0.088 0.042 0.010 2 0.125 0.069 0.121 1.350 0.076 0.142 0.365 0.089 0.038 0.009 3 0.129 0.068 0.098 1.330 0.075 0.141 0.366 0.091 0.036 0.014 4 0.126 0.075 0.130 1.334 0.075 0.140 0.368 0.091 0.035 0.015 5 0.126 0.074 0.121 1.302 0.074 0.142 0.365 0.088 0.039 0.009 6 0.124 0.075 0.120 1.301 0.073 0.141 0.364 0.089 0.040 0.013 7 0.127 0.073 0.099 1.311 0.075 0.140 0.367 0.091 0.041 0.015 8 0.128 0.073 0.110 1.312 0.076 0.140 0.365 0.090 0.040 0.009 Ave 0.127 0.073 0.114 1.318 0.075 0.141 0.366 0.090 0.039 0.012 Std. dev. 0.002 0.002 0.011 0.017 0.001 0.001 0.001 0.001 0.002 0.003  Vol.8, No.1 Method for Estimation of Na2O and K2O 71 4. CONCLUSION A faster determination of Na2O and K2O in selected materials is proposed. The results from the ICP-AES analysis are found to be in good correlation with those of standard certified materials. From the experiments we concluded that optimal condition of ICP-AES and solution preparation combination giving the best result in various materials. These conditions yielded very appealing results, giving Na2O value from 0.04 % to 0.4%. Acknowledgement The authors would like to express their sincere thanks to the management of Tata Steel for the constant encouragement given during the progress of this work and permitting to publish the same. References 1. A.I. Vogel, Test book of quantitative Analysis Chapter XXII. 2. J.A. Dean and T.C. Rains, Flame Emission and Atomic Spectroscopy, Vol.1, 2, 3, Eds., Marcel Decker: New York: 1969-75. 3. American Standards f o r T esting Materials E863, Vol.03.06. 4. ASTM E1479 and Annual books of ASTM STD vol.03.06. 5. Standard test method for major and trace elements in limestone and lime by ICP-AES and AAS by ASTM Proc. C1301-95. 6. N. Howell Furman, Standard of Chemical Analysis. Chapter 1, Vol.1.and reference their in. 7. Douglas A Skoog, Principal of Instrumental analysis (3rd Edition), Saunders College Publications Chapter 9 (1983). 8. F.W. Fifield and D. Kealey, Principals and Practice of Analytical Chemistry, (3rd Edition), Chapter8, page 293. 9. E.E. Pickett and S.R. Koirtyohann, Anal. Chem. 1969 41(14) 28A. 10. Certified materials, B.C.S. No: 176/2 (Manganese Ore), Blast Furnace Slag-3204, Iron Ore - 850, JSS850-4, JK-28 (Swedish institute for metals), Limestone, NCS DC 6018, Coal Ash, ASCRM010 and NIM-P Pyroxenite. 11. ASTM “Standard Specification of Reagent Water” D1193-06. |