Paper Menu >>
Journal Menu >>
 Journal of Minerals & Materials Characterization & Engineering, Vol. 7, No.1, pp 83-95, 2007 jmmce.org Printed in the USA. All rights reserved 83 Investigation of Dissolution Kinetics of A Nigerian Tantalite Ore in Nitric Acid A. A. Baba* 1 , F. A. Adekola 1 , O. I. Dele-Ige 1 and R. B. Bale 2 1 Department of Chemistry, University of Ilorin, P. M. B. 1515, Ilorin Nigeria. *Corresponding author: (e-mail):baalafara@yahoo.com Tel: +2348035010302) 2 Department of Geology, University of Ilorin, P.M.B.1515 Ilorin-Nigeria ABSTRACT A study of the kinetics of the dissolution of a Nigerian tantalite ore in Nitric acid has been examined. A detailed investigation on the quantitative leaching of the mineral was also carried out. The effects of some parameters such as acid concentration, contact time, temperature, particle size and the stirring rate on dissolution action have been investigated. Experimental results indicate that the dissolution rate is diffusion controlled via hydrogen ion [H + ] action, with reaction order of 0.64. About 81.3% of tantalite ore was dissolved within 120min., using 8.06M HNO 3 solution with <0.040mm particle size. Activation energy, Ea, of 22.37kJ/mole was obtained for the process. However, elemental analysis by inductively coupled-plasma mass spectrophotometry showed that the major elements in the ore are Ta(39.9%), Fe(24.9%), Ti(4.03%), S(12.4%) and Mn(2.39%). The x-ray diffractometry also confirmed the ore to exist in a single phase with tantalite characteristics peaks at 3.31A 0 , 2.55A 0 and 1.74A 0 . The ore is not radioactive by its virtue of its very low thorium and uranium contents. 1.0 INTRODUCTION The principal source of tantalite or tantalum is an isomorphous series of minerals that contain columbium (niobium), iron, manganese and tantalum oxides. Tantalum and columbium have strong geochemical affinity and are found together in most rocks and minerals in which they occur. Tantalite-columbite, which is the major source for tantalum, occurs mainly as accessory minerals disseminated in granitic rocks or in pegmatite associated with granites. The proper name for the mineral is tantalite when tantalum predominates over columbium. When the reverse is true, the proper name is columbite [1]. Economic mineral concentrations occur where as in Nigeria or South-east Asia, weathering has led to residual or placer deposits or where, as in Bernic Lake deposit in  84 A.A. Baba, F.A. Adekola, O.I. Dele-Ige and R.B. Bale Vol.7, No.1 Canada, the pegmatites contain a high concentration of these minerals. The minerals consist essentially of complex oxides of calcium, columbium, sodium and tantalum in combination with hydroxyl ions and fluoride(s). Microlite may contain as much as 70% tantalum oxide and pyrochlore generally contains less than 10% tantalum oxide. Macrolite occurs mainly in the albitized zones of granite pegmatites, often associated with tantalite or columbite. Struverite, which is a titanium-bearing oxide, is a low-grade source of tantalum that is recovered from tin-mining wastes in South-east Asia. Struverite typically contains about 12% each of tantalum and columbium oxides [2]. The United States which has no tantalum mining industry, must import all its tantalum source materials for processing. Tantalum mineral production comes mostly from tantalite and columbite mining operations in Australia, Brazil and Canada and from smaller mining operations in certain African countries including Nigeria [3]. Numerous occurrences of the speciality metals-columbite, tantalite, beryllium and lithium have been reported associated mainly with the anorogenic. Younger Granites of the Plateau and the pegmatites of the Older Granite suite especially in Central Africa. The economic viability of the occurrences of the mineral in Nigeria is in general not known because detailed exploration work has not been carried out. However, the occurrences at Udegi (Opaga Oto) and Angwan Doka, in (middle belt) of Nigeria were investigated under the Nigerian Mining Appraisal and Monetization Programme (NIMAMOP) [4]. Australia, which is the largest producer, accounts for about 25% of the World’s annual tantalum requirements. Tantalum is also obtained from low-and high-grade tantalum-bearing tin slags, which is a by-product from tin smelting, principality from Australia, Brazil and Asia. Low-grade tin slags, however, might first be treated by a pyrometallurgical technique to upgrade them to a synthetic concentrate before delivery [5]. Consequently, tantalite is the most important mineral form of tantalum, a speciality widely used in the production of electronic components, mainly in tantalum capacitors, super conductors, super alloys, aerospatial and nuclear among others [6, 7]. This work is prompted by the fact that this is very limited work in the aqueous chemistry and physico-chemical properties of tantalite ore found in Nigeria. The only one is our work on the hydrochloric acid leaching, Baba et. al [8]. The results obtained indicate that the dissolution reaction is topochemical and is greatly influenced by hydrogen ion [H + ] concentration. However, most of the reported works are in the areas of tantalite beneficiation, geochemistry and phase characterizations [6,9-11]. Nevertheless, many researchers have reported several findings in terms of chemical nature, aiming at extracting tantalum in different media. These among others include: analysis of tantalum loaded tributyl phosphate for the content of major, minor and trace elements using microwave decomposition and ICP-OES [12].  Vol.7, No.1 Investigation of Dissolution Kinetics of A Nigerian Tantalite Ore 85 Various chemical treatments and techniques have been developed for niobium and tantalum extraction from ores, which include reduction, chlorination, alkaline fusion and acid dissolution [13 – 15]. The extraction of tantalum from tantalum source materials involves dissolution with hydrofluoric acid followed by liquid-liquid extraction with methyl isobutylketone (MIBK). This procedure efficiently recovers tantalum in a form that can be further processed into tantalum oxide and potassium fluotantalate. Potassium fluotantalate is reduced with metallic sodium to produce tantalum metal powder. The tantalum metal powder produced by the sodium reaction process is treated to covert the metal to a form suitable for use as capacitor-grade powder and as feed stock for tantalum wire and sheet. A solid state reaction between tantalum oxide and carbon under vacuum conditions produces tantalum carbide [1, 16]. Consequently, this study gives a detailed data on the use of the nitric acid for chemical leaching of a Nigerian tantalite ore. The dissolution kinetics of the ore is also evaluated. No reported works vis-à-vis, leaching a Nigerian tantalite ore with nitric acid is available. This work is inscribed within the programme being undertaken on the dissolution kinetics of tantalum in different aqueous media [8]. 2.0 EXPERIMENTAL 2.1 Material/Analysis The tantalite mineral used for this investigation was sourced from Oke-Onigbin field in Kwara State of Nigeria. The mineralogical purity of the ore was investigated using Philips PW 1800 X-ray diffractometer with CuK α (1.54A 0 ) radiation, generated at 40kV and 55mA. The inductively coupled plasma-mass spectrophotometry (ICP-MS) was used for the elemental analysis of the tantalite mineral. Analar grade HNO 3 acid was used in this research work and doubly distilled water was used in the preparation of all solutions. 2.2 Equipment and Methods The solution was investigated in a 500ml glass reactor equipped with a mechanical all-glass stirrer. The reactor was filled with 200ml of nitric acid solution which was heated to the desired temperature [24]. The leaching of tantalite mineral with HNO 3 at different concentrations was done as described previously [8]. The concentration of HNO 3 which gave the maximum dissolution (i.e.8.06M) was subsequently used for the optimization of other leaching parameters including temperature and particle size. Energy of activation and constants were evaluated from the Arrhenius plots.  86 A.A. Baba, F.A. Adekola, O.I. Dele-Ige and R.B. Bale Vol.7, No.1 3.0 RESULTS AND DISCUSSIONS 3.1 Mineralogical Studies 3.1.1 Elemental analysis by ICP-MS The ICP-MS results showed that Ta(39.9%) Fe(24.9%), Ti(4.03%), S(12.4%) and Mn(2.39%) formed the major elements in the ore. The minor elements include Ca, P, Mg, Al, Na, K, Nb, Zn, Pb, As, Sb, Ce, La and V. However, elements such as Mo, Cu, Ag, Co, U, Au, Th, Sr, Cd, Zr, Li, R, W, Y, Rb and Hf are recoded at trace levels [8]. 3.1.2 XRD analysis The ore chemical composition dominated by Ta, Fe, Ti, S and Mn indicated ore minerals constituent to be a mixture of Tantalite [(Ta, Nb)O 2 ], ilmenite (FeTiO 3 ) and pyrite (Fe,Mn)S. The Nb and Mn, by their respective affinity for Ta and Fe are probably incorporated into the tantalite and pyrite phases respectively. The ilmenite and pyrite informs on the reducing conditions of formation of the ore while the lanthanum value points to its lithosphere origin. The ore is not radioactive by virtue of its very low Thorium content [17-19]. This reason also suggests why some Ta/Nb minerals cannot be shipped out of the country, because of their levels of radioactivity. The limits of allowed uranium and thorium contents are 0.1% U 3 O 8 and 0.1% ThO 2 [29]. Figure 1 presents the X – ray diffraction spectrum with tantalite characteristics diffraction peaks at 3.31A 0 , 2.56A 0 and 1.74A 0. Fig 1. XRD showing the characteristics peaks of Tantalite 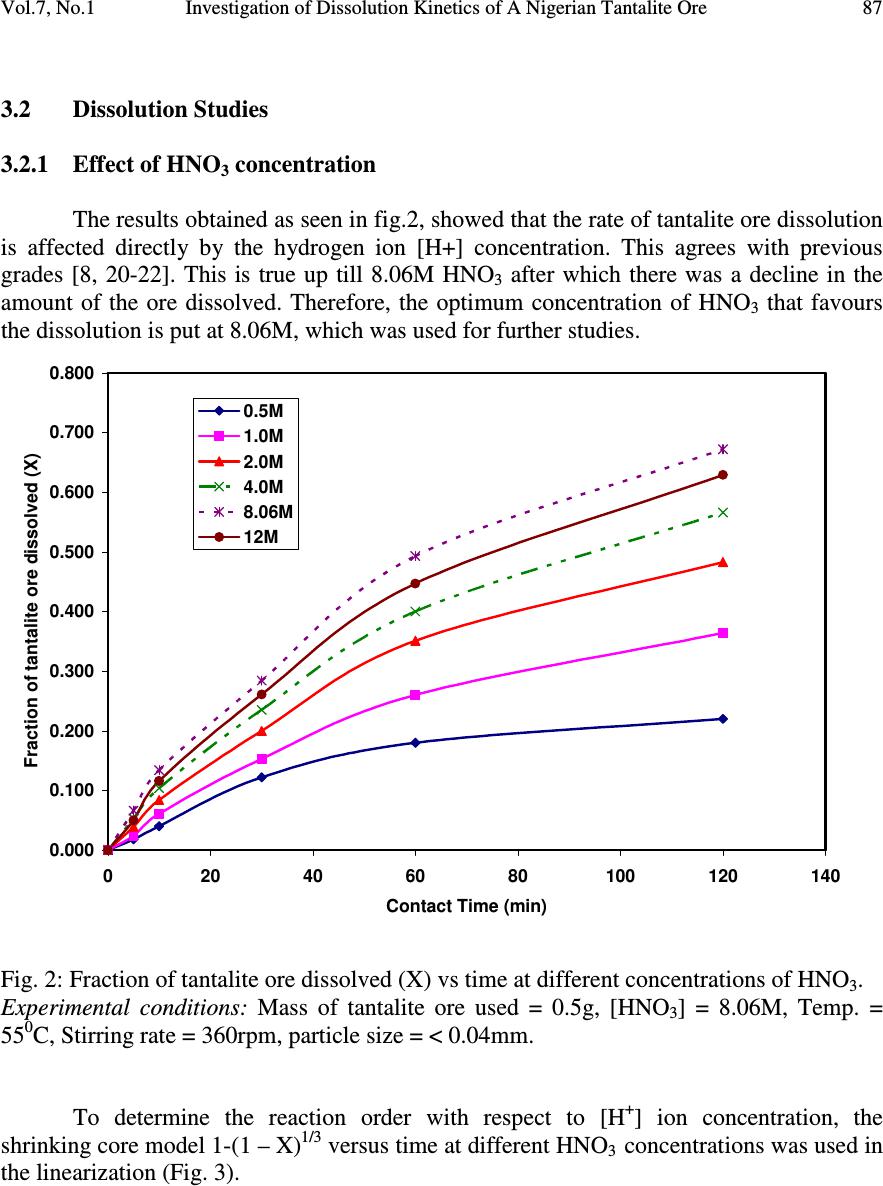 Vol.7, No.1 Investigation of Dissolution Kinetics of A Nigerian Tantalite Ore 87 3.2 Dissolution Studies 3.2.1 Effect of HNO 3 concentration The results obtained as seen in fig.2, showed that the rate of tantalite ore dissolution is affected directly by the hydrogen ion [H+] concentration. This agrees with previous grades [8, 20-22]. This is true up till 8.06M HNO 3 after which there was a decline in the amount of the ore dissolved. Therefore, the optimum concentration of HNO 3 that favours the dissolution is put at 8.06M, which was used for further studies. 0.000 0.100 0.200 0.300 0.400 0.500 0.600 0.700 0.800 020 40 60 80100120140 Contact Time (min) Fraction of tantalite ore dissolved (X) 0.5M 1.0M 2.0M 4.0M 8.06M 12M Fig. 2: Fraction of tantalite ore dissolved (X) vs time at different concentrations of HNO 3 . Experimental conditions: Mass of tantalite ore used = 0.5g, [HNO 3 ] = 8.06M, Temp. = 55 0 C, Stirring rate = 360rpm, particle size = < 0.04mm. To determine the reaction order with respect to [H + ] ion concentration, the shrinking core model 1-(1 – X) 1/3 versus time at different HNO 3 concentrations was used in the linearization (Fig. 3).  88 A.A. Baba, F.A. Adekola, O.I. Dele-Ige and R.B. Bale Vol.7, No.1 0.000 0.050 0.100 0.150 0.200 0.250 0.300 0.350 020406080100 120 140 Contact Time (min) 1-(1-X) 1/3 0.5M 1.0M 2.0M 4.0M 8.06M Fig. 3: Plot of 1-(1 – X) 1/3 vs. time at different [HNO 3 ]. From Fig. 3, the slope of each lines were calculated and recorded as apparent rate constants, k 1 , from which the plot of lnk, versus ln[HNO 3 ] was obtained (fig.4) for the evaluation of reaction order for the process. From Fig. 4, the reaction order with respect to [H + ] ion concentration is calculated to be 0.64, i.e. ([H + ] 0.64 ). This is in accordance with the earlier works published [20, 22, 23]. 3.2.2 Effect of particle size Four different particle sizes were examined in this work. The results obtained are presented in Table 1. Experimental conditions: Mass of tantalite ore used = 0.5g, [HNO 3 ] = 8.06M, Temp = 80 0 C, stirring rate = 360rpm. Contact time = 120min. From table 1, it is evident that the rate of tantalite ore dissolution increases with decreasing particle size [24] 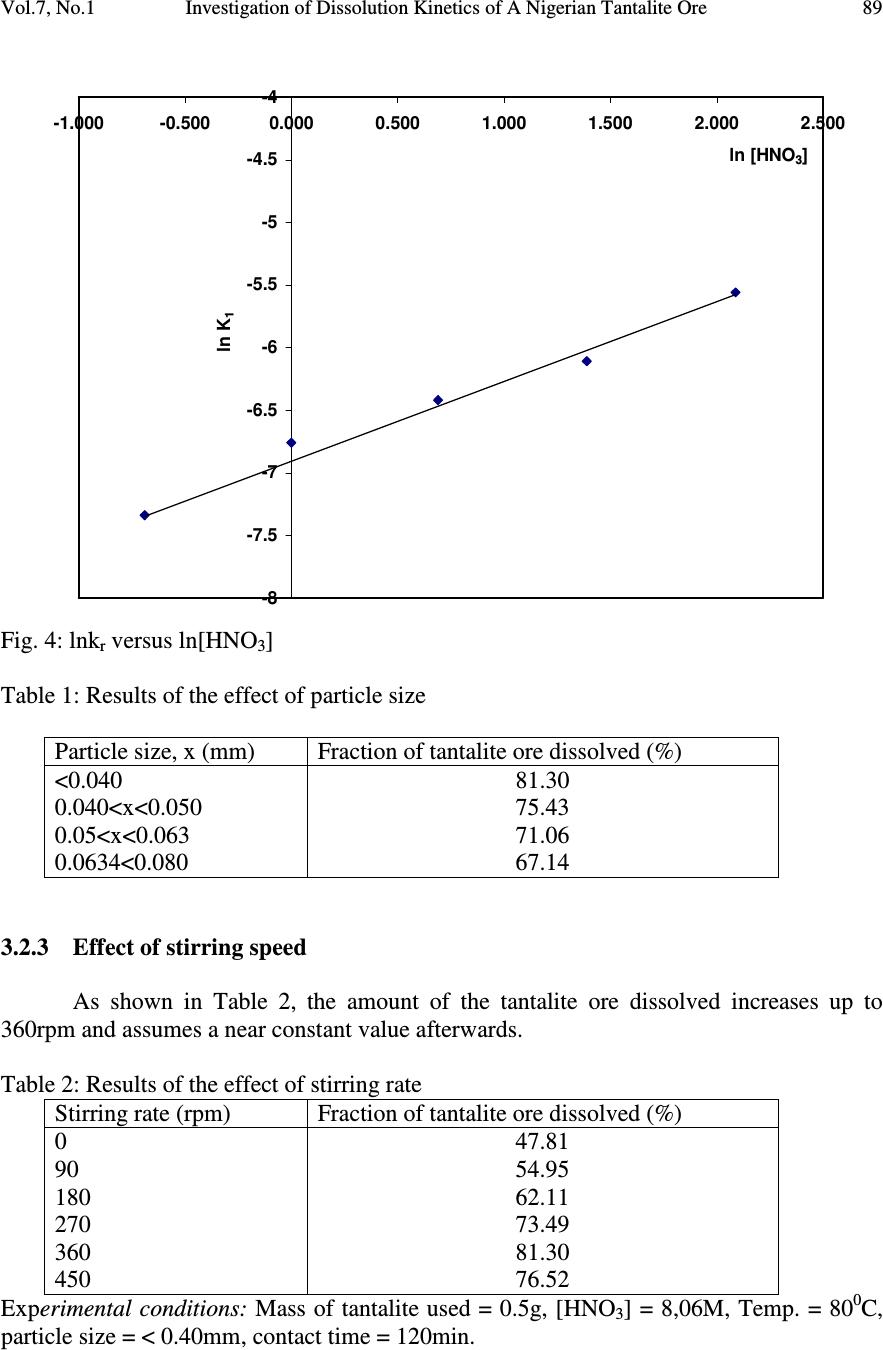 Vol.7, No.1 Investigation of Dissolution Kinetics of A Nigerian Tantalite Ore 89 -8 -7.5 -7 -6.5 -6 -5.5 -5 -4.5 -4 -1.000-0.5000.000 0.500 1.000 1.500 2.000 2.500 ln [HNO 3 ] ln K 1 Fig. 4: lnk r versus ln[HNO 3 ] Table 1: Results of the effect of particle size Particle size, x (mm) Fraction of tantalite ore dissolved (%) <0.040 0.040<x<0.050 0.05<x<0.063 0.0634<0.080 81.30 75.43 71.06 67.14 3.2.3 Effect of stirring speed As shown in Table 2, the amount of the tantalite ore dissolved increases up to 360rpm and assumes a near constant value afterwards. Table 2: Results of the effect of stirring rate Stirring rate (rpm) Fraction of tantalite ore dissolved (%) 0 90 180 270 360 450 47.81 54.95 62.11 73.49 81.30 76.52 Experimental conditions: Mass of tantalite used = 0.5g, [HNO 3 ] = 8,06M, Temp. = 80 0 C, particle size = < 0.40mm, contact time = 120min.  90 A.A. Baba, F.A. Adekola, O.I. Dele-Ige and R.B. Bale Vol.7, No.1 3.2.4 Effect of temperature The effect of the temperature on the tantalite ore dissolution is shown in Fig. 5. 0.000 0.100 0.200 0.300 0.400 0.500 0.600 0.700 0.800 0.900 020 40 60 80100120140 Contact Time (min) Fraction of tantalite ore dissolved (X) 80 70 60 40 28 0 C 0 C 0 C 0 C 0 C Fig. 5: Fraction of tantalite ore dissolved vs. time at different temperatures. Experimental conditions: Mass of tantalite used = 0.5g [HNO 3 ] = 8,06M, Particle size = <0.040mm, Stirring rate = 360rpm, Temp = 28 – 80 0 C, Contact time = 120min. As seen in Fig. 5, tantalite ore dissolution in HNO 3 increases with leaching time and with increasing temperature in the range of 28-80 0 C. 3.3 Kinetic Studies The shrinking core model considers that the leaching process is controlled either by the diffusion of reactant through the solution boundary layer, or through a solid product layer, or by rate of the surface chemical reaction. The simplified equations of the shrinking core model when either diffusion or the surface chemical reactions are the slowest step can be expressed as follows, respectively [24, 25]: ( ) tkX1X 3 2 1 a 3 2 =−−− (1) ( ) tkX11 r 3 1 =−− (2), 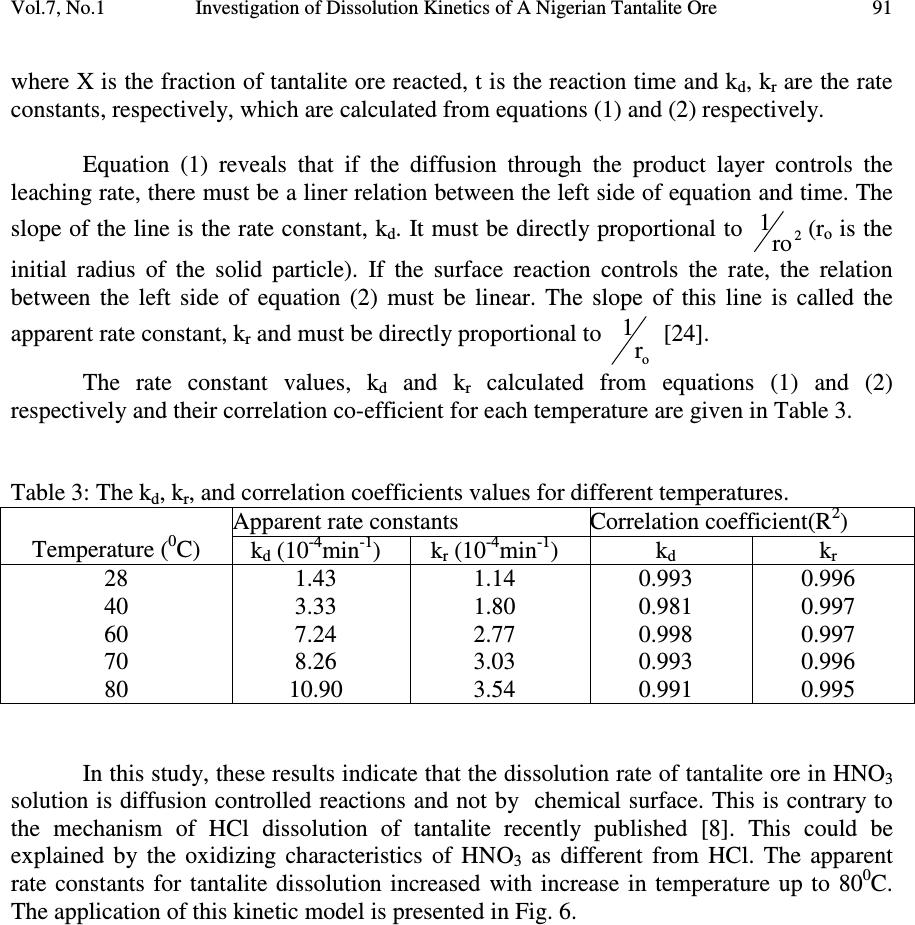 Vol.7, No.1 Investigation of Dissolution Kinetics of A Nigerian Tantalite Ore 91 where X is the fraction of tantalite ore reacted, t is the reaction time and k d , k r are the rate constants, respectively, which are calculated from equations (1) and (2) respectively. Equation (1) reveals that if the diffusion through the product layer controls the leaching rate, there must be a liner relation between the left side of equation and time. The slope of the line is the rate constant, k d . It must be directly proportional to 2 ro 1(ro is the initial radius of the solid particle). If the surface reaction controls the rate, the relation between the left side of equation (2) must be linear. The slope of this line is called the apparent rate constant, kr and must be directly proportional to o r 1 [24]. The rate constant values, kd and kr calculated from equations (1) and (2) respectively and their correlation co-efficient for each temperature are given in Table 3. Table 3: The kd, kr, and correlation coefficients values for different temperatures. Temperature (0C) Apparent rate constants Correlation coefficient(R 2 ) k d (10 - 4 min - 1 ) k r (10 - 4 min - 1 ) k d k r 28 40 60 70 80 1.43 3.33 7.24 8.26 10.90 1.14 1.80 2.77 3.03 3.54 0.993 0.981 0.998 0.993 0.991 0.996 0.997 0.997 0.996 0.995 In this study, these results indicate that the dissolution rate of tantalite ore in HNO3 solution is diffusion controlled reactions and not by chemical surface. This is contrary to the mechanism of HCl dissolution of tantalite recently published [8]. This could be explained by the oxidizing characteristics of HNO3 as different from HCl. The apparent rate constants for tantalite dissolution increased with increase in temperature up to 800C. The application of this kinetic model is presented in Fig. 6. 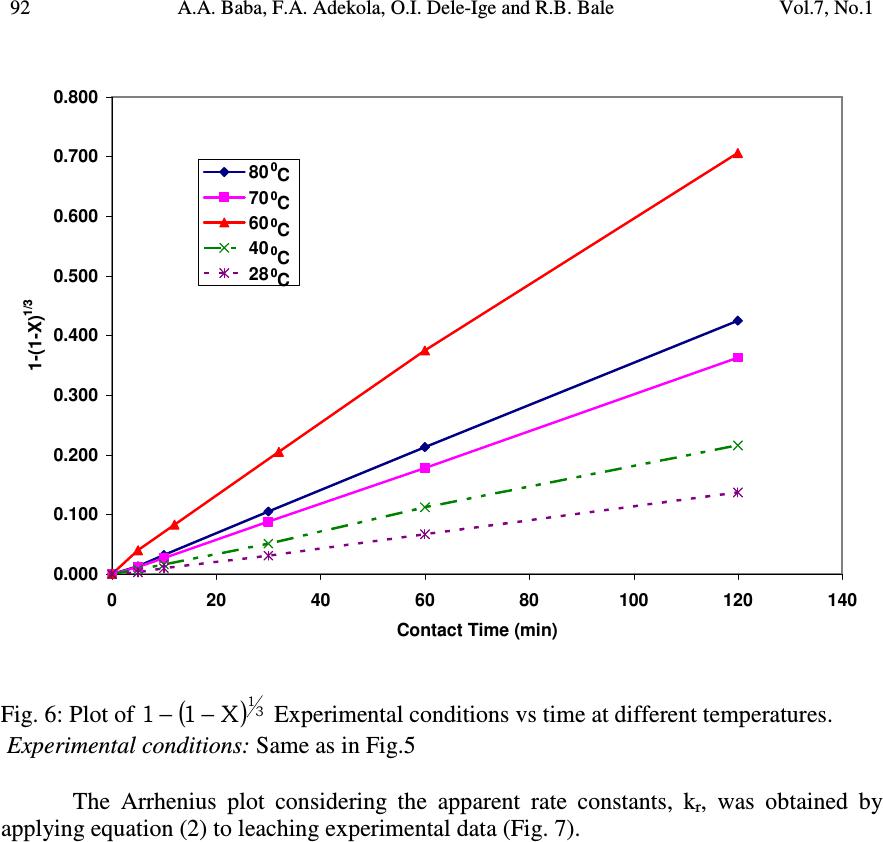 92 A.A. Baba, F.A. Adekola, O.I. Dele-Ige and R.B. Bale Vol.7, No.1 0.000 0.100 0.200 0.300 0.400 0.500 0.600 0.700 0.800 020406080100 120 140 Contact Time (min) 1-(1-X) 1/3 80 70 60 40 28 0 C 0 C 0 C 0 C 0 C Fig. 6: Plot of ( ) 3 1 X11−− Experimental conditions vs time at different temperatures. Experimental conditions: Same as in Fig.5 The Arrhenius plot considering the apparent rate constants, kr, was obtained by applying equation (2) to leaching experimental data (Fig. 7). 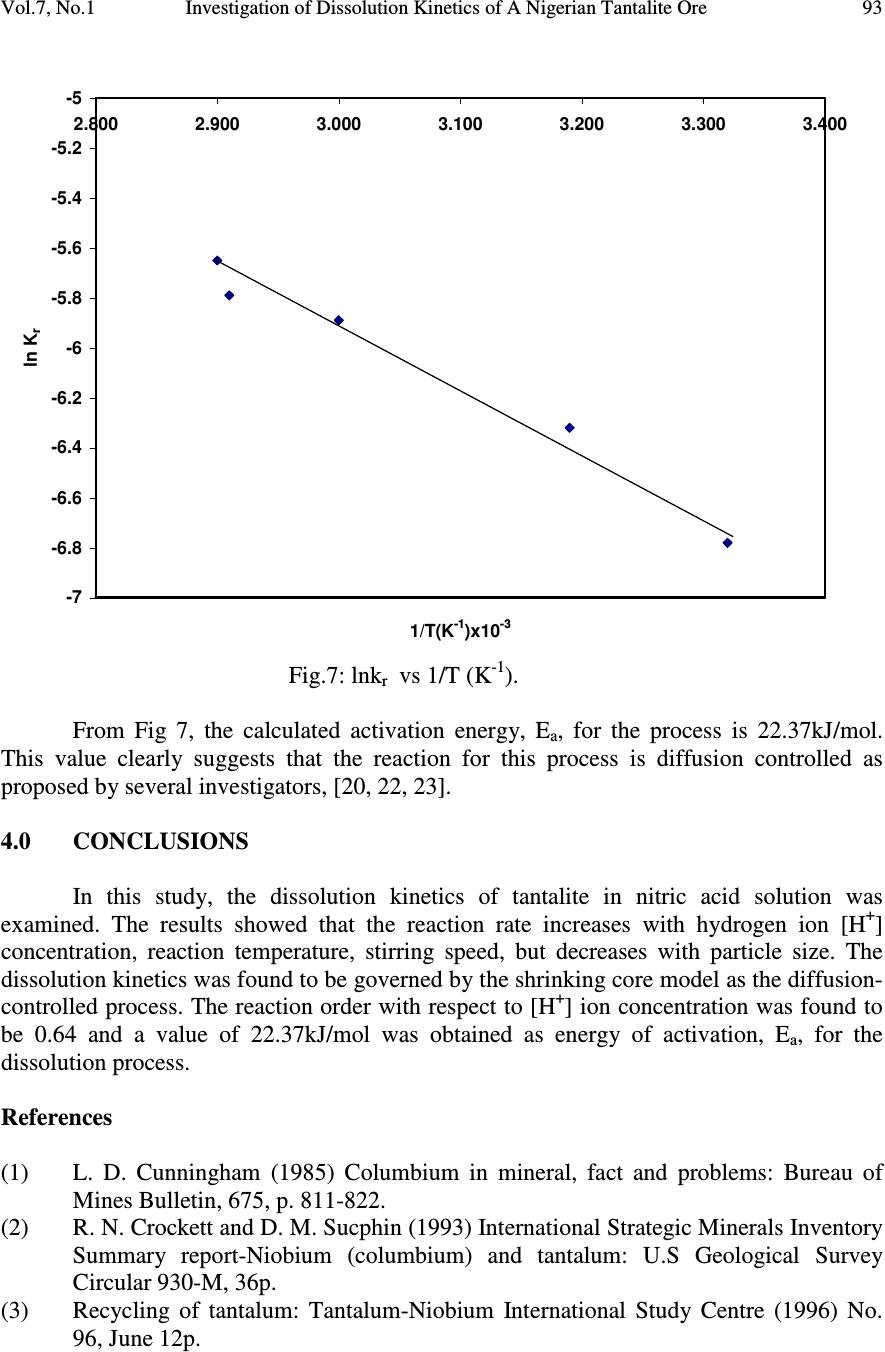 Vol.7, No.1 Investigation of Dissolution Kinetics of A Nigerian Tantalite Ore 93 -7 -6.8 -6.6 -6.4 -6.2 -6 -5.8 -5.6 -5.4 -5.2 -5 2.800 2.900 3.000 3.100 3.200 3.300 3.400 1/T(K -1 )x10 -3 ln K r Fig.7: lnkr vs 1/T (K-1). From Fig 7, the calculated activation energy, Ea, for the process is 22.37kJ/mol. This value clearly suggests that the reaction for this process is diffusion controlled as proposed by several investigators, [20, 22, 23]. 4.0 CONCLUSIONS In this study, the dissolution kinetics of tantalite in nitric acid solution was examined. The results showed that the reaction rate increases with hydrogen ion [H+] concentration, reaction temperature, stirring speed, but decreases with particle size. The dissolution kinetics was found to be governed by the shrinking core model as the diffusion- controlled process. The reaction order with respect to [H+] ion concentration was found to be 0.64 and a value of 22.37kJ/mol was obtained as energy of activation, Ea, for the dissolution process. References (1) L. D. Cunningham (1985) Columbium in mineral, fact and problems: Bureau of Mines Bulletin, 675, p. 811-822. (2) R. N. Crockett and D. M. Sucphin (1993) International Strategic Minerals Inventory Summary report-Niobium (columbium) and tantalum: U.S Geological Survey Circular 930-M, 36p. (3) Recycling of tantalum: Tantalum-Niobium International Study Centre (1996) No. 96, June 12p.  94 A.A. Baba, F.A. Adekola, O.I. Dele-Ige and R.B. Bale Vol.7, No.1 (4) M. A. Rahamman (2004) Nigeria’s Mineral Endowment and Sustainable Development. 2nd Mosobalaje Oyawaye Endowed Faculty of Science Lecture, University of Ilorin, Ilorin-Nigeria. p.27 (5) Tantalum: Mining Journal speciality Metals Annual Review Supplement (1999) vol. 333 no 8544, August 13, p.89. (6) A. R. Adetunji; W. O. Siyanbola; I. I. Funtua; S. O. O. Olagunde; A. A. Afonja and O. O. Adewoye (2004). Assessment of Beneficiation routes of Tantalite ores from key locations in Nigeria. J. Minerals & Mat. Characterization & Engr., vol. 4. No. 2 p. 84-93. (7) L. D. Cunninagham (2005) “Tantalum”, USGS Mineral Commodity Summary, pp. 166 – 167. (8) A. A. Baba; F. A. Adekola, and M. Faseki (2005) A study the kinetics of the dissolution of a Nigerian tantalite ore in hydrochloric acid. Ife Journal of Science, vol. 7. No. 2. p. 221-226 (9) M. Ruiz, M. H. Rodriguez, E. Perino. and R. A. Olsina (2004). X-ray fluorescence analytical methodology for the determination of Nb, Ta, Fe and Mn. Lat. Am. Appl. Res., Vol. 34. No. 1, Bahia Blama, ene/march 2004 (10) A. M. E. Blaes, K. Doxon and G. J. Wall (1987) “Application of X-ray fluorescence spectrometry to the analysis of Ta-Nb in slags and associated by-products.” Society for Applied spectrometry vol. 41. No.3, p. 509 – 512. (11) P. Roy-Chowldhury, N. K. Roy, and A. K. Das (1995) Determination of the tungsten, niobium and tantalum in rocks and minerals by inductively coupled plasma-atomic emission spectrometry. Atomic spectroscopy p. 104-105. (12) G. Anil, M. R. P. Reddy, M. K. Sharma, A. Kumar, and T. L. Prakash (2004) Analysis of Tantalum loaded Tributyl phosphate for the content of Major, Minor and Trace Elements using Microwave Decomposition and ICP-OES. Chem. Anal. (Warsaw) vol. 49.p.45. (13) C. K. Gupta, and A. K. Suri (1994). Extractive metallurgy of niobium. Boca Raton FL, CRC Press, Inc. 254 p. (14) F. Habasi (1997) Handbook of Extractive metallurgy. Vol. 3. Wiley-VCH, Germany, pp. 1404-1406, 1418-1421. (15) C. Ciaravino, F. F. P. Medeiros, C. P. De-souza and M. Roubin, (2002) Elaboration of mixed tantalum and niobium carbides from tantalite mineral (Fe, Mn) (Ta1-x Nbx)2O6. J. Mat. Science, vol. 37, No. 10. p. 2117-2123. (16) T. B. Tripp (1997) Tantalum and tantalum compounds in sugar to thin films, V. 23 of Kirk-Othmer Encyclopedia of Chem. Tech. 4th. Ed, New York, John Wiley & Sons. p.65 (17) O. A. Okunlola (2000) Process test work for the recovery of Ta concentrates from rare metal pegmatites, Nassarawa area, Central Nigeria. Global Journal of Geol., vol.1, No 1. pp 12-16. (18) O. A. Okunlola (2002) Compositional features and economic evaluation of Ta-Nb pegmatites of Keffi area. Book of Abstracts, Min. and Geo. Sc. Conf, Itakpe, Nigeria. (19) O. A. Okunlola (2006) Regional metallogens of rare metals (Ta-Nb) mineralization in Precambrian pegmatites of Nigeria-In the Basement complex of Nigeria and its  Vol.7, No.1 Investigation of Dissolution Kinetics of A Nigerian Tantalite Ore 95 mineral resources. A tribute to M. A. O. Rahaman, Akin Jinad & Co, Ibadan, Nigeria p. 107-28 (20) E. O. Olanipekun (1999) A kinetic study of the leaching of a Nigerian ilmenite ore by hydrochloric acid. Hydrometallurgy. Vol. 53, p. 1-10. (21) E. O. Olanipekun (2000) Quantitative leaching of galena. Bull. Chem. Soc. Ethiopia. Vol. 14 No. 1, p. 25-32. (22) Alafara A. Baba, F. A. Adekola and A. O. Folashade (2005) Quantitative leaching of a Nigerian Iron ore in hydrochloric acid J. Appl. Sc. Environ. Mgt. Vol. 9 No.1, p. 15-20. (23) M. M. Antonijevic, Z. D. Jankoric and M. D. Dimitrijevic (2004) Kinetics of chalcopyrite dissolution by hydrogen peroxide in sulphuric acid. Hyrometallurgy. Vol. 11, Issues 3-4, p. 329-334. (24) S. Aydogan, A. Aras, and M. Cambazoglu (2005) Dissolution kinetics of sphalerite in acidic ferric chloride leaching. Chemical Engr. Journal. Vol. 114, p. 67-72. (25) O. Levenspiel (1972) Chemical Reaction Engineering 2nd ed., Wiley, New York, NY. (26) S. Habashi (1999) Kinetics of metallurgical processes 2nd ed, Metallurgie Extractive Quebec, Quebec, Canada. (27) N. V. Ngoc, M. Shamsaddin, and P. M. Prasad (1999) Oxidative leaching of an off- grade/complex copper concentrate in chloride lixiviants. Metall. Trans. Vol. 21B, p. 611-620. (28) M. K. Ghosh, R. P. Das and A. K. Biseas (2002) Oxidative ammonia leaching of sphalerite 1: non-catalytic kinetics. Int. J. Miner Process. Vol. 66, p. 241 – 254. (29) G. J. Simandl (1984) “Tantalum Market and Resources: An Overview” Geological Fieldwork; British Columbia Geological Survey; 200, pp. 313 – 318. |