 Journal of Environmental Protection, 2010, 1, 155-171 doi:10.4236/jep.2010.12020 Published Online June 2010 (http://www.SciRP.org/journal/jep) Copyright © 2010 SciRes. JEP 1 Analysis of Mean Monthly Rainfall Runoff Data of Indian Catchments Using Dimensionless Variables by Neural Network Manish Kumar Goyal*, Chandra Shekhar Prasad Ojha Department of Civil Engineering, Indian Institute of Technology, Roorkee, India. Email: vipmkgoyal@rediffmail.com Received April 2nd, 2010; revised May 4th, 2010; accepted May 5th, 2010. ABSTRACT This paper focuses on a concept of using dimensionless variables as input and output to Artificial Neural Network (ANN) and discusses the improvement in the results in terms of various performance criteria as well as simplification of ANN structure for modeling rainfall-runoff process in certain Indian catchments. In the present work, runoff is taken as the response (output) variable while rainfall, slope, area of catchment and forest cover are taken as input parameters. The data used in this study are taken from six drainage basins in the Indian provinces of Madhya Pradesh, Bihar, Ra- jasthan, West Bengal and Tamil Nadu, located in the different hydro-climatic zones. A standard statistical performance evaluation measures such as root mean square (RMSE), Nash–Sutcliffe efficiency and Correlation coefficient were em- ployed to evaluate the performances of various models developed. The results obtained in this study indicate that ANN model using dimensionless variables were able to provide a better representation of rainfall–runoff process in com- parison with the ANN models using process variables investigated in this study. Keywords: Dimensional Variables, Artificial Neural Networks, Rainfall–Runoff 1. Introduction The rainfall-runoff relationship is one the most complex hydrological phenomenon due to the tremendous spatial and temporal variability of watershed characteristics and rainfall patterns as well as a number of variables in- volved in the physical processes. Also, this process is non-linear in nature and thus difficult to arrive at explicit solutions [1,2]. The runoff needs to be estimated for effi- cient utilization of water resources. The rainfall-runoff models play a significant role in water resource man- agement planning and hydraulic design. Several attempts have been made to model the non-linearity of the rain- fall–runoff process, arising from intrinsic non-linearity of the rainfall–runoff process and from seasonality These rainfall-runoff models generally fall into these broad categories; namely, black box or system theoretical mod- els, conceptual models and physically-based models [3-5]. Black box models normally contain no physi- cally-based input and output transfer functions and therefore, are considered to be purely empirical models. Conceptual rainfall-runoff models usually incorporate interconnected physical elements with simplified forms, and each element is used to represent a significant or dominant constituent hydrologic process of the rain- fall-runoff transformation [6,7]. A dimensional analysis technique has also been developed and used to obtain mean annual flood estimation in several Indian catch- ments [8]. In recent year, applications of Artificial Neural Net- work (ANN) has become increasing popular in water resources and have been used in various fields for the prediction and forecasting of complex nonlinear proc- esses, including the rainfall runoff phenomenon. Many studies have demonstrated that the ANNs are excellent tools to model the complex rainfall–runoff process and can perform better than the conventional modeling tech- niques [1,9-12] However, many a times, less attention is given to simplify the ANN structure. The use of dimensionless variables as input and output to ANN in rainfall-runoff modeling has not been found in the literature as of our best knowledge. Although, some evidences of using dimensionless variables in ANN are known in application of estimation of scour downstream [13] and for heat problems [14]. Swamee used the di- mensionless variables to compute annual flood estima- tion and hence, the same dimensionless variables are used in this present study in the context of rainfall-runoff process [8]. Thus, in view of the above, the objectives of the pre- sent study are to 1) evaluate dimensional analysis tech- nique of Swamee et al.; 2) investigate the technique of 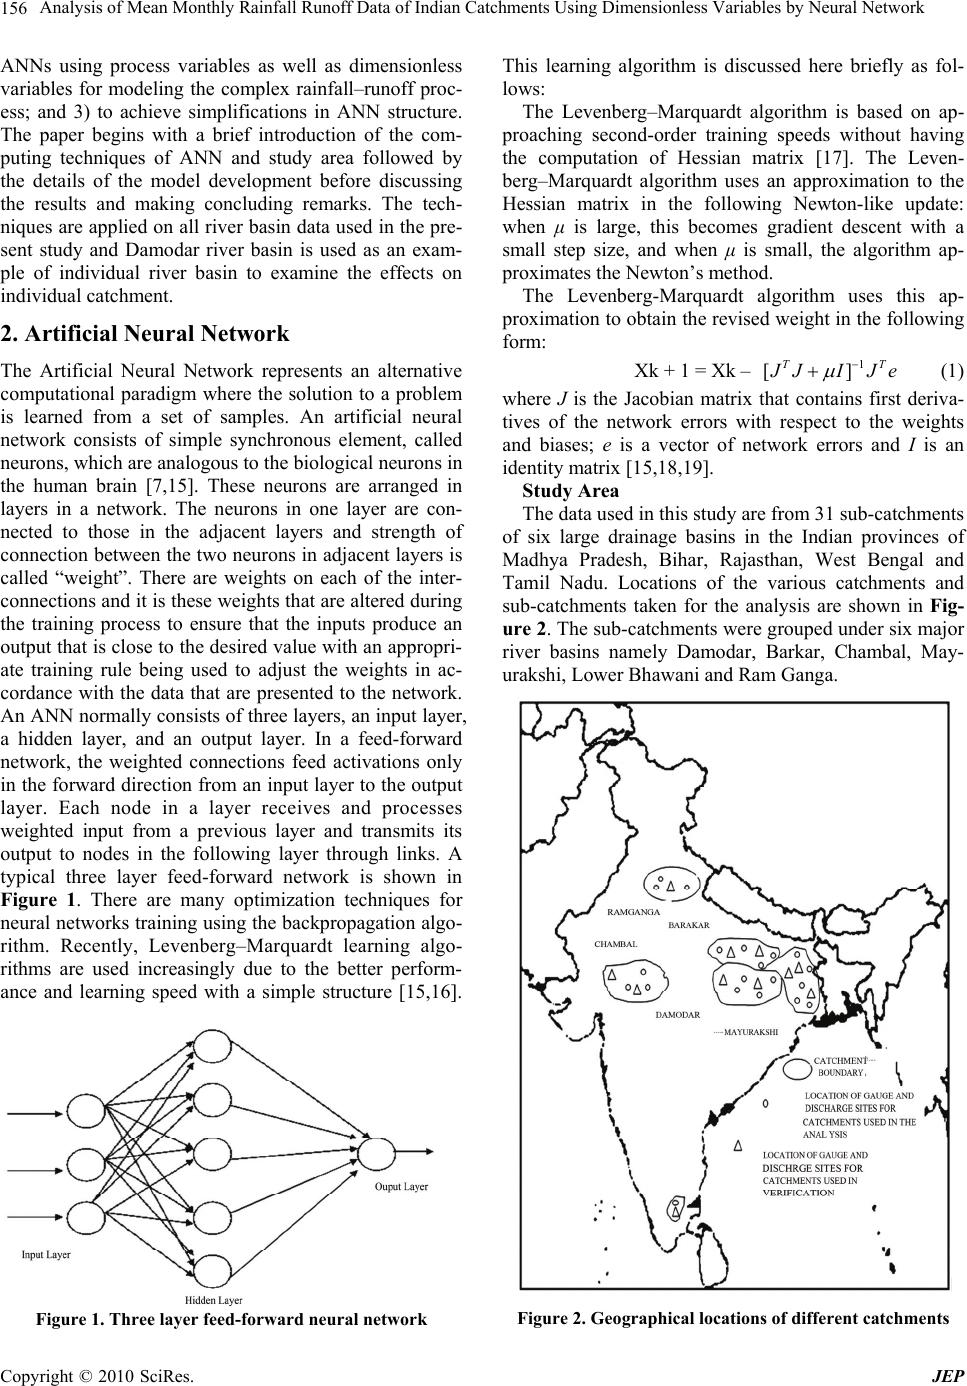 Analysis of Mean Monthly Rainfall Runoff Data of Indian Catchments Using Dimensionless Variables by Neural Network 156 ANNs using process variables as well as dimensionless variables for modeling the complex rainfall–runoff proc- ess; and 3) to achieve simplifications in ANN structure. The paper begins with a brief introduction of the com- puting techniques of ANN and study area followed by the details of the model development before discussing the results and making concluding remarks. The tech- niques are applied on all river basin data used in the pre- sent study and Damodar river basin is used as an exam- ple of individual river basin to examine the effects on individual catchment. 2. Artificial Neural Network The Artificial Neural Network represents an alternative computational paradigm where the solution to a problem is learned from a set of samples. An artificial neural network consists of simple synchronous element, called neurons, which are analogous to the biological neurons in the human brain [7,15]. These neurons are arranged in layers in a network. The neurons in one layer are con- nected to those in the adjacent layers and strength of connection between the two neurons in adjacent layers is called “weight”. There are weights on each of the inter- connections and it is these weights that are altered during the training process to ensure that the inputs produce an output that is close to the desired value with an appropri- ate training rule being used to adjust the weights in ac- cordance with the data that are presented to the network. An ANN normally consists of three layers, an input layer, a hidden layer, and an output layer. In a feed-forward network, the weighted connections feed activations only in the forward direction from an input layer to the output layer. Each node in a layer receives and processes weighted input from a previous layer and transmits its output to nodes in the following layer through links. A typical three layer feed-forward network is shown in Figure 1. There are many optimization techniques for neural networks training using the backpropagation algo- rithm. Recently, Levenberg–Marquardt learning algo- rithms are used increasingly due to the better perform- ance and learning speed with a simple structure [15,16]. Figure 1. Three layer feed-forward neural network This learning algorithm is discussed here briefly as fol- lows: The Levenberg–Marquardt algorithm is based on ap- proaching second-order training speeds without having the computation of Hessian matrix [17]. The Leven- berg–Marquardt algorithm uses an approximation to the Hessian matrix in the following Newton-like update: when μ is large, this becomes gradient descent with a small step size, and when μ is small, the algorithm ap- proximates the Newton’s method. The Levenberg-Marquardt algorithm uses this ap- proximation to obtain the revised weight in the following form: Xk + 1 = Xk – 1 [] TT JIJ e (1) where J is the Jacobian matrix that contains first deriva- tives of the network errors with respect to the weights and biases; e is a vector of network errors and I is an identity matrix [15,18,19]. Study Area The data used in this study are from 31 sub-catchments of six large drainage basins in the Indian provinces of Madhya Pradesh, Bihar, Rajasthan, West Bengal and Tamil Nadu. Locations of the various catchments and sub-catchments taken for the analysis are shown in Fig- ure 2. The sub-catchments were grouped under six major river basins namely Damodar, Barkar, Chambal, May- urakshi, Lower Bhawani and Ram Ganga. Figure 2. Geographical locations of different catchments Copyright © 2010 SciRes. JEP  Analysis of Mean Monthly Rainfall Runoff Data of Indian Catchments Using Dimensionless Variables by Neural Network Copyright © 2010 SciRes. JEP 157 16 75 84 91 4 39 69 The values of monthly runoff were determined by summing up the daily observed discharges for the month. The monthly rainfall for each catchment was averaged using the Theissen polygon method. The hydrological data for use in the present study is taken from Pooja Jain and Rama Raju [20,21]. These data were originally taken from the reports of Soil and Water Conservation Division, (1984, 1987) published by Water Conservation Division of the Ministry of Agriculture, Government of India. The periods for which data is available vary from 10 to 17 years. Some data points were excluded from published hydrological data where runoff was more than precipita- tion, which is practically not possible. Mean values of several years of data are given in Table 1 and ranges of the above mentioned data used in the present study are given in Table 2. Table 1. Mean value of data used Hydrological region R m (mm)P m (mm)R m (mm) P m (mm) R m (mm)P m (mm) R m (mm)P m (mm)R m (mm) P m (mm) 42.62 97.67131.16282 95.32222 84.66206 31.4147.98.512 299.61 63.36165 151.8251 148.9263 130.218851.774.617.510 291.53 45.11 123.7 142.6 283.4 165.4 280.1123236.8 66.3 87.3 14.510 261.9 54 113.3 145.3 275.8 136.1285 131.5 228.649.974.612.515 172.88 49.6 132.11 128.16266177326.1 148.65229.157.390.241320 267.7 31.2 134.2 98.51240 190.6 327.7 150.5 231.240.750.912.828 69.62 78.9 155.5 99.85 224.1120 271.677.6 136.7 40.24 52.6416.530 396.99 51.72 159.41 131.26242 216.22301108.8197.857.8491.58.540 149.6 59140 142.2301 138.9 284.7127.64 223.775.3 107.612.535 441.54 22.7474.3113.81270135.18 263.7 139.9 280.5 46.54 86.411450 156.64 33.278.2 137.2 331.8 154.7306113 230.129.64611.540 235.87 72.7 166.6103.64 340.4159.25 299.6 126.7212.6 51.0460.6960 35.58 7.53 49.18 62.11230 112.7277.5 46.91 149.15.7312152 15.4 4.5 43.65 55.43 192.2129.71 232.8 37.311355.8811.3142 4.6 49.2288.2 235.1 114.627250.6 171.25.659.6840 29.2 19.774.5 109.6 266.7 97.45 238.1 50.16 132.46.16.16.51 383.2 11.1749.7 84.41 228.6120.71 286.159.7 193.510.964.61.515 345.65 45.46 134.5177.41 351.6 137.8 244.6152 271.6 58.11 81.41525 1514.45 31.5 110.6152.65 321.4143.06 261.2122.43 212.4 47.4271.61338 1054.47 60.8 175 142 362 154 220162.2225.648.1145.2826346. 40.54147 268.6 370.7 149.6 236.3171.23 245.840.8453.535 39.26 23.5 108.7149.21 307.4 107.1 221.5108 219.8 40.3547.5635 76.79 49.3 142.2 191.6351 133.8238130.16 236.23851.3448196. 25.8 108.8 131.2 390.4 196.1 257.8 150.7 223.2 44.2633.7645311. 34 130.7 118.1310 113.7 256.5128.1247.3 38.4 57.65.540 65.19 25.4165.6 23.7166.51545.246.4 149.2 77.42 196.2410019.4 19.11 82.9 37.6 65.111 53.8 19.3122.314.51147.48100 17.5 36.4 234.3 137.8 507.4 142.2 443.7 120.5 207.846.7 187.3565238. 128.2300 360.8 520.2 193.439975.9 346.893.2184488 89.1 28.75 194.7 58.72 481.4 106.2429100 231.341 120.1779144. 48.33 246.767.3 425.7 106.6 430.7 103.6 221.660.3 155.4569 90.75 Ram GangaMayurakshi Lower Bhawa n i FA(%) A(Km2) DamodarBarakarChambal June JulyAugSeptOct S(%) Table 2. Range of the data Range Sl.No. DATA Minimum Maximum 1 Catchment Area(Km2) 15.4 1514.45 2 Monthly Runoff (mm) 4.5 360.8 3 Monthly rainfall(mm) 11.3 520.2 4 Land Slope (%) 1.0 17.5 5 Forest Cover (%) 1. 0 100  Analysis of Mean Monthly Rainfall Runoff Data of Indian Catchments Using Dimensionless Variables by Neural Network 158 3. Methods 3.1 Dimensional Analysis For dimensional analysis, Buckingham’s π theorem can be used to obtain the various dimensionless groups [8]. Swamee has investigated the influence of inclusion of 4 dimensionless groups in mean flood flow estimation. These dimensionless groups were formed using variables such as discharge Q, Area A, average rainfall p, of dura- tion D and recurrence interval T, Slope S and forest cover FA [8]. Based on available data for Indian catchments, fol- lowing variables were identified: rainfall (P), runoff (R), slope (S) and forest cover (FA). Adopting A as the re- peated variable, following nondimensional groups were formed: R* = A-0.5 R (2) P* = A-0.5 P (3) where R is the runoff in mm, P is the rainfall in mm and A is the drainage area in km2. Using the above dimensionless group, the following empirical equation was proposed: 3 1 *0* 24 ()( ) a a A RaPSa Fa 5 a 5 ) a (4) Here a0-a5 are empirical constants, S is the slope (per- cent) and FA is the forest cover. The computed value for R* for ith data set R*ci was ob- tained as 3 1 *0* 24 ()( a a cii iAi RaPSaFa (5) Here suffix i stand for ith data set and a0-a5 are fitted coefficients. Using Equation (5), the observed value R* for ith data set R*oi was obtained. To calibrate the model, the error criterion was set to minimize the average percentage er- ror Ea, defined as ** 1* 100 n oi ci ioi RR Ea nR (6) 3.2 ANN Model Development Using Process Variables Before the data presented to the ANN training, it must be standardized in order to restrict its range to the interval [0, 1]. The actual observed outputs of the network being outside this bounded range of neuron transfer function; need to be normalized such that they fall within the bounded output range. To develop a model, it is impor- tant to establish a correlation between the dependent variable with the independent variables. For this purpose, correlation matrix has been made and is given in Table 3. Using the information drawn from the correlation matrix analysis, runoff models have been decided as a function of different input variables. However, rainfall has been considered as a common input variable among all. 1:( ){( )} NNPAMR tfP t (7) 2:( ){( ),} NNPAMR tfP tS (8) 3:( ){(),,} A ANNPAMR tfP tSF (9) 4:( ){( ),,,} A NNPAMRtfP tSFA (10) 5:( ){(1),( ),,,} A NNPAMR tfP tPtSFA Here ANNPAM represents Artificial Neural Network Process variables All river basins Model. The development of rainfall–runoff models using ANNs, involves the following steps: 1) selection of data set for training, cross-validation and validation of the model, 2) identification of the input and output variables, 3) normalization of the data, 4) selection of the network architecture, 5) determining the number of neurons in the hidden layer, 6) training of the ANN models, and 7) validation and cross-validation of ANN model using the selected performance evaluation statistics. Back Propagation Learning Network (BPLN) has been first calibrated using about 60 percent of data and 20 percent of data have been used in the validation of model. The remaining 20 percent have been used for cross vali- dation of the model. The momentum coefficient is ada- pted to 0.9 and learning rate is fixed to 0.05 for neural network training. The number of epochs has been set to 3000. Log sigmoid is used as transfer function. The set of inputs combination which produced desired results cor- responding to minimum RMSE were adopted for further analysis. 3.3 ANN Model Development Using Dimensionless Variables Following model ANNDAM1 has been developed using dimensionless variables of rainfall (P*), slope (S), forest cover (FA) and runoff (R*). These dimensionless vari- ables are discussed previously. Here ANNDAM repre- sents Artificial Neural Network Dimensionless All river basin Model. Table 3. Correlation matrix of the variables Runoff Rainfall Slope Forest cover Area Runoff 1.0000 Rainfall 0.7769 1.0000 Slope 0.1333 –0.0114 1.0000 Forest cover –0.1315 0.0891 –0.3675 1.0000 Area 0.1299 0.0405 0.1761 –0.3471 1.0000 Copyright © 2010 SciRes. JEP 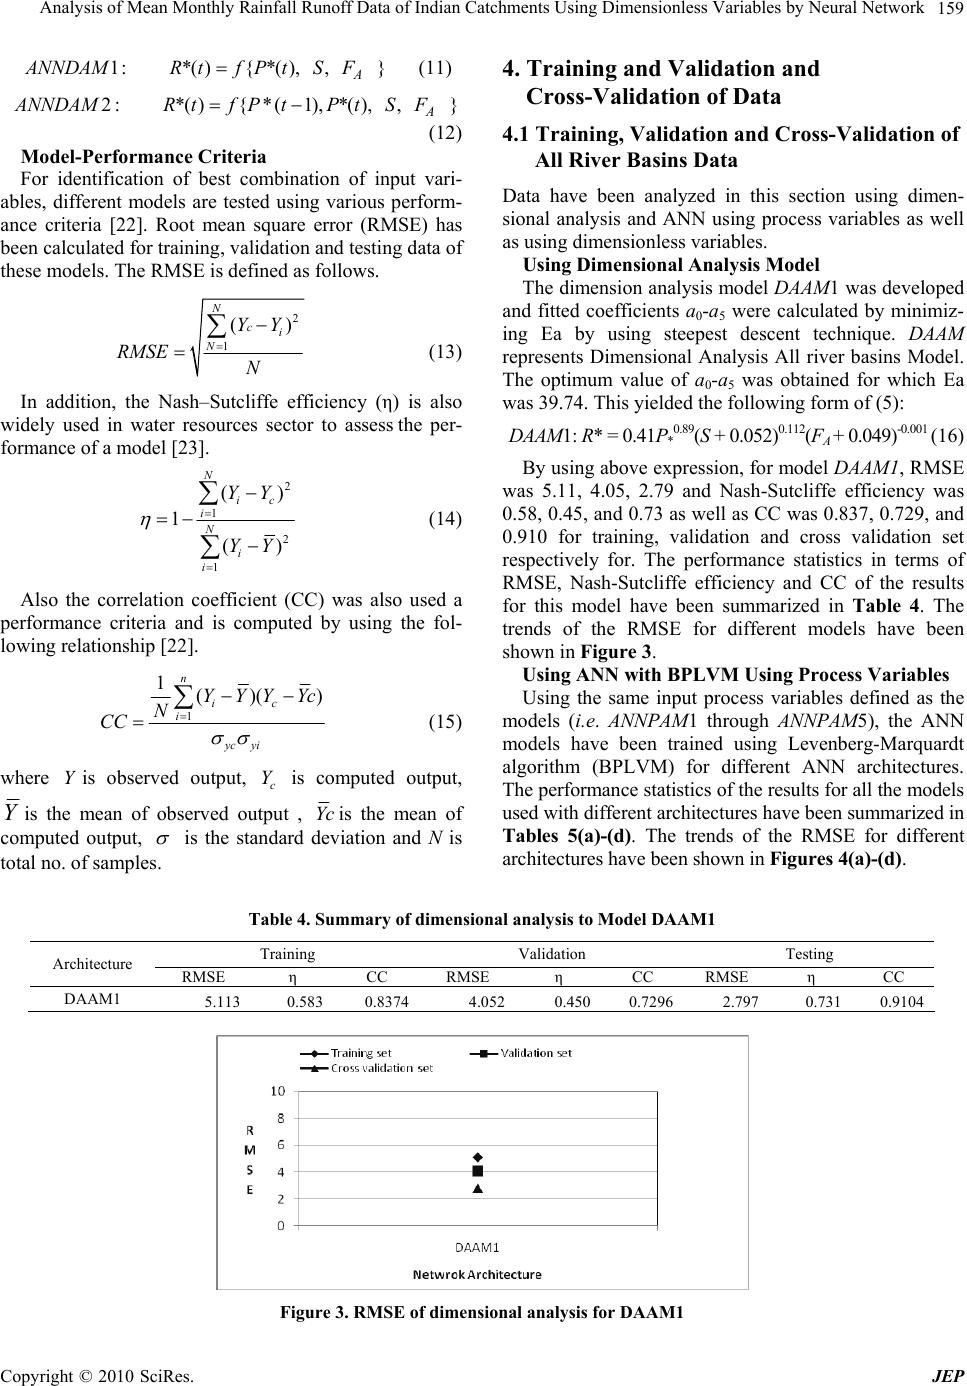 Analysis of Mean Monthly Rainfall Runoff Data of Indian Catchments Using Dimensionless Variables by Neural Network 159 1:*( ){*( ),,} A ANNDAMRtf PtSF (11) 2:*(){*(1),*( ),,} A ANNDAMR tfPtPtSF (12) Model-Performance Criteria For identification of best combination of input vari- ables, different models are tested using various perform- ance criteria [22]. Root mean square error (RMSE) has been calculated for training, validation and testing data of these models. The RMSE is defined as follows. 2 1 () N ci N YY RMSE N (13) In addition, the Nash–Sutcliffe efficiency (η) is also widely used in water resources sector to assess the per- formance of a model [23]. 2 1 2 1 () 1 () N ic i N i i YY YY (14) Also the correlation coefficient (CC) was also used a performance criteria and is computed by using the fol- lowing relationship [22]. 1 1()( n ic i yc yi YYYYc N CC ) (15) where is observed output, is computed output, Yc Y Yis the mean of observed output , Yc is the mean of computed output, is the standard deviation and N is total no. of samples. 4. Training and Validation and Cross-Validation of Data 4.1 Training, Validation and Cross-Validation of All River Basins Data Data have been analyzed in this section using dimen- sional analysis and ANN using process variables as well as using dimensionless variables. Using Dimensional Analysis Model The dimension analysis model DAAM1 was developed and fitted coefficients a0-a5 were calculated by minimiz- ing Ea by using steepest descent technique. DAAM represents Dimensional Analysis All river basins Model. The optimum value of a0-a5 was obtained for which Ea was 39.74. This yielded the following form of (5): DAAM1: R* = 0.41P*0.89(S + 0.052)0.112(FA + 0.049)-0.001 (16) By using above expression, for model DAAM1, RMSE was 5.11, 4.05, 2.79 and Nash-Sutcliffe efficiency was 0.58, 0.45, and 0.73 as well as CC was 0.837, 0.729, and 0.910 for training, validation and cross validation set respectively for. The performance statistics in terms of RMSE, Nash-Sutcliffe efficiency and CC of the results for this model have been summarized in Table 4. The trends of the RMSE for different models have been shown in Figure 3. Using ANN with BPLVM Using Process Variables Using the same input process variables defined as the models (i.e. ANNPAM1 through ANNPAM5), the ANN models have been trained using Levenberg-Marquardt algorithm (BPLVM) for different ANN architectures. The performance statistics of the results for all the models used with different architectures have been summarized in Tables 5(a)-(d). The trends of the RMSE for different architectures have been shown in Figures 4(a)-(d). Table 4. Summary of dimensional analysis to Model DAAM1 Training Validation Testing Architecture RMSE η CC RMSE η CC RMSE η CC DAAM1 5.1130.583 0.83744.0520.4500.72962.797 0.731 0.9104 Figure 3. RMSE of dimensional analysis for DAAM1 Copyright © 2010 SciRes. JEP 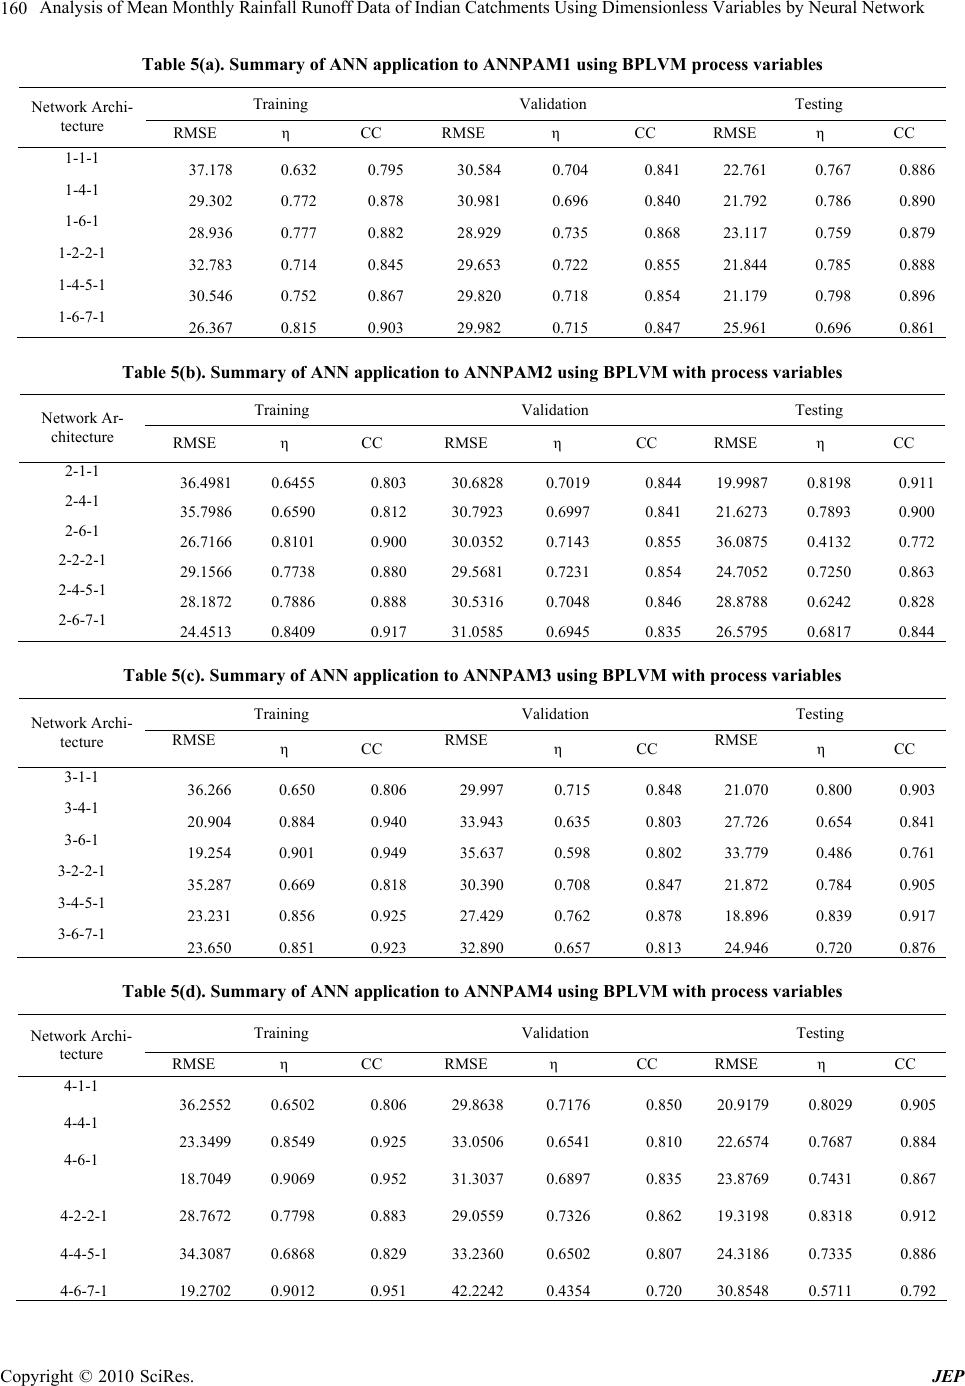 Analysis of Mean Monthly Rainfall Runoff Data of Indian Catchments Using Dimensionless Variables by Neural Network 160 Table 5(a). Summary of ANN application to ANNPAM1 using BPLVM process variables Training Validation Testing Network Archi- tecture RMSE η CC RMSE η CC RMSE η CC 1-1-1 37.178 0.632 0.79530.5840.7040.84122.761 0.767 0.886 1-4-1 29.302 0.772 0.87830.9810.6960.84021.792 0.786 0.890 1-6-1 28.936 0.777 0.88228.9290.7350.86823.117 0.759 0.879 1-2-2-1 32.783 0.714 0.84529.6530.7220.85521.844 0.785 0.888 1-4-5-1 30.546 0.752 0.86729.8200.7180.85421.179 0.798 0.896 1-6-7-1 26.367 0.815 0.90329.9820.7150.84725.961 0.696 0.861 Table 5(b). Summary of ANN application to ANNPAM2 using BPLVM with process variables Training Validation Testing Network Ar- chitecture RMSE η CC RMSE η CC RMSE η CC 2-1-1 36.4981 0.6455 0.80330.68280.70190.84419.9987 0.8198 0.911 2-4-1 35.7986 0.6590 0.81230.79230.69970.84121.6273 0.7893 0.900 2-6-1 26.7166 0.8101 0.90030.03520.71430.85536.0875 0.4132 0.772 2-2-2-1 29.1566 0.7738 0.88029.56810.72310.85424.7052 0.7250 0.863 2-4-5-1 28.1872 0.7886 0.88830.53160.70480.84628.8788 0.6242 0.828 2-6-7-1 24.4513 0.8409 0.91731.05850.69450.83526.5795 0.6817 0.844 Table 5(c). Summary of ANN application to ANNPAM3 using BPLVM with process variables Training Validation Testing Network Archi- tecture RMSE η CC RMSE η CC RMSE η CC 3-1-1 36.266 0.650 0.80629.9970.7150.84821.070 0.800 0.903 3-4-1 20.904 0.884 0.94033.9430.6350.80327.726 0.654 0.841 3-6-1 19.254 0.901 0.94935.6370.5980.80233.779 0.486 0.761 3-2-2-1 35.287 0.669 0.81830.3900.7080.84721.872 0.784 0.905 3-4-5-1 23.231 0.856 0.92527.4290.7620.87818.896 0.839 0.917 3-6-7-1 23.650 0.851 0.92332.8900.6570.81324.946 0.720 0.876 Table 5(d). Summary of ANN application to ANNPAM4 using BPLVM with process variables Training Validation Testing Network Archi- tecture RMSE η CC RMSE η CC RMSE η CC 4-1-1 36.2552 0.6502 0.80629.86380.71760.85020.9179 0.8029 0.905 4-4-1 23.3499 0.8549 0.92533.05060.65410.81022.6574 0.7687 0.884 4-6-1 18.7049 0.9069 0.95231.30370.68970.83523.8769 0.7431 0.867 4-2-2-1 28.7672 0.7798 0.88329.05590.73260.86219.3198 0.8318 0.912 4-4-5-1 34.3087 0.6868 0.82933.23600.65020.80724.3186 0.7335 0.886 4-6-7-1 19.2702 0.9012 0.95142.22420.43540.72030.8548 0.5711 0.792 Copyright © 2010 SciRes. JEP 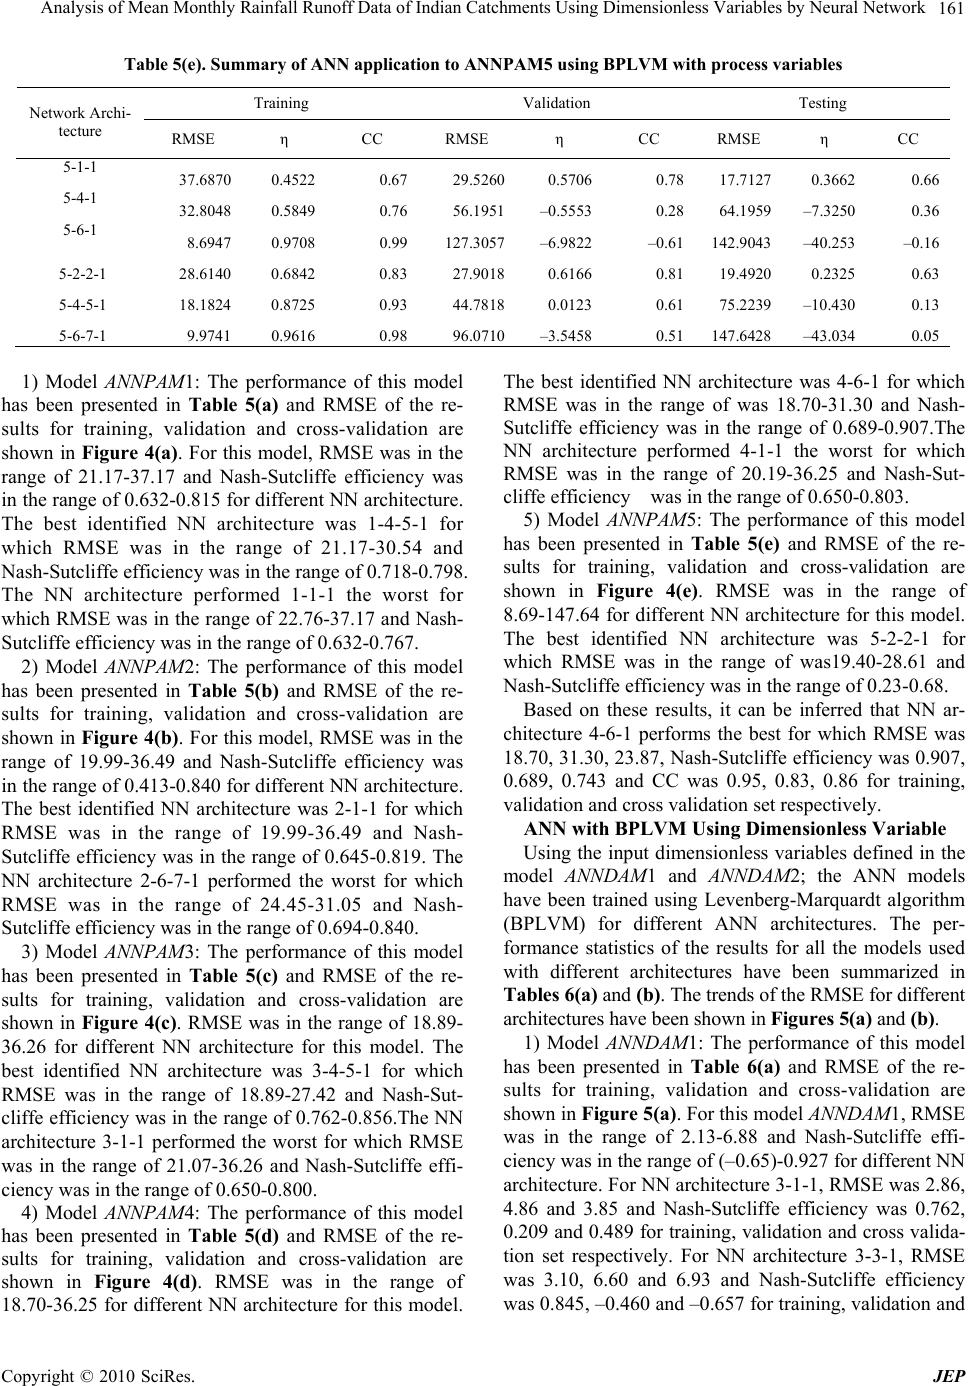 Analysis of Mean Monthly Rainfall Runoff Data of Indian Catchments Using Dimensionless Variables by Neural Network Copyright © 2010 SciRes. JEP 161 Table 5(e). Summary of ANN application to ANNPAM5 using BPLVM with process variables Training Validation Testing Network Archi- tecture RMSE η CC RMSE η CC RMSE η CC 5-1-1 37.6870 0.4522 0.6729.52600.57060.7817.7127 0.3662 0.66 5-4-1 32.8048 0.5849 0.7656.1951–0.55530.2864.1959 –7.3250 0.36 5-6-1 8.6947 0.9708 0.99127.3057–6.9822–0.61142.9043 –40.253 –0.16 5-2-2-1 28.6140 0.6842 0.8327.90180.61660.8119.4920 0.2325 0.63 5-4-5-1 18.1824 0.8725 0.9344.78180.01230.6175.2239 –10.430 0.13 5-6-7-1 9.9741 0.9616 0.9896.0710–3.54580.51147.6428 –43.034 0.05 1) Model ANNPAM1: The performance of this model has been presented in Table 5(a) and RMSE of the re- sults for training, validation and cross-validation are shown in Figure 4(a). For this model, RMSE was in the range of 21.17-37.17 and Nash-Sutcliffe efficiency was in the range of 0.632-0.815 for different NN architecture. The best identified NN architecture was 1-4-5-1 for which RMSE was in the range of 21.17-30.54 and Nash-Sutcliffe efficiency was in the range of 0.718-0.798. The NN architecture performed 1-1-1 the worst for which RMSE was in the range of 22.76-37.17 and Nash- Sutcliffe efficiency was in the range of 0.632-0.767. 2) Model ANNPAM2: The performance of this model has been presented in Table 5(b) and RMSE of the re- sults for training, validation and cross-validation are shown in Figure 4(b). For this model, RMSE was in the range of 19.99-36.49 and Nash-Sutcliffe efficiency was in the range of 0.413-0.840 for different NN architecture. The best identified NN architecture was 2-1-1 for which RMSE was in the range of 19.99-36.49 and Nash- Sutcliffe efficiency was in the range of 0.645-0.819. The NN architecture 2-6-7-1 performed the worst for which RMSE was in the range of 24.45-31.05 and Nash- Sutcliffe efficiency was in the range of 0.694-0.840. 3) Model ANNPAM3: The performance of this model has been presented in Table 5(c) and RMSE of the re- sults for training, validation and cross-validation are shown in Figure 4(c). RMSE was in the range of 18.89- 36.26 for different NN architecture for this model. The best identified NN architecture was 3-4-5-1 for which RMSE was in the range of 18.89-27.42 and Nash-Sut- cliffe efficiency was in the range of 0.762-0.856.The NN architecture 3-1-1 performed the worst for which RMSE was in the range of 21.07-36.26 and Nash-Sutcliffe effi- ciency was in the range of 0.650-0.800. 4) Model ANNPAM4: The performance of this model has been presented in Table 5(d) and RMSE of the re- sults for training, validation and cross-validation are shown in Figure 4(d). RMSE was in the range of 18.70-36.25 for different NN architecture for this model. The best identified NN architecture was 4-6-1 for which RMSE was in the range of was 18.70-31.30 and Nash- Sutcliffe efficiency was in the range of 0.689-0.907.The NN architecture performed 4-1-1 the worst for which RMSE was in the range of 20.19-36.25 and Nash-Sut- cliffe efficiency was in the range of 0.650-0.803. 5) Model ANNPAM5: The performance of this model has been presented in Table 5(e) and RMSE of the re- sults for training, validation and cross-validation are shown in Figure 4(e). RMSE was in the range of 8.69-147.64 for different NN architecture for this model. The best identified NN architecture was 5-2-2-1 for which RMSE was in the range of was19.40-28.61 and Nash-Sutcliffe efficiency was in the range of 0.23-0.68. Based on these results, it can be inferred that NN ar- chitecture 4-6-1 performs the best for which RMSE was 18.70, 31.30, 23.87, Nash-Sutcliffe efficiency was 0.907, 0.689, 0.743 and CC was 0.95, 0.83, 0.86 for training, validation and cross validation set respectively. ANN with BPLVM Using Dimensionless Variable Using the input dimensionless variables defined in the model ANNDAM1 and ANNDAM2; the ANN models have been trained using Levenberg-Marquardt algorithm (BPLVM) for different ANN architectures. The per- formance statistics of the results for all the models used with different architectures have been summarized in Tables 6(a) and (b). The trends of the RMSE for different architectures have been shown in Figures 5(a) and (b). 1) Model ANNDAM1: The performance of this model has been presented in Table 6(a) and RMSE of the re- sults for training, validation and cross-validation are shown in Figure 5(a). For this model ANNDAM1, RMSE was in the range of 2.13-6.88 and Nash-Sutcliffe effi- ciency was in the range of (–0.65)-0.927 for different NN architecture. For NN architecture 3-1-1, RMSE was 2.86, 4.86 and 3.85 and Nash-Sutcliffe efficiency was 0.762, 0.209 and 0.489 for training, validation and cross valida- tion set respectively. For NN architecture 3-3-1, RMSE was 3.10, 6.60 and 6.93 and Nash-Sutcliffe efficiency was 0.845, –0.460 and –0.657 for training, validation and  Analysis of Mean Monthly Rainfall Runoff Data of Indian Catchments Using Dimensionless Variables by Neural Network 162 (a) (b) (c) (d) Copyright © 2010 SciRes. JEP 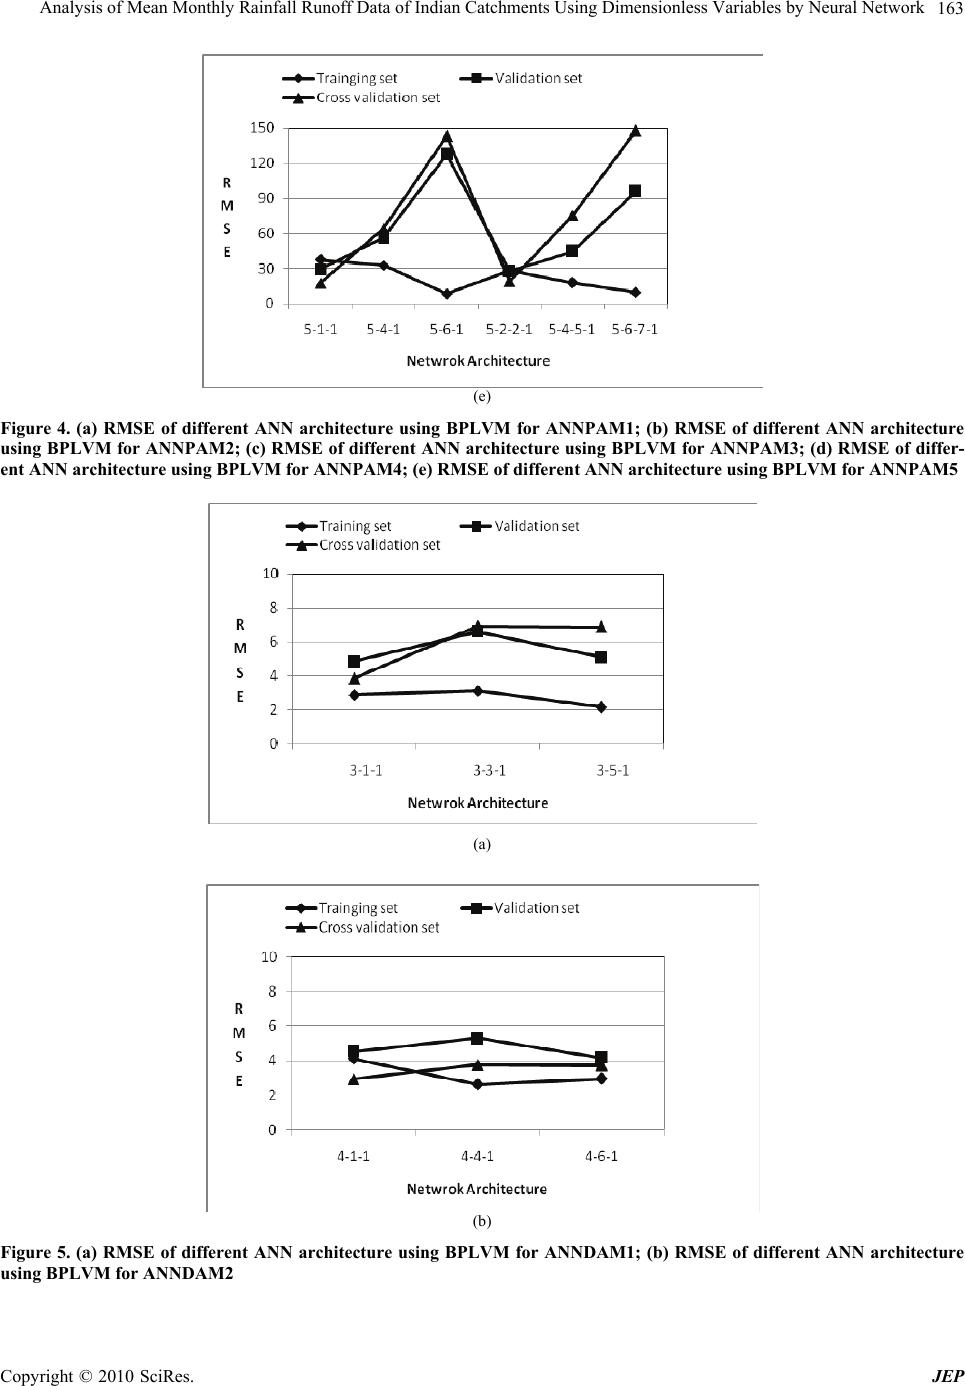 Analysis of Mean Monthly Rainfall Runoff Data of Indian Catchments Using Dimensionless Variables by Neural Network163 (e) Figure 4. (a) RMSE of different ANN architecture using BPLVM for ANNPAM1; (b) RMSE of different ANN architecture using BPLVM for ANNPAM2; (c) RMSE of different ANN architecture using BPLVM for ANNPAM3; (d) RMSE of differ- ent ANN architecture using BPLVM for ANNPAM4; (e) RMSE of different ANN architecture using BPLVM for ANNPAM5 (a) (b) Figure 5. (a) RMSE of different ANN architecture using BPLVM for ANNDAM1; (b) RMSE of different ANN architecture using BPLVM for ANNDAM2 Copyright © 2010 SciRes. JEP 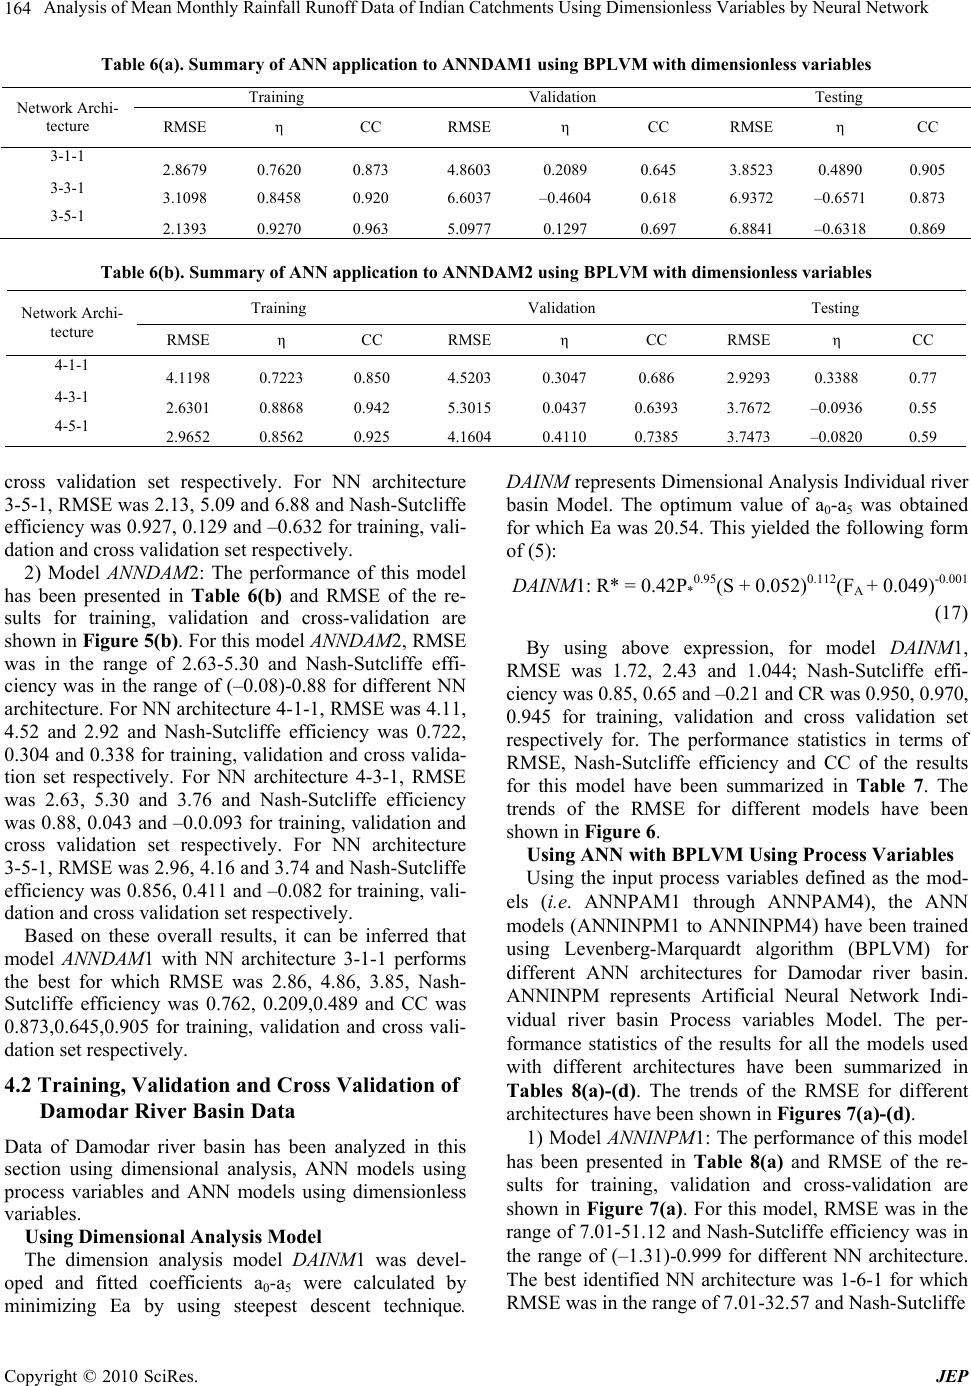 Analysis of Mean Monthly Rainfall Runoff Data of Indian Catchments Using Dimensionless Variables by Neural Network Copyright © 2010 SciRes. JEP 164 Table 6(a). Summary of ANN application to ANNDAM1 using BPLVM with dimensionless variables Training Validation Testing Network Archi- tecture RMSE η CC RMSE η CC RMSE η CC 3-1-1 2.8679 0.7620 0.873 4.8603 0.2089 0.645 3.8523 0.4890 0.905 3-3-1 3.1098 0.8458 0.920 6.6037 –0.4604 0.618 6.9372 –0.6571 0.873 3-5-1 2.1393 0.9270 0.963 5.0977 0.1297 0.697 6.8841 –0.6318 0.869 Table 6(b). Summary of ANN application to ANNDAM2 using BPLVM with dimensionless variables Training Validation Testing Network Archi- tecture RMSE η CC RMSE η CC RMSE η CC 4-1-1 4.1198 0.7223 0.850 4.5203 0.3047 0.686 2.9293 0.3388 0.77 4-3-1 2.6301 0.8868 0.942 5.3015 0.0437 0.6393 3.7672 –0.0936 0.55 4-5-1 2.9652 0.8562 0.925 4.1604 0.4110 0.7385 3.7473 –0.0820 0.59 cross validation set respectively. For NN architecture 3-5-1, RMSE was 2.13, 5.09 and 6.88 and Nash-Sutcliffe efficiency was 0.927, 0.129 and –0.632 for training, vali- dation and cross validation set respectively. 2) Model ANNDAM2: The performance of this model has been presented in Table 6(b) and RMSE of the re- sults for training, validation and cross-validation are shown in Figure 5(b). For this model ANNDAM2, RMSE was in the range of 2.63-5.30 and Nash-Sutcliffe effi- ciency was in the range of (–0.08)-0.88 for different NN architecture. For NN architecture 4-1-1, RMSE was 4.11, 4.52 and 2.92 and Nash-Sutcliffe efficiency was 0.722, 0.304 and 0.338 for training, validation and cross valida- tion set respectively. For NN architecture 4-3-1, RMSE was 2.63, 5.30 and 3.76 and Nash-Sutcliffe efficiency was 0.88, 0.043 and –0.0.093 for training, validation and cross validation set respectively. For NN architecture 3-5-1, RMSE was 2.96, 4.16 and 3.74 and Nash-Sutcliffe efficiency was 0.856, 0.411 and –0.082 for training, vali- dation and cross validation set respectively. Based on these overall results, it can be inferred that model ANNDAM1 with NN architecture 3-1-1 performs the best for which RMSE was 2.86, 4.86, 3.85, Nash- Sutcliffe efficiency was 0.762, 0.209,0.489 and CC was 0.873,0.645,0.905 for training, validation and cross vali- dation set respectively. 4.2 Training, Validation and Cross Validation of Damodar River Basin Data Data of Damodar river basin has been analyzed in this section using dimensional analysis, ANN models using process variables and ANN models using dimensionless variables. Using Dimensional Analysis Model The dimension analysis model DAINM1 was devel- oped and fitted coefficients a0-a5 were calculated by minimizing Ea by using steepest descent technique. DAINM represents Dimensional Analysis Individual river basin Model. The optimum value of a0-a5 was obtained for which Ea was 20.54. This yielded the following form of (5): DAINM1: R* = 0.42P*0.95(S + 0.052)0.112(FA + 0.049)-0.001 (17) By using above expression, for model DAINM1, RMSE was 1.72, 2.43 and 1.044; Nash-Sutcliffe effi- ciency was 0.85, 0.65 and –0.21 and CR was 0.950, 0.970, 0.945 for training, validation and cross validation set respectively for. The performance statistics in terms of RMSE, Nash-Sutcliffe efficiency and CC of the results for this model have been summarized in Table 7. The trends of the RMSE for different models have been shown in Figure 6. Using ANN with BPLVM Using Process Variables Using the input process variables defined as the mod- els (i.e. ANNPAM1 through ANNPAM4), the ANN models (ANNINPM1 to ANNINPM4) have been trained using Levenberg-Marquardt algorithm (BPLVM) for different ANN architectures for Damodar river basin. ANNINPM represents Artificial Neural Network Indi- vidual river basin Process variables Model. The per- formance statistics of the results for all the models used with different architectures have been summarized in Tables 8(a)-(d). The trends of the RMSE for different architectures have been shown in Figures 7(a)-(d). 1) Model ANNINPM1: The performance of this model has been presented in Table 8(a) and RMSE of the re- sults for training, validation and cross-validation are shown in Figure 7(a). For this model, RMSE was in the range of 7.01-51.12 and Nash-Sutcliffe efficiency was in the range of (–1.31)-0.999 for different NN architecture. The best identified NN architecture was 1-6-1 for which RMSE was in the range of 7.01-32.57 and Nash-Sutcliffe 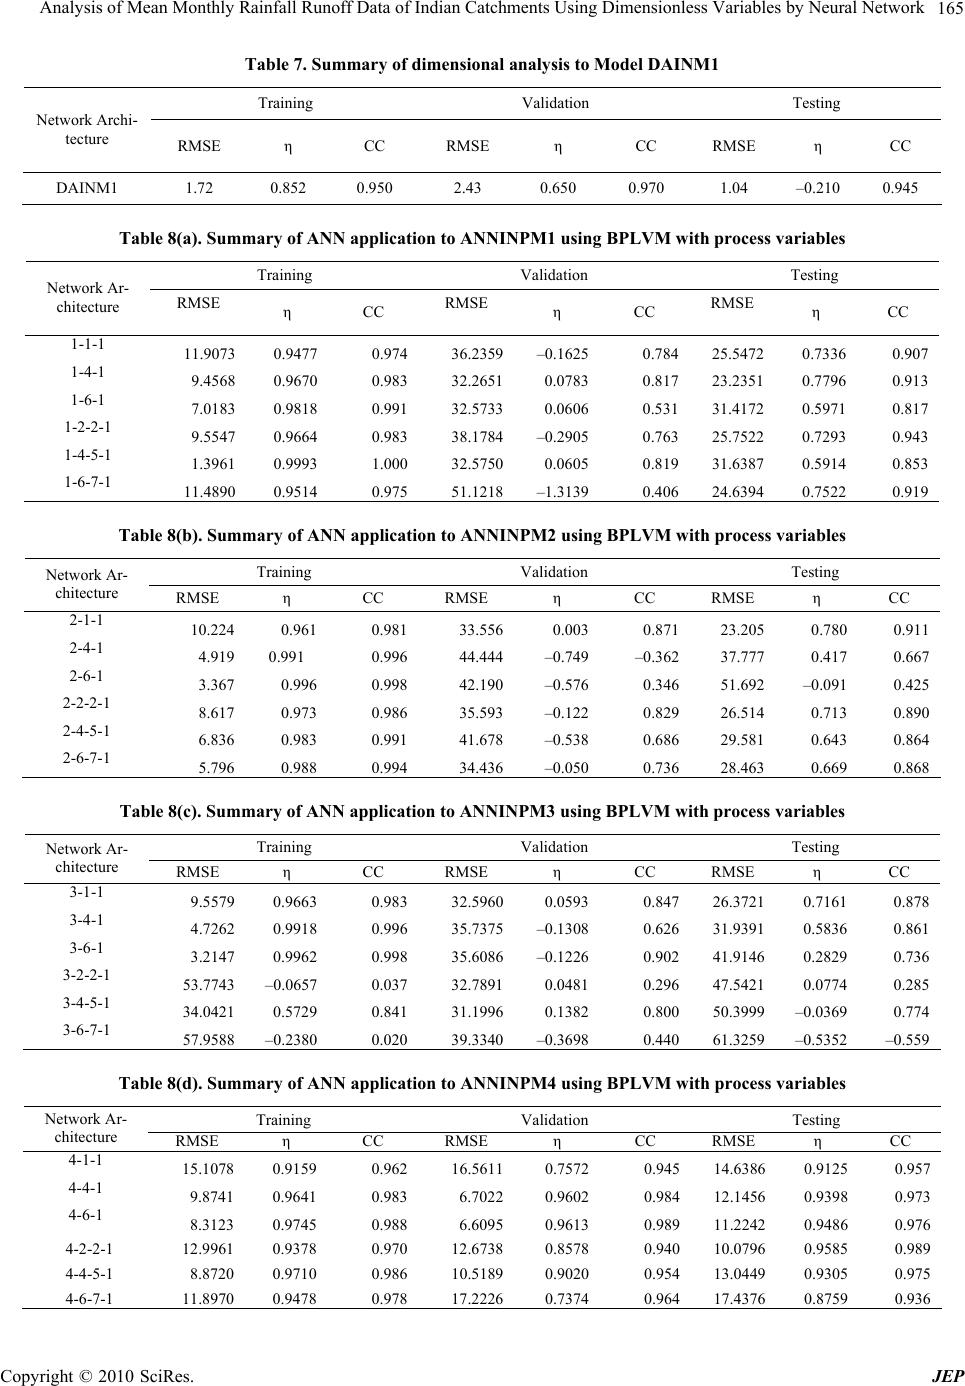 Analysis of Mean Monthly Rainfall Runoff Data of Indian Catchments Using Dimensionless Variables by Neural Network 165 Table 7. Summary of dimensional analysis to Model DAINM1 Training Validation Testing Network Archi- tecture RMSE η CC RMSE η CC RMSE η CC DAINM1 1.72 0.852 0.950 2.43 0.650 0.970 1.04 –0.210 0.945 Table 8(a). Summary of ANN application to ANNINPM1 using BPLVM with process variables Training Validation Testing Network Ar- chitecture RMSE η CC RMSE η CC RMSE η CC 1-1-1 11.9073 0.9477 0.97436.2359–0.16250.78425.5472 0.7336 0.907 1-4-1 9.4568 0.9670 0.98332.26510.07830.81723.2351 0.7796 0.913 1-6-1 7.0183 0.9818 0.99132.57330.06060.53131.4172 0.5971 0.817 1-2-2-1 9.5547 0.9664 0.98338.1784–0.29050.76325.7522 0.7293 0.943 1-4-5-1 1.3961 0.9993 1.00032.57500.06050.81931.6387 0.5914 0.853 1-6-7-1 11.4890 0.9514 0.97551.1218–1.31390.40624.6394 0.7522 0.919 Table 8(b). Summary of ANN application to ANNINPM2 using BPLVM with process variables Training Validation Testing Network Ar- chitecture RMSE η CC RMSE η CC RMSE η CC 2-1-1 10.224 0.961 0.98133.5560.0030.87123.205 0.780 0.911 2-4-1 4.919 0.991 0.99644.444–0.749–0.36237.777 0.417 0.667 2-6-1 3.367 0.996 0.99842.190–0.5760.34651.692 –0.091 0.425 2-2-2-1 8.617 0.973 0.98635.593–0.1220.82926.514 0.713 0.890 2-4-5-1 6.836 0.983 0.99141.678–0.5380.68629.581 0.643 0.864 2-6-7-1 5.796 0.988 0.99434.436–0.0500.73628.463 0.669 0.868 Table 8(c). Summary of ANN application to ANNINPM3 using BPLVM with process variables Training Validation Testing Network Ar- chitecture RMSE η CC RMSE η CC RMSE η CC 3-1-1 9.5579 0.9663 0.98332.59600.05930.84726.3721 0.7161 0.878 3-4-1 4.7262 0.9918 0.99635.7375–0.13080.62631.9391 0.5836 0.861 3-6-1 3.2147 0.9962 0.99835.6086–0.12260.90241.9146 0.2829 0.736 3-2-2-1 53.7743 –0.0657 0.03732.78910.04810.29647.5421 0.0774 0.285 3-4-5-1 34.0421 0.5729 0.84131.19960.13820.80050.3999 –0.0369 0.774 3-6-7-1 57.9588 –0.2380 0.02039.3340–0.36980.44061.3259 –0.5352 –0.559 Table 8(d). Summary of ANN application to ANNINPM4 using BPLVM with process variables Training Validation Testing Network Ar- chitecture RMSE η CC RMSE η CC RMSE η CC 4-1-1 15.1078 0.9159 0.96216.56110.75720.94514.6386 0.9125 0.957 4-4-1 9.8741 0.9641 0.9836.70220.96020.98412.1456 0.9398 0.973 4-6-1 8.3123 0.9745 0.9886.60950.96130.98911.2242 0.9486 0.976 4-2-2-1 12.9961 0.9378 0.97012.67380.85780.94010.0796 0.9585 0.989 4-4-5-1 8.8720 0.9710 0.98610.51890.90200.95413.0449 0.9305 0.975 4-6-7-1 11.8970 0.9478 0.97817.22260.73740.96417.4376 0.8759 0.936 Copyright © 2010 SciRes. JEP 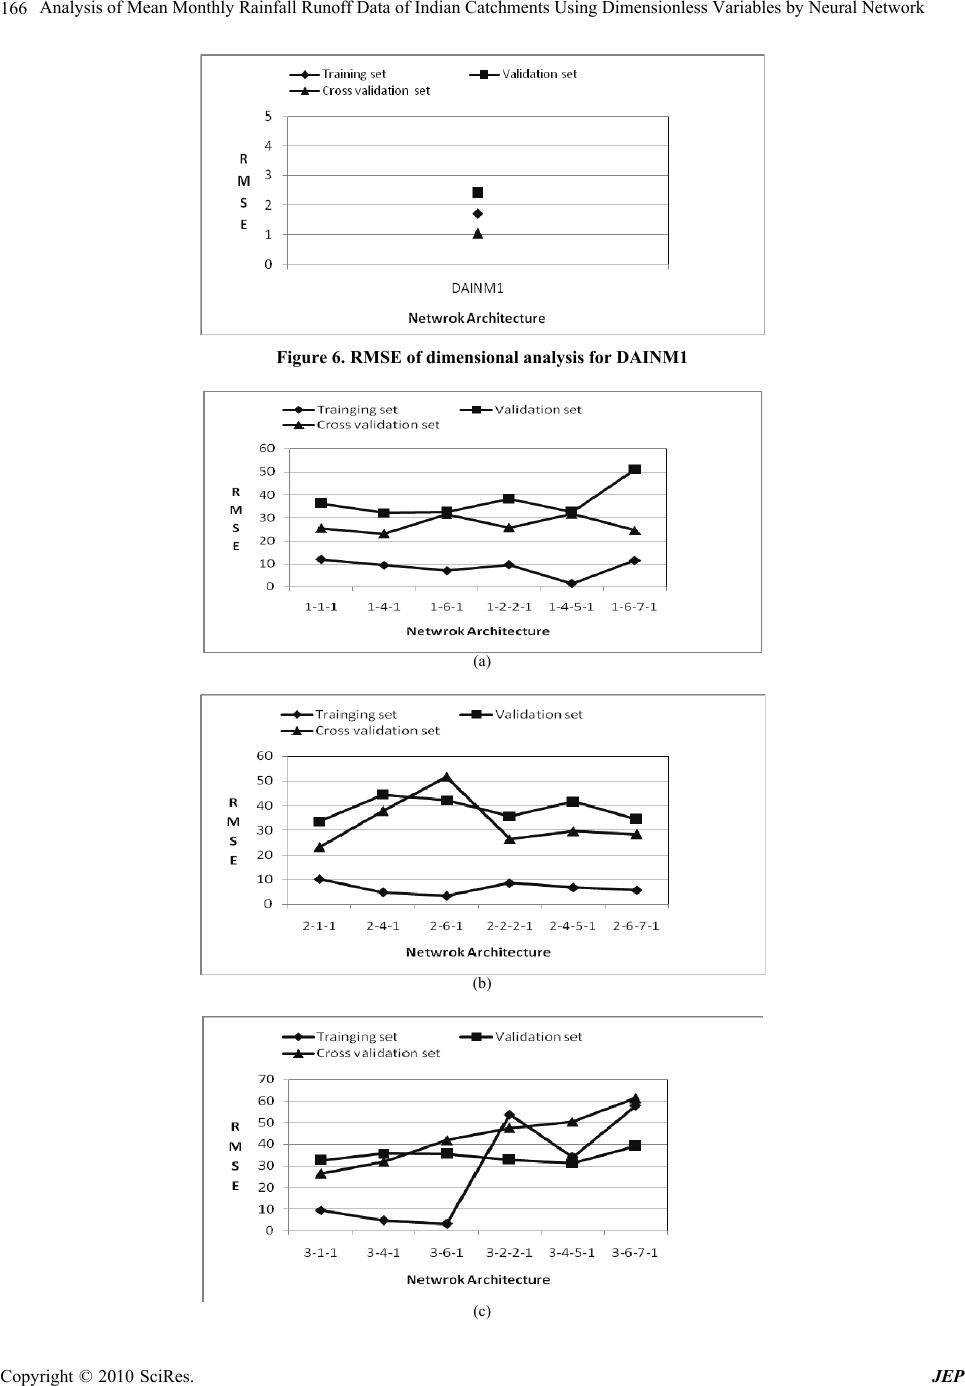 Analysis of Mean Monthly Rainfall Runoff Data of Indian Catchments Using Dimensionless Variables by Neural Network 166 Figure 6. RMSE of dimensional analysis for DAINM1 (a) (b) (c) Copyright © 2010 SciRes. JEP 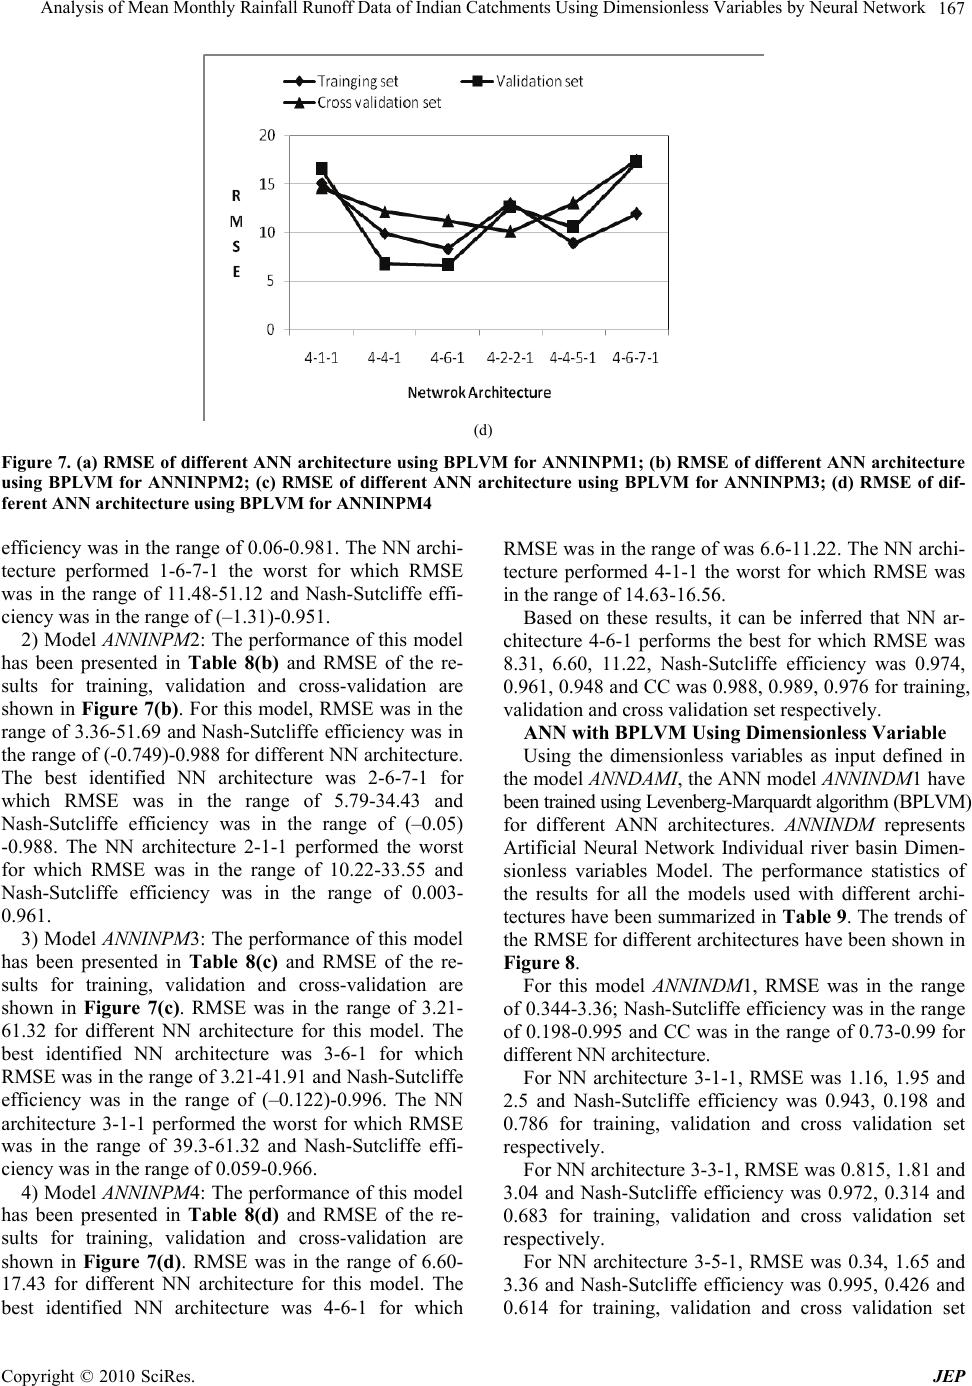 Analysis of Mean Monthly Rainfall Runoff Data of Indian Catchments Using Dimensionless Variables by Neural Network Copyright © 2010 SciRes. JEP 167 (d) Figure 7. (a) RMSE of different ANN architecture using BPLVM for ANNINPM1; (b) RMSE of different ANN architecture using BPLVM for ANNINPM2; (c) RMSE of different ANN architecture using BPLVM for ANNINPM3; (d) RMSE of dif- ferent ANN architecture using BPLVM for ANNINPM4 efficiency was in the range of 0.06-0.981. The NN archi- tecture performed 1-6-7-1 the worst for which RMSE was in the range of 11.48-51.12 and Nash-Sutcliffe effi- ciency was in the range of (–1.31)-0.951. 2) Model ANNINPM2: The performance of this model has been presented in Table 8(b) and RMSE of the re- sults for training, validation and cross-validation are shown in Figure 7(b). For this model, RMSE was in the range of 3.36-51.69 and Nash-Sutcliffe efficiency was in the range of (-0.749)-0.988 for different NN architecture. The best identified NN architecture was 2-6-7-1 for which RMSE was in the range of 5.79-34.43 and Nash-Sutcliffe efficiency was in the range of (–0.05) -0.988. The NN architecture 2-1-1 performed the worst for which RMSE was in the range of 10.22-33.55 and Nash-Sutcliffe efficiency was in the range of 0.003- 0.961. 3) Model ANNINPM3: The performance of this model has been presented in Table 8(c) and RMSE of the re- sults for training, validation and cross-validation are shown in Figure 7(c). RMSE was in the range of 3.21- 61.32 for different NN architecture for this model. The best identified NN architecture was 3-6-1 for which RMSE was in the range of 3.21-41.91 and Nash-Sutcliffe efficiency was in the range of (–0.122)-0.996. The NN architecture 3-1-1 performed the worst for which RMSE was in the range of 39.3-61.32 and Nash-Sutcliffe effi- ciency was in the range of 0.059-0.966. 4) Model ANNINPM4: The performance of this model has been presented in Table 8(d) and RMSE of the re- sults for training, validation and cross-validation are shown in Figure 7(d). RMSE was in the range of 6.60- 17.43 for different NN architecture for this model. The best identified NN architecture was 4-6-1 for which RMSE was in the range of was 6.6-11.22. The NN archi- tecture performed 4-1-1 the worst for which RMSE was in the range of 14.63-16.56. Based on these results, it can be inferred that NN ar- chitecture 4-6-1 performs the best for which RMSE was 8.31, 6.60, 11.22, Nash-Sutcliffe efficiency was 0.974, 0.961, 0.948 and CC was 0.988, 0.989, 0.976 for training, validation and cross validation set respectively. ANN with BPLVM Using Dimensionless Variable Using the dimensionless variables as input defined in the model ANNDAMI, the ANN model ANNINDM1 have been trained using Levenberg-Marquardt algorithm (BPLVM) for different ANN architectures. ANNINDM represents Artificial Neural Network Individual river basin Dimen- sionless variables Model. The performance statistics of the results for all the models used with different archi- tectures have been summarized in Table 9. The trends of the RMSE for different architectures have been shown in Figure 8. For this model ANNINDM1, RMSE was in the range of 0.344-3.36; Nash-Sutcliffe efficiency was in the range of 0.198-0.995 and CC was in the range of 0.73-0.99 for different NN architecture. For NN architecture 3-1-1, RMSE was 1.16, 1.95 and 2.5 and Nash-Sutcliffe efficiency was 0.943, 0.198 and 0.786 for training, validation and cross validation set respectively. For NN architecture 3-3-1, RMSE was 0.815, 1.81 and 3.04 and Nash-Sutcliffe efficiency was 0.972, 0.314 and 0.683 for training, validation and cross validation set respectively. For NN architecture 3-5-1, RMSE was 0.34, 1.65 and 3.36 and Nash-Sutcliffe efficiency was 0.995, 0.426 and 0.614 for training, validation and cross validation set 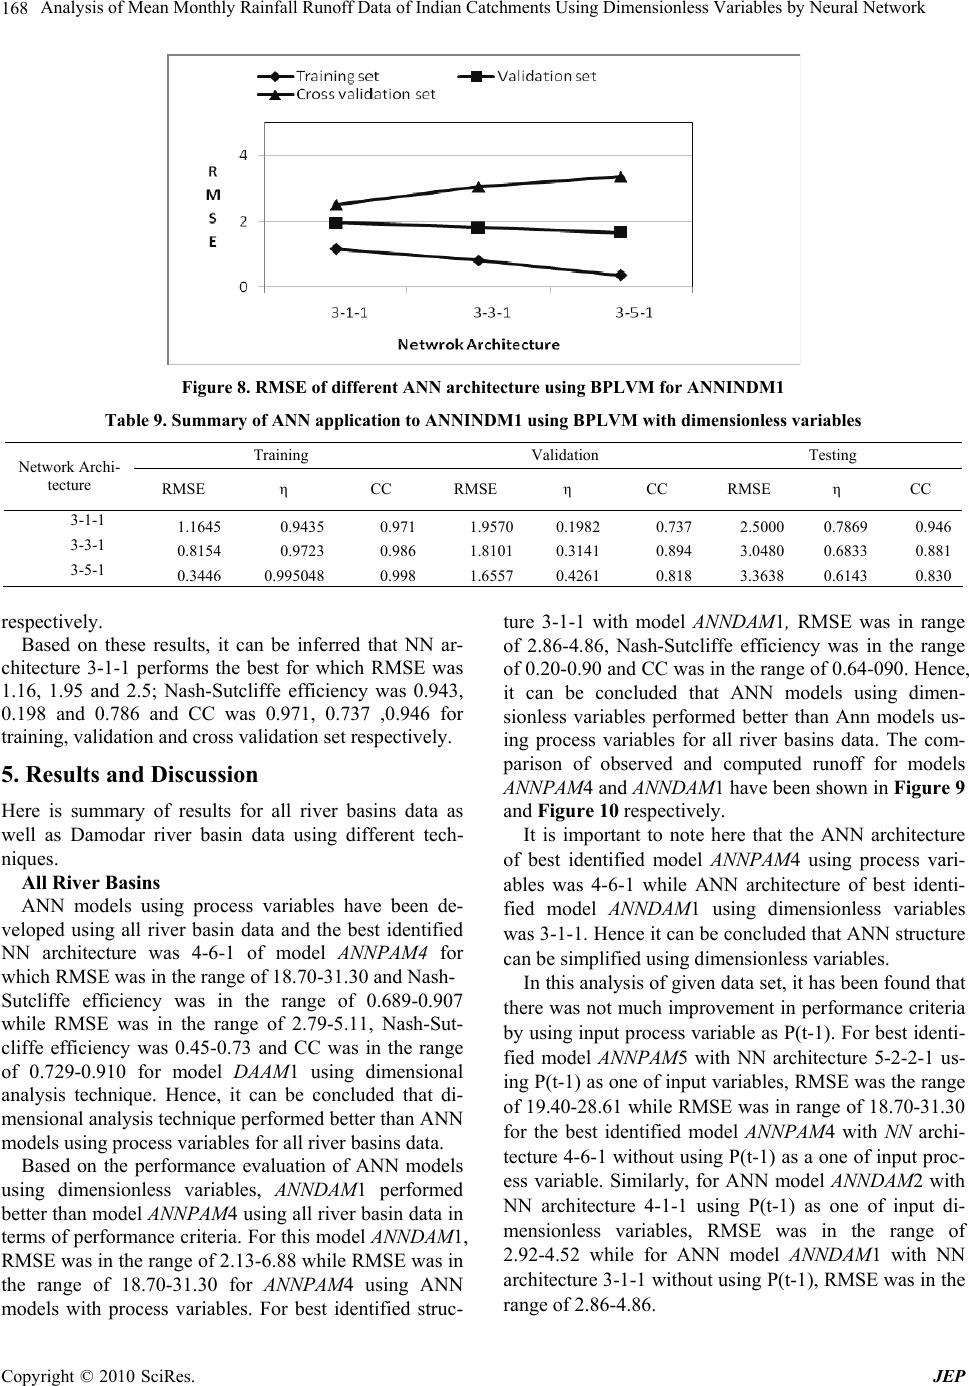 Analysis of Mean Monthly Rainfall Runoff Data of Indian Catchments Using Dimensionless Variables by Neural Network 168 Figure 8. RMSE of different ANN architecture using BPLVM for ANNINDM1 Table 9. Summary of ANN application to ANNINDM1 using BPLVM with dimensionless variables Training Validation Testing Network Archi- tecture RMSE η CC RMSE η CC RMSE η CC 3-1-1 1.1645 0.9435 0.9711.95700.19820.7372.5000 0.7869 0.946 3-3-1 0.8154 0.9723 0.9861.81010.31410.8943.0480 0.6833 0.881 3-5-1 0.3446 0.995048 0.9981.65570.42610.8183.3638 0.6143 0.830 respectively. Based on these results, it can be inferred that NN ar- chitecture 3-1-1 performs the best for which RMSE was 1.16, 1.95 and 2.5; Nash-Sutcliffe efficiency was 0.943, 0.198 and 0.786 and CC was 0.971, 0.737 ,0.946 for training, validation and cross validation set respectively. 5. Results and Discussion Here is summary of results for all river basins data as well as Damodar river basin data using different tech- niques. All River Basins ANN models using process variables have been de- veloped using all river basin data and the best identified NN architecture was 4-6-1 of model ANNPAM4 for which RMSE was in the range of 18.70-31.30 and Nash- Sutcliffe efficiency was in the range of 0.689-0.907 while RMSE was in the range of 2.79-5.11, Nash-Sut- cliffe efficiency was 0.45-0.73 and CC was in the range of 0.729-0.910 for model DAAM1 using dimensional analysis technique. Hence, it can be concluded that di- mensional analysis technique performed better than ANN models using process variables for all river basins data. Based on the performance evaluation of ANN models using dimensionless variables, ANNDAM1 performed better than model ANNPAM4 using all river basin data in terms of performance criteria. For this model ANNDAM1, RMSE was in the range of 2.13-6.88 while RMSE was in the range of 18.70-31.30 for ANNPAM4 using ANN models with process variables. For best identified struc- ture 3-1-1 with model ANNDAM1, RMSE was in range of 2.86-4.86, Nash-Sutcliffe efficiency was in the range of 0.20-0.90 and CC was in the range of 0.64-090. Hence, it can be concluded that ANN models using dimen- sionless variables performed better than Ann models us- ing process variables for all river basins data. The com- parison of observed and computed runoff for models ANNPAM4 and ANNDAM1 have been shown in Figure 9 and Figure 10 respectively. It is important to note here that the ANN architecture of best identified model ANNPAM4 using process vari- ables was 4-6-1 while ANN architecture of best identi- fied model ANNDAM1 using dimensionless variables was 3-1-1. Hence it can be concluded that ANN structure can be simplified using dimensionless variables. In this analysis of given data set, it has been found that there was not much improvement in performance criteria by using input process variable as P(t-1). For best identi- fied model ANNPAM5 with NN architecture 5-2-2-1 us- ing P(t-1) as one of input variables, RMSE was the range of 19.40-28.61 while RMSE was in range of 18.70-31.30 for the best identified model ANNPAM4 with NN archi- tecture 4-6-1 without using P(t-1) as a one of input proc- ess variable. Similarly, for ANN model ANNDAM2 with NN architecture 4-1-1 using P(t-1) as one of input di- mensionless variables, RMSE was in the range of 2.92-4.52 while for ANN model ANNDAM1 with NN architecture 3-1-1 without using P(t-1), RMSE was in the range of 2.86-4.86. Copyright © 2010 SciRes. JEP 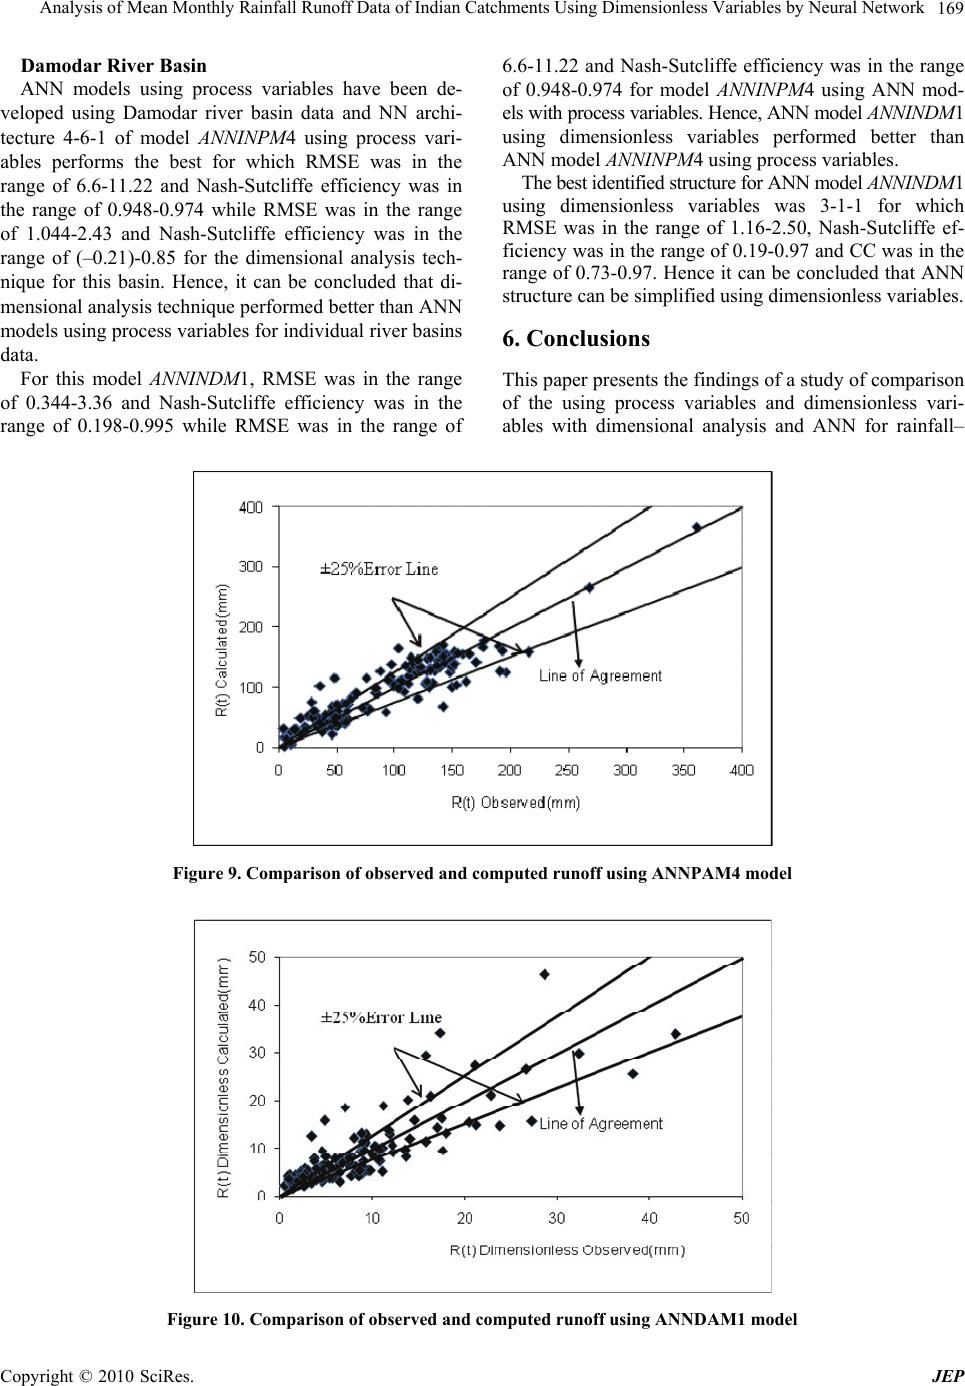 Analysis of Mean Monthly Rainfall Runoff Data of Indian Catchments Using Dimensionless Variables by Neural Network169 Damodar River Basin ANN models using process variables have been de- veloped using Damodar river basin data and NN archi- tecture 4-6-1 of model ANNINPM4 using process vari- ables performs the best for which RMSE was in the range of 6.6-11.22 and Nash-Sutcliffe efficiency was in the range of 0.948-0.974 while RMSE was in the range of 1.044-2.43 and Nash-Sutcliffe efficiency was in the range of (–0.21)-0.85 for the dimensional analysis tech- nique for this basin. Hence, it can be concluded that di- mensional analysis technique performed better than ANN models using process variables for individual river basins data. For this model ANNINDM1, RMSE was in the range of 0.344-3.36 and Nash-Sutcliffe efficiency was in the range of 0.198-0.995 while RMSE was in the range of 6.6-11.22 and Nash-Sutcliffe efficiency was in the range of 0.948-0.974 for model ANNINPM4 using ANN mod- els with process variables. Hence, ANN model ANNINDM1 using dimensionless variables performed better than ANN model ANNINPM4 using process variables. The best identified structure for ANN model ANNINDM1 using dimensionless variables was 3-1-1 for which RMSE was in the range of 1.16-2.50, Nash-Sutcliffe ef- ficiency was in the range of 0.19-0.97 and CC was in the range of 0.73-0.97. Hence it can be concluded that ANN structure can be simplified using dimensionless variables. 6. Conclusions This paper presents the findings of a study of comparison of the using process variables and dimensionless vari- ables with dimensional analysis and ANN for rainfall– Figure 9. Comparison of observed and computed runoff using ANNPAM4 model Figure 10. Comparison of observed and computed runoff using ANNDAM1 model Copyright © 2010 SciRes. JEP 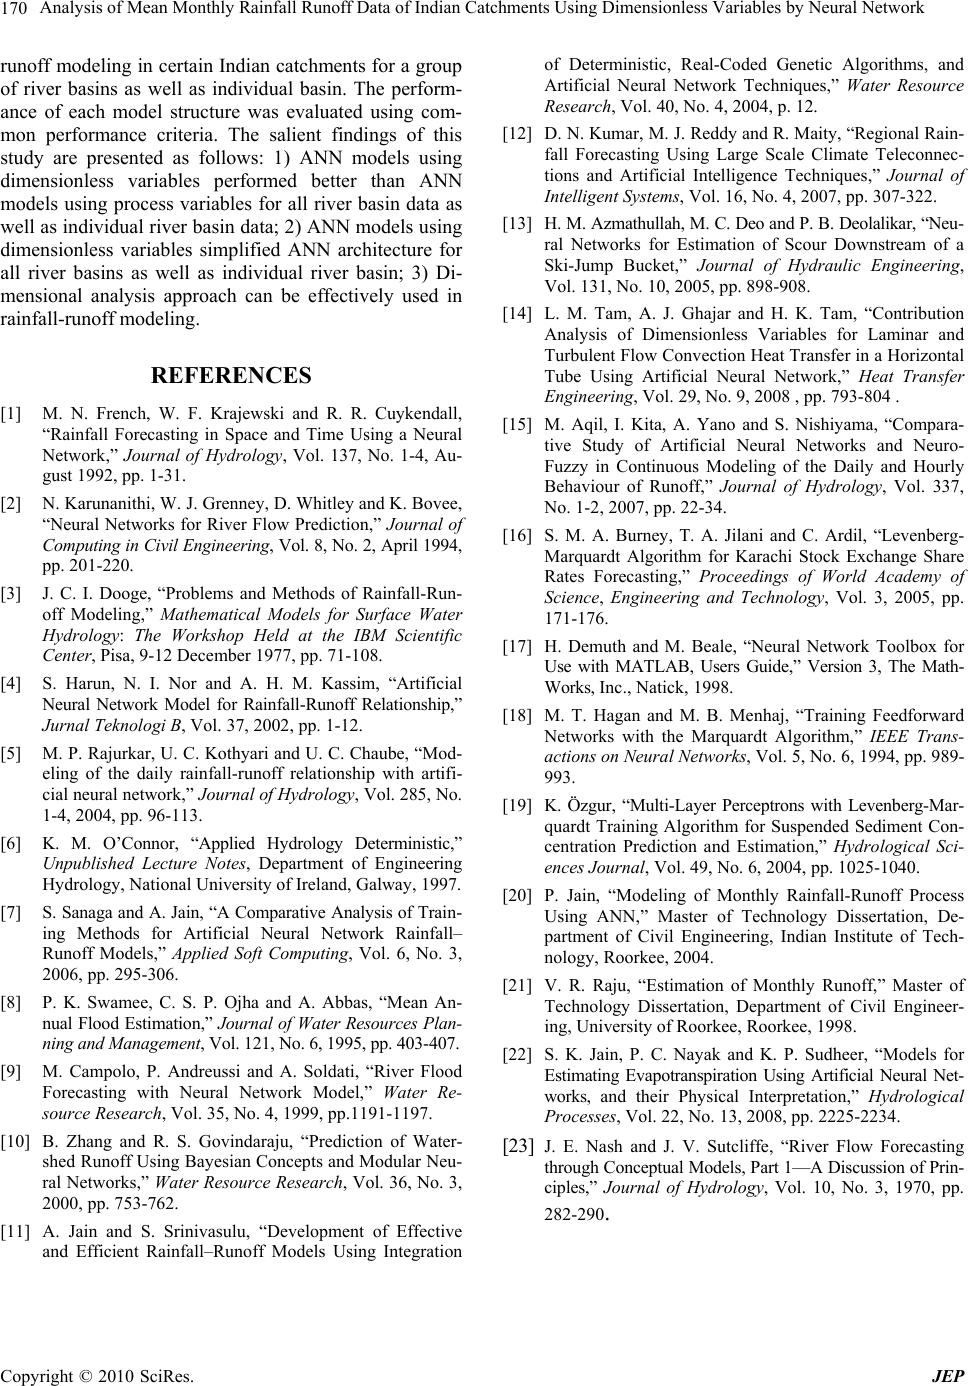 Analysis of Mean Monthly Rainfall Runoff Data of Indian Catchments Using Dimensionless Variables by Neural Network 170 runoff modeling in certain Indian catchments for a group of river basins as well as individual basin. The perform- ance of each model structure was evaluated using com- mon performance criteria. The salient findings of this study are presented as follows: 1) ANN models using dimensionless variables performed better than ANN models using process variables for all river basin data as well as individual river basin data; 2) ANN models using dimensionless variables simplified ANN architecture for all river basins as well as individual river basin; 3) Di- mensional analysis approach can be effectively used in rainfall-runoff modeling. REFERENCES [1] M. N. French, W. F. Krajewski and R. R. Cuykendall, “Rainfall Forecasting in Space and Time Using a Neural Network,” Journal of Hydrology, Vol. 137, No. 1-4, Au- gust 1992, pp. 1-31. [2] N. Karunanithi, W. J. Grenney, D. Whitley and K. Bovee, “Neural Networks for River Flow Prediction,” Journal of Computing in Civil Engineering, Vol. 8, No. 2, April 1994, pp. 201-220. [3] J. C. I. Dooge, “Problems and Methods of Rainfall-Run- off Modeling,” Mathematical Models for Surface Water Hydrology: The Workshop Held at the IBM Scientific Center, Pisa, 9-12 December 1977, pp. 71-108. [4] S. Harun, N. I. Nor and A. H. M. Kassim, “Artificial Neural Network Model for Rainfall-Runoff Relationship,” Jurnal Teknologi B, Vol. 37, 2002, pp. 1-12. [5] M. P. Rajurkar, U. C. Kothyari and U. C. Chaube, “Mod- eling of the daily rainfall-runoff relationship with artifi- cial neural network,” Journal of Hydrology, Vol. 285, No. 1-4, 2004, pp. 96-113. [6] K. M. O’Connor, “Applied Hydrology Deterministic,” Unpublished Lecture Notes, Department of Engineering Hydrology, National University of Ireland, Galway, 1997. [7] S. Sanaga and A. Jain, “A Comparative Analysis of Train- ing Methods for Artificial Neural Network Rainfall– Runoff Models,” Applied Soft Computing, Vol. 6, No. 3, 2006, pp. 295-306. [8] P. K. Swamee, C. S. P. Ojha and A. Abbas, “Mean An- nual Flood Estimation,” Journal of Water Resources Plan- ning and Management, Vol. 121, No. 6, 1995, pp. 403-407. [9] M. Campolo, P. Andreussi and A. Soldati, “River Flood Forecasting with Neural Network Model,” Water Re- source Research, Vol. 35, No. 4, 1999, pp.1191-1197. [10] B. Zhang and R. S. Govindaraju, “Prediction of Water- shed Runoff Using Bayesian Concepts and Modular Neu- ral Networks,” Water Resource Research, Vol. 36, No. 3, 2000, pp. 753-762. [11] A. Jain and S. Srinivasulu, “Development of Effective and Efficient Rainfall–Runoff Models Using Integration of Deterministic, Real-Coded Genetic Algorithms, and Artificial Neural Network Techniques,” Water Resource Research, Vol. 40, No. 4, 2004, p. 12. [12] D. N. Kumar, M. J. Reddy and R. Maity, “Regional Rain- fall Forecasting Using Large Scale Climate Teleconnec- tions and Artificial Intelligence Techniques,” Journal of Intelligent Systems, Vol. 16, No. 4, 2007, pp. 307-322. [13] H. M. Azmathullah, M. C. Deo and P. B. Deolalikar, “Neu- ral Networks for Estimation of Scour Downstream of a Ski-Jump Bucket,” Journal of Hydraulic Engineering, Vol. 131, No. 10, 2005, pp. 898-908. [14] L. M. Tam, A. J. Ghajar and H. K. Tam, “Contribution Analysis of Dimensionless Variables for Laminar and Turbulent Flow Convection Heat Transfer in a Horizontal Tube Using Artificial Neural Network,” Heat Transfer Engineering, Vol. 29, No. 9, 2008 , pp. 793-804 . [15] M. Aqil, I. Kita, A. Yano and S. Nishiyama, “Compara- tive Study of Artificial Neural Networks and Neuro- Fuzzy in Continuous Modeling of the Daily and Hourly Behaviour of Runoff,” Journal of Hydrology, Vol. 337, No. 1-2, 2007, pp. 22-34. [16] S. M. A. Burney, T. A. Jilani and C. Ardil, “Levenberg- Marquardt Algorithm for Karachi Stock Exchange Share Rates Forecasting,” Proceedings of World Academy of Science, Engineering and Technology, Vol. 3, 2005, pp. 171-176. [17] H. Demuth and M. Beale, “Neural Network Toolbox for Use with MATLAB, Users Guide,” Version 3, The Math- Works, Inc., Natick, 1998. [18] M. T. Hagan and M. B. Menhaj, “Training Feedforward Networks with the Marquardt Algorithm,” IEEE Trans- actions on Neural Networks, Vol. 5, No. 6, 1994, pp. 989- 993. [19] K. Özgur, “Multi-Layer Perceptrons with Levenberg-Mar- quardt Training Algorithm for Suspended Sediment Con- centration Prediction and Estimation,” Hydrological Sci- ences Journal, Vol. 49, No. 6, 2004, pp. 1025-1040. [20] P. Jain, “Modeling of Monthly Rainfall-Runoff Process Using ANN,” Master of Technology Dissertation, De- partment of Civil Engineering, Indian Institute of Tech- nology, Roorkee, 2004. [21] V. R. Raju, “Estimation of Monthly Runoff,” Master of Technology Dissertation, Department of Civil Engineer- ing, University of Roorkee, Roorkee, 1998. [22] S. K. Jain, P. C. Nayak and K. P. Sudheer, “Models for Estimating Evapotranspiration Using Artificial Neural Net- works, and their Physical Interpretation,” Hydrological Processes, Vol. 22, No. 13, 2008, pp. 2225-2234. [23] J. E. Nash and J. V. Sutcliffe, “River Flow Forecasting through Conceptual Models, Part 1—A Discussion of Prin- ciples,” Journal of Hydrology, Vol. 10, No. 3, 1970, pp. 282-290. Copyright © 2010 SciRes. JEP  Analysis of Mean Monthly Rainfall Runoff Data of Indian Catchments Using Dimensionless Variables by Neural Network171 Appendices I. Weights and Biases for BPLVM for model ANNPAM4 of network 4-6-1 Weights h11 h12 h13 h14 h15 h16 i1 –8.3602 –7.0334 8.6534 14.8352 1.5456 –0.6111 i2 –0.8806 17.6871 –17.5475 0.4825 –16.341 –6.7221 i3 0.331 0.3924 –0.375 –1.788 0.8711 –5.5499 i4 1.6462 5.0854 –5.5293 –8.3826 0.4748 –1.7737 Biases b11 b12 b13 b14 b15 b16 2.6117 1.2753 –1.7664 –1.1091 –2.5924 11.2949 II. Weights and Biases for BPLVM for model ANNDAM1 of network 3-1-1 Weights h11 i1 2.3092 i2 0.4151 i3 0.2383 Biases b11 8.9379 Biases bo1 1.0063e+003 Input layer 3nodes Hidden layer 1nodes Output layer 1 node Weights O1 h21 –0.7559 h22 –4.2063 h23 –3.1118 h24 –0.3359 h25 –4.7739 h26 1.1961 Input layer 4nodes Hidden layer 6 nodes Output layer 1 node Biases bo1 –3.855 Weights O1 h21 –1.0064e+003 Copyright © 2010 SciRes. JEP
|