Paper Menu >>
Journal Menu >>
 Journal of Minerals & Materials Characterization & Engineering, Vol. 7, No.1, pp 1-26, 2007 jmmce.org Printed in the USA. All rights reserved 1 Mineralogical Transformations in Altasteel Electric Arc Furnace Dust Roasted with Na 2 CO 3 and Secondary Ferrite-Forming Additives P. C. Holloway and T. H. Etsell Department of Chemical and Materials Engineering, University of Alberta, Edmonton, Alberta, Canada T6G 2G6 Email: prestonh@ualberta.net ABSTRACT The effect of secondary additives, such as CaCO 3 and MnCO 3 , on the mineralogical transformations in Altasteel EAF dust (9.4% Zn, 31.9% Fe) during roasting with Na 2 CO 3 , and metal extractions during hot water and H 2 SO 4 leaching of the roasted residues, was studied using a combination of techniques, including Design of Experiments testing, x-ray diffraction, scanning electron microscope/energy dispersive x- ray analysis and chemical analysis. The research objective was to promote the formation of acid insoluble metal ferrites during roasting to try to lower iron extractions during acid leaching. Neither additive was effective in reducing iron extractions due to the unexpected mineralogical changes caused during roasting by the addition of these secondary additives to this poorly crystalline EAF dust. Low CaCO 3 or MnCO 3 additions promoted the formation of manganese rich iron oxides (e.g., Mn 2 FeO 4 ), instead of MnFe 2 O 4 , which caused more iron to be available to react with Na 2 CO 3 during roasting to form acid soluble NaFeO 2 . Increased CaCO 3 additions further increased iron extractions, by further increasing the formation of Mn 2 FeO 4 ferrites, but increased MnCO 3 additions at roasting temperatures above 950°C led to the formation of a ZnFe 2 O 4 -MnFe 2 O 4 solid solution. While this resulted in lower iron extractions, lower overall zinc recoveries during acid leaching were also observed. Keywords: Electric arc furnace dust, Phase transformations, Pyrometallurgy, Leaching, Sodium carbonate roasting 1. INTRODUCTION Electric arc furnace (EAF) dust is produced globally as a byproduct of EAF steelmaking as a result of the interactions of metallic iron, volatilized metal oxides, and other slag components in the gas phase above the electric arc furnaces [1]. The resulting dust is predominantly a magnetite-franklinite-jacobsite (Fe 3 O 4 /ZnFe 2 O 4 /MnFe 2 O 4 ) solid  2 P. C. Holloway and T. H. Etsell Vol.7, No.1 solution, but also contains significant quantities of toxic elements or deleterious impurities, such as Pb, Cd, Cr, Cl and F, which not only make the dust difficult to treat, but also cause it to fail toxicity leaching requirements, resulting in the classification of EAF dust as a hazardous waste [2]. Treatment or disposal of the EAF dust is an expensive and global problem, with about 1.8 million tonnes per year produced in North America, Europe and Japan [3,4] and treatment or disposal costs as high as $2 to 3 US per tonne of steel produced [4]. In spite of significant research globally into the treatment of EAF dust, Waelz kiln processing remains the dominant treatment technology with 80 to 85% of the EAF dust in the US [5] and up to 76% worldwide [6] treated in Waelz kilns, in spite of the high energy consumption, the production of relatively low quality zinc products and the general inability to recycle the iron values from the dust back to the steel furnaces. Economics and product purity from Waelz kiln processing dictate the non-localized treatment of the dust near electrothermic or Imperial Smelting Process zinc smelters or chemical or fertilizer plants that can accept the zinc product. Transformational roasting, or roasting where a solid reagent is added which reacts with the feed material in the solid state to produce a desirable mineralogical change in the starting material, to treat EAF dusts has been proposed as a potential alternative to Waelz kiln processing [7]. Transformational roasting would, ideally, use pyro- and hydrometallurgical operations synergistically to achieve high metal recoveries while lowering the volume and increasing the disposability of the residues produced. Initial tests into transformational roasting of a sample of EAF dust from the Scaw Metals’ Altasteel plant in Edmonton, Alberta, Canada, indicated that roasting with 45% Na 2 CO 3 at 1000°C results in zinc extractions of up to 94% after leaching with 200 g/L H 2 SO 4 , with 55% of the iron also dissolved [7]. (Leaching the same roasted material with NaOH resulted in zinc extractions of 43%, lead extractions of 13%, and negligible iron extractions [7].) Mineralogically, the mixture of zinc-iron-manganese ((Zn,Mn,Fe)(Fe,Mn) 2 O 4 ) spinels in the EAF dust reacts with Na 2 CO 3 to form α- and β- NaFeO 2 and CaCO 3 reacts with Fe 3 O 4 in the dust to form srebrodolskite (Ca 2 Fe 2 O 5 ) during roasting [7]. Leaching the roasted EAF dust with hot water dissolves any unreacted Na 2 CO 3 , or Na 2 O or Na 2 SO 4 formed during roasting, and any Na-Cr, Na-Mo, or Na-V compounds formed during roasting while ZnO, NaFeO 2 , Ca 2 Fe 2 O 5 and Ca 2 SiO 4 are dissolved during subsequent acid leaching to produce a residue consisting of gypsum (CaSO 4 ·2H 2 O), magnetite (Fe 3 O 4 ) and jacobsite (MnFe 2 O 4 ) [7]. Research on Na 2 CO 3 roasting of another ferrite-containing waste (i.e., zinc ferrite residue from La Oroya, Peru) indicated that the addition of secondary additives, such as CaCO 3 or MnCO 3 , could be used to decrease iron extractions in H 2 SO 4 leaching through the formation of acid insoluble metal ferrites during roasting [8]. Mineralogical studies from the roasting of the Altasteel EAF dust with Na 2 CO 3 show that a significant proportion of the iron forms minerals that are insoluble in 200 g/L H 2 SO 4 solutions [7], but further reductions in iron extraction, if high zinc and chromium recoveries could be maintained, would be advantageous in processing the EAF dust with Na 2 CO 3 roasting.  Vol.7, No.1 Mineralogical Transformation of Altasteel EAF Dust 3 This paper discusses the effects of secondary additives, such as CaCO 3 and MnCO 3 , on the mineralogical transformations in the Altasteel EAF dust during roasting with Na 2 CO 3 , and metal extractions during leaching of the roasted residues. A combination of techniques were used, including Design of Experiments testing, x-ray diffraction (XRD), scanning electron microscope (SEM)/energy dispersive x-ray (EDX) analysis and chemical analysis, to ascertain the minerals formed, and their relative proportions, with particular focus on changes in the type and quantity of iron minerals formed during roasting. 2. FEED MATERIALS Electric arc furnace dust is produced as a byproduct of the recycling and production of carbon steel at Altasteel’s plant at a rate of 15000 t/y [9]. A chemical analysis of the sample obtained from Altasteel is presented in Table 1. Elements, such as Cr, F and Pb, are of particular concern, as it is usually based on these elements that the dust fails Toxicity Characteristic Leaching Procedure (TCLP) tests and is then classified as a hazardous waste [9]. Table 1 Chemical Analysis of As-Received Altasteel EAF Dust Analysis, % Analysis, ppm Al 0.50 Cr 0.34 K 0.82 Co 70 As 0.04 Cu 0.40 Si 1.92 F 130 Cd 0.03 Fe 31.9 Na 1.32 Mo 150 Ca 7.14 Pb 0.90 S 0.43 Ni 390 C 4.71 Mg 1.39 Zn 9.40 V 80 Cl 1.45 Mn 3.56 The as-received EAF dust had a particle size of 50% passing 84 µm, but with almost 35% greater than 417 µm. After drying the residue, the oversize was pulverized to give a final particle size of 90% passing 75 µm for the EAF dust used in the roasting tests. Mineralogically, x-ray diffraction analysis shows that the Altasteel EAF dust contains a mixture of Zn-Mn-Fe spinels ((Zn,Mn,Fe)(Fe,Mn) 2 O 4 ), CaCO 3 , NaCl, CaZn 2 (OH) 6 Å2H 2 O and larnite (Ca 2 SiO 4 ), but several different analyses, including x-ray diffraction, scanning electron microscopy (SEM) imaging, energy dispersive x-ray analysis (EDX) and diagnostic leaching, strongly indicated that the EAF dust is much less crystalline than zinc ferrite materials produced from zinc sulphide roasting [7]. 3. BACKGROUND Thermodynamically, calcium and manganese ferrites should be more thermodynamically favorable ferrites than franklinite (ZnFe 2 O 4 ) or NaFeO 2 and recent studies indicate that both srebrodolskite (Ca 2 Fe 2 O 5 ) and manganese ferrites, such as  4 P. C. Holloway and T. H. Etsell Vol.7, No.1 jacobsite (MnFe 2 O 4 ), can be formed during roasting of zinc ferrite materials with Na 2 CO 3 along with secondary additives, such as CaCO 3 and MnCO 3 [8]. ZnFe 2 O 4 + 2 CaO → Ca 2 Fe 2 O 5 + ZnO ∆G°= -37.8 - 0.006T (kJ/mol) (1) ZnFe 2 O 4 + MnO → MnFe 2 O 4 + ZnO ∆G°= -5.0 - 0.004T (kJ/mol) (2) 2 NaFeO 2 + 2 CaO → Ca 2 Fe 2 O 5 + Na 2 O ∆G°= -104.5 - 0.037T (kJ/mol)(3) 2 NaFeO 2 + MnO → MnFe 2 O 4 + Na 2 O ∆G°= -71.6 - 0.028T (kJ/mol)(4) All thermodynamic data reported in this article was obtained from either the FREED or FACTSAGE thermodynamic databases. FREED is a trademark of THERMART. FACTSAGE is a trademark of Thermafact/CRCT and GTT-Technologies. Mineralogical results from the roasting of Altasteel EAF dust with Na 2 CO 3 indicate that both Ca 2 Fe 2 O 5 and MnFe 2 O 4 are present, along with Fe 3 O 4 and NaFeO 2 , after roasting and MnFe 2 O 4 , in particular, plays a role in reducing the overall iron extraction during acid leaching observed from these roasted samples [7]. While these results are favorable, further reductions in iron extractions would be advantageous and, thus, design of experiments (DOE) testing were performed to determine whether secondary additions of CaCO 3 or MnCO 3 during Na 2 CO 3 roasting could further promote the formation of acid insoluble metal ferrites and further depress iron extractions during H 2 SO 4 leaching while maintaining high zinc and chromium extractions. 4. PROCEDURE 4.1. Roasting and Leaching Tests Dried Altasteel EAF dust was mixed with a certain weight of Na 2 CO 3 in a mortar and pestle and this mixture was transferred to an alumina crucible, heated to the reaction temperature and roasted in a muffle furnace in air for 5 h. The samples were removed from the furnace, air cooled, and ground to a uniform particle size and a subsample was taken for x-ray diffraction (XRD) and/or scanning electron microscope (SEM) analysis. After roasting, the roasted EAF dust was leached with water at 95 to 97°C for 1 h, followed by filtration of the slurry, washing and drying of the solids, and collection of the filtrate and wash samples for analysis. A subsample of the solids was taken for XRD and SEM analysis and the remaining solids were then leached with 200 g/L H 2 SO 4 for 1.5 h at room temperature, followed by filtration of the slurry, washing and drying of the solids, and collection of the filtrate and wash samples for analysis. 4.2. Design of Experiments (DOE) Tests The effects of temperature, Na 2 CO 3 addition, and secondary additions of either CaCO 3 or MnCO 3 on the zinc and iron extractions were further quantified through the use of a Design of Experiments (DOE) test. This test was conducted using a 2 3 circumscribed central composite design (CCD). A circumscribed central composite design consists of a standard 2 3 factorial design with the addition of center points to all  Vol.7, No.1 Mineralogical Transformation of Altasteel EAF Dust 5 for quantification of nonlinearity in the response of output variables, and axial points to allow for the construction of response surface models (RSM) from the output variables. Input variables were selected for the axial points to produce a fully rotatable design (i.e., with the additional axial points of the design at a radius of α=(2 k ) 1/4 from the design centre) to allow RSM to be constructed from the output variables. The conditions used for each sample in these DOE tests are shown in Table 2; samples were designated as matrix (M), centre (C) or axial (A) points, respectively, depending on their location relative to the centre of the design. Each individual sample for these tests was prepared using the roasting and leaching procedure outlined earlier. Table 2 Input Variables for Each Sample Tested in the Design of Experiments Tests Sample Temperature, °C Na 2 CO 3 Addition, % Secondary Addition, % CaCO 3 MnCO 3 M1 800 50.0 3.7 4.3 M2 800 50.0 14.1 16.3 M3 800 50.0 3.7 4.3 M4 800 90.0 14.1 16.3 M5 1000 50.0 3.7 4.3 M6 1000 50.0 14.1 16.3 M7 1000 90.0 3.7 4.3 M8 1000 90.0 14.1 16.3 C1 900 70.0 8.9 10.2 C2 900 70.0 8.9 10.2 A1 732 70.0 8.9 10.2 A2 1068 70.0 8.9 10.2 A3 900 36.4 8.9 10.2 A4 900 103.6 8.9 10.2 A5 900 70.0 0.17 0.19 A6 900 70.0 17.6 20.2 Lower additions of CaCO 3 (3.7 to 14.1%) and MnCO 3 (4.3 to 16.3%) were made than were used during the DOE tests using secondary additives for the La Oroya zinc ferrite [8]. These additions were determined based on the stoichiometric additions that would be required to form 100% MnFe 2 O 4 or 100% CaFe 2 O 4 (50% Ca 2 Fe 2 O 5 ) or from iron in the zinc ferrite component of the EAF dust. A software package called DOE XL Pro (a trademark of Digital Computations, Inc. and Air Academy Associates, LLC) was used to assist in the experimental design, and aid in the analysis of the results and the construction of the response surface models from these results. The R 2 values for the response surface models for overall zinc and iron extractions were 0.898 and 0.945, respectively, for CaCO 3 and 0.884 and 0.986,  6 P. C. Holloway and T. H. Etsell Vol.7, No.1 respectively for MnCO 3 . The R 2 value for the RSM for chromium extractions by water leaching was 0.765 for both CaCO 3 and MnCO 3 . 4.3. Chemical and Mineralogical Analysis All solutions and solids were analyzed with atomic absorption spectroscopy (AA) with a single-element Perkin-Elmer 4000 instrument. Solids were digested by fusion with lithium metaborate at 950°C and dissolved in HCl prior to analysis. Scanning electron microscope analysis was performed on selected samples using a Hitachi Model S-2700 Microscope equipped with a GW Electronics Annular Four- Quadrant Backscattered Electron Detector and a Princeton Gamma Tech Prism Intrinsic Germanium (IG) x-ray detector and operating at an accelerating voltage of 20 kV. The digital images were taken using a Princeton Gamma Tech IMIX system. X-ray diffraction analysis was performed using a Rigaku Rotoflex XRD with a rotating Cu anode. The x-ray patterns were then analyzed using Version 7 of the Jade software obtained from Materials Data, Inc. 5. RESULTS The DOE tests for roasting Altasteel EAF dust with Na 2 CO 3 reported in earlier work [7] were conducted at slightly lower temperatures and Na 2 CO 3 additions than this study. Fig. 1 and Fig. 2 show an extrapolation of the RSM from this previous study to allow the results, and the effects of secondary additives, to be readily compared and quantified. FIG 1. Extrapolation of the Response Surface Model Describing the Effect of Temperature and Na 2 CO 3 Addition on the Extraction of Chromium from Roasted Altasteel EAF Dust by Leaching with Hot Water 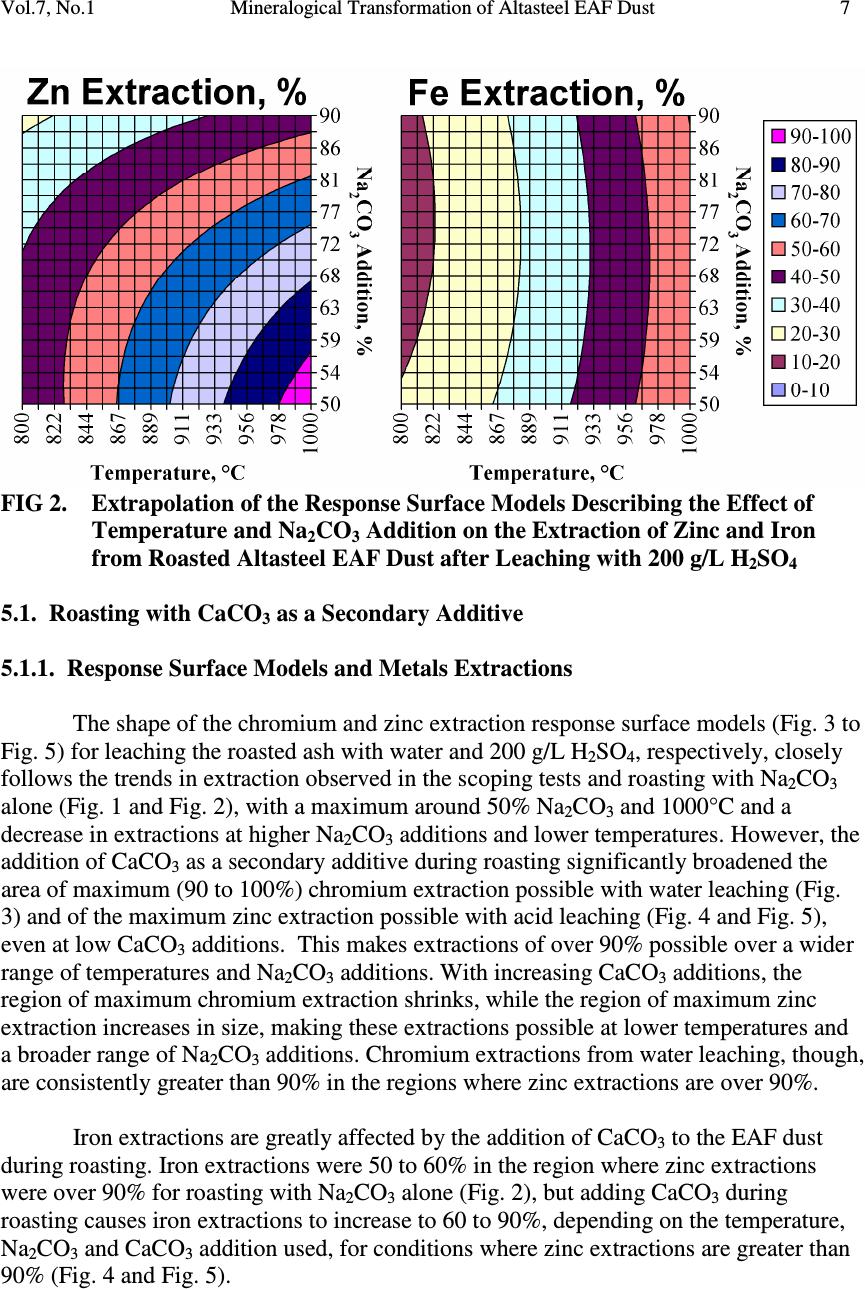 Vol.7, No.1 Mineralogical Transformation of Altasteel EAF Dust 7 FIG 2. Extrapolation of the Response Surface Models Describing the Effect of Temperature and Na 2 CO 3 Addition on the Extraction of Zinc and Iron from Roasted Altasteel EAF Dust after Leaching with 200 g/L H 2 SO 4 5.1. Roasting with CaCO 3 as a Secondary Additive 5.1.1. Response Surface Models and Metals Extractions The shape of the chromium and zinc extraction response surface models (Fig. 3 to Fig. 5) for leaching the roasted ash with water and 200 g/L H 2 SO 4 , respectively, closely follows the trends in extraction observed in the scoping tests and roasting with Na 2 CO 3 alone (Fig. 1 and Fig. 2), with a maximum around 50% Na 2 CO 3 and 1000°C and a decrease in extractions at higher Na 2 CO 3 additions and lower temperatures. However, the addition of CaCO 3 as a secondary additive during roasting significantly broadened the area of maximum (90 to 100%) chromium extraction possible with water leaching (Fig. 3) and of the maximum zinc extraction possible with acid leaching (Fig. 4 and Fig. 5), even at low CaCO 3 additions. This makes extractions of over 90% possible over a wider range of temperatures and Na 2 CO 3 additions. With increasing CaCO 3 additions, the region of maximum chromium extraction shrinks, while the region of maximum zinc extraction increases in size, making these extractions possible at lower temperatures and a broader range of Na 2 CO 3 additions. Chromium extractions from water leaching, though, are consistently greater than 90% in the regions where zinc extractions are over 90%. Iron extractions are greatly affected by the addition of CaCO 3 to the EAF dust during roasting. Iron extractions were 50 to 60% in the region where zinc extractions were over 90% for roasting with Na 2 CO 3 alone (Fig. 2), but adding CaCO 3 during roasting causes iron extractions to increase to 60 to 90%, depending on the temperature, Na 2 CO 3 and CaCO 3 addition used, for conditions where zinc extractions are greater than 90% (Fig. 4 and Fig. 5).  8 P. C. Holloway and T. H. Etsell Vol.7, No.1 FIG 3. Effect of Na 2 CO 3 and Temperature on Hot Water Leach Extractions of Chromium from Altasteel EAF Dust Roasted with CaCO 3 FIG 4. Effect of Na 2 CO 3 and Temperature on Zinc and Iron Extractions from Altasteel EAF Dust Roasted with 3.7% CaCO 3 after Leaching with 200 g/L H 2 SO 4 Furthermore, the iron extraction for roasting with CaCO 3 and Na 2 CO 3 (Fig. 4 and Fig. 5) does not show the same trend as roasting with Na 2 CO 3 alone (Fig. 2) where higher Na 2 CO 3 additions cause an increase in iron extractions. Instead iron extractions increase with increasing temperature and decreasing Na 2 CO 3 addition similar to the trend observed for zinc and chromium extractions. 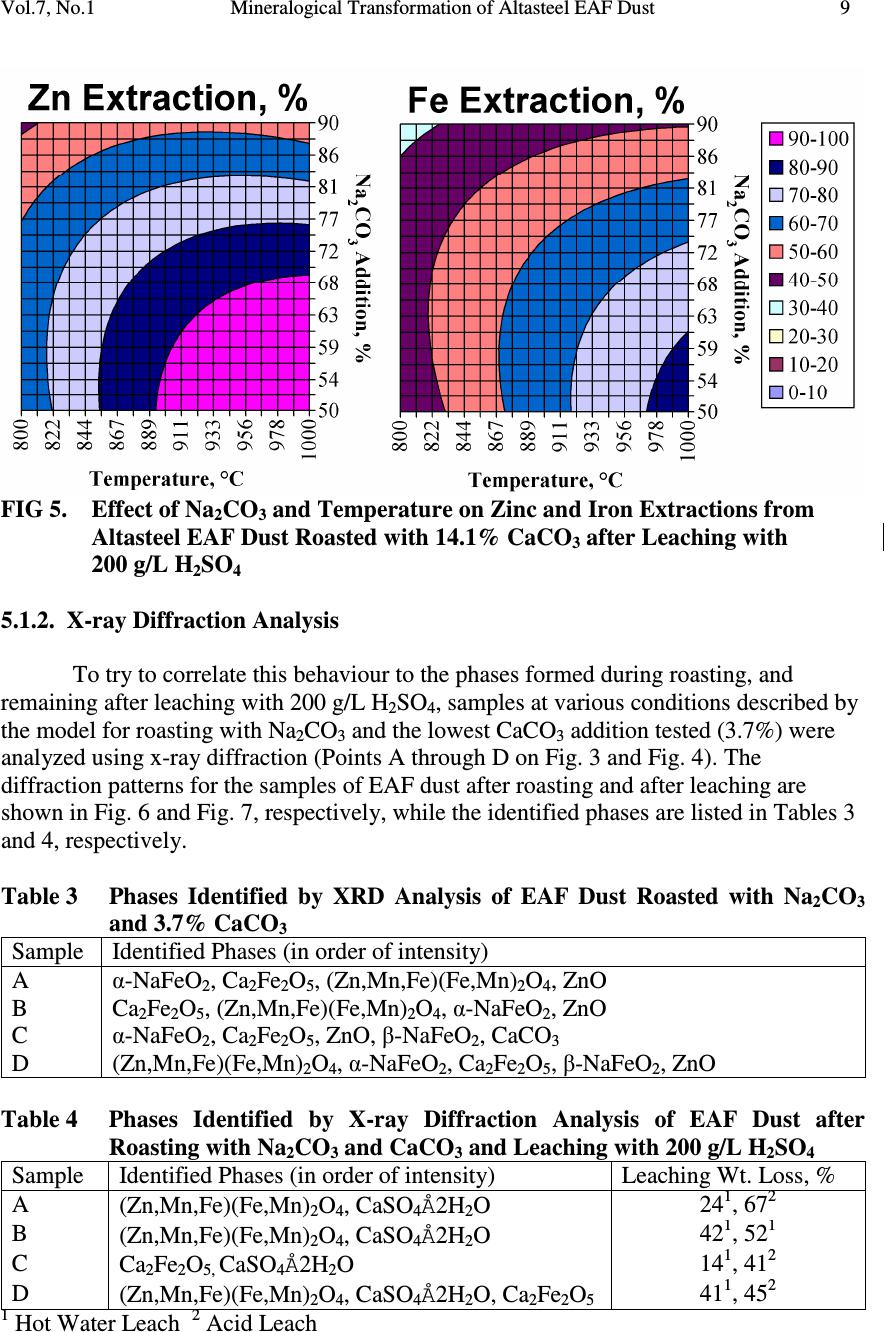 Vol.7, No.1 Mineralogical Transformation of Altasteel EAF Dust 9 FIG 5. Effect of Na 2 CO 3 and Temperature on Zinc and Iron Extractions from Altasteel EAF Dust Roasted with 14.1% CaCO 3 after Leaching with 200 g/L H 2 SO 4 5.1.2. X-ray Diffraction Analysis To try to correlate this behaviour to the phases formed during roasting, and remaining after leaching with 200 g/L H 2 SO 4 , samples at various conditions described by the model for roasting with Na 2 CO 3 and the lowest CaCO 3 addition tested (3.7%) were analyzed using x-ray diffraction (Points A through D on Fig. 3 and Fig. 4). The diffraction patterns for the samples of EAF dust after roasting and after leaching are shown in Fig. 6 and Fig. 7, respectively, while the identified phases are listed in Tables 3 and 4, respectively. Table 3 Phases Identified by XRD Analysis of EAF Dust Roasted with Na 2 CO 3 and 3.7% CaCO 3 Sample Identified Phases (in order of intensity) A α-NaFeO 2 , Ca 2 Fe 2 O 5 , (Zn,Mn,Fe)(Fe,Mn) 2 O 4 , ZnO B Ca 2 Fe 2 O 5 , (Zn,Mn,Fe)(Fe,Mn) 2 O 4 , α-NaFeO 2 , ZnO C α-NaFeO 2 , Ca 2 Fe 2 O 5 , ZnO, β-NaFeO 2 , CaCO 3 D (Zn,Mn,Fe)(Fe,Mn) 2 O 4 , α-NaFeO 2 , Ca 2 Fe 2 O 5 , β-NaFeO 2 , ZnO Table 4 Phases Identified by X-ray Diffraction Analysis of EAF Dust after Roasting with Na 2 CO 3 and CaCO 3 and Leaching with 200 g/L H 2 SO 4 Sample Identified Phases (in order of intensity) Leaching Wt. Loss, % A (Zn,Mn,Fe)(Fe,Mn) 2 O 4 , CaSO 4 Å2H 2 O 24 1 , 67 2 B (Zn,Mn,Fe)(Fe,Mn) 2 O 4 , CaSO 4 Å2H 2 O 42 1 , 52 1 C Ca 2 Fe 2 O 5, CaSO 4 Å2H 2 O 14 1 , 41 2 D (Zn,Mn,Fe)(Fe,Mn) 2 O 4 , CaSO 4 Å2H 2 O, Ca 2 Fe 2 O 5 41 1 , 45 2 1 Hot Water Leach 2 Acid Leach  10 P. C. Holloway and T. H. Etsell Vol.7, No.1 FIG. 6 XRD Patterns of EAF Dust Residue after Roasting with Na 2 CO 3 and CaCO 3 Decomposition, or partial decomposition, of ZnFe 2 O 4 occurs across the entire temperature range tested with NaFeO 2 and ZnO identified in all the samples tested after roasting using XRD. Srebrodolskite is also observed in all four samples, and is the major phase in Sample B, likely forming from the reaction of free calcium with magnetite (Fe 3 O 4 ) or NaFeO 2 . The absence of any residual Zn-Mn-Fe ferrite peaks in Sample C is consistent with the high zinc extractions observed for that sample, indicating that near complete decomposition of ZnFe 2 O 4 occurs at these conditions. (Similarly, the lower zinc extractions in Sample D for higher Na 2 CO 3 additions are consistent with the presence of (Zn,Mn,Fe)(Fe,Mn) 2 O 4 in Sample D as the major phase.) Specific silicate phases could not be identified using x-ray diffraction but, based on the phases observed from roasting with Na 2 CO 3 alone [7] and in the EAF dust feed, it is likely that the majority of silicon is  Vol.7, No.1 Mineralogical Transformation of Altasteel EAF Dust 11 present in the roasted dust as larnite (Ca 2 SiO 4 ). In these samples, the formation of α- NaFeO 2 is favored, even at higher temperatures, over β-NaFeO 2 ; this behaviour is consistent with the results from roasting this EAF dust with Na 2 CO 3 alone [7], but differs from the results of roasting of the La Oroya zinc ferrite where β-NaFeO 2 is preferred at temperatures of 950°C and higher [10]. FIG. 7 XRD Patterns of EAF Dust Residue after Roasting with Na 2 CO 3 and CaCO 3 and Leaching with 200 g/L H 2 SO 4 After leaching with 200 g/L H 2 SO 4 , gypsum (CaSO 4 Å2H 2 O) was identified in all the samples analyzed with x-ray diffraction (Table 4 and Fig. 7), with (Zn,Mn,Fe)(Fe,Mn) 2 O 4 as the major phase in Samples A, B and D where zinc extractions were lower and absent from Sample C where high zinc extractions were observed. Srebrodolskite (Ca 2 Fe 2 O 5 ) is also detected in significant quantities in samples roasted at 1000°C (Samples C and D). (Even though srebrodolskite (Ca 2 Fe 2 O 5 ) was formed when roasting the EAF dust with Na 2 CO 3 alone, it could not be detected by x-ray diffraction and could only be observed in trace quantities using SEM/EDX analysis after leaching with 200 g/L H 2 SO 4 [7].)  12 P. C. Holloway and T. H. Etsell Vol.7, No.1 5.1.3. Scanning Electron Microscopy/Energy Dispersive X-ray Analysis Fig. 8 shows a micrograph of Sample C (1000°C, 50% Na 2 CO 3 , 3.7% CaCO 3 ) after roasting using back-scattered SEM imaging and EDX analysis. The zinc oxide (A) and srebrodolskite (C) phases identified using XRD are visible with the SEM, but a separate Na-Fe phase (i.e., NaFeO 2 ) was not detected in the field of view. Several other types of particles are observed, including particles high in Pb, Ca and O (i.e., PbO and CaO (B)), high in Ca, Mn, Fe and O (i.e., likely a mixture of MnFe 2 O 4 and Ca 2 Fe 2 O 5 (D)), and high in Fe and O (i.e., Fe 3 O 4 (E)), as well a darker phase containing Na, K and O (i.e., likely (Na,K) 2 O (F)). Fig. 8 Secondary Electron (SE) and Backscattered Electron (BSE) Images of EAF Dust after Roasting at 1000°C with 50% Na 2 CO 3 and 3.7% CaCO 3 (Sample C) After leaching with 200 g/L H 2 SO 4 , Samples C (1000°C, 50% Na 2 CO 3 , 3.7% CaCO 3 ) and D (1000°C, 90% Na 2 CO 3 , 3.7% CaCO 3 ) were reexamined using SEM/EDX analysis (Fig. 9 and Fig. 10) to try to better understand the iron deportment in this system. Gypsum (CaSO 4 Å2H 2 O) is the major phase in the field of view in both samples and is labeled as phase G in both Fig. 9 and Fig. 10. In Sample C (Fig. 9), several phases containing iron are identified, including particles high in Ca, Fe and O (i.e., Ca 2 Fe 2 O 5 (E)) and high in Fe, Mn, Zn and O (i.e., residual unreacted (Zn,Mn)Fe 2 O 4 (D)). Several particles were also found to be high in Fe, Mn and O, but the ratio of manganese to iron in the EDX intensities differed, with some particles showing a ratio of intensities of Mn:Fe of between 2:1 and 3:1 (A, B) and others with a ratio of about 0.33:1 to 0.5:1 (C). Thus, this would indicate that some manganese may substitute for ferric iron in the Mn-ferrite structure, resulting in Mn-ferrites closer to the composition of Mn 2 FeO 4 (particles A and B) while other Mn-ferrites are more typical of jacobsite (MnFe 2 O 4 ) (particles C and F). (Particle B contains Ca, Pb and S, in addition to Mn, Fe and O, and is likely a mixture of Mn 2 FeO 4 , gypsum and anglesite (PbSO 4 ) while Particle F contains Ca, Mn, Fe and O and is likely a mixture of MnFe 2 O 4 and Ca 2 Fe 2 O 5 .)  Vol.7, No.1 Mineralogical Transformation of Altasteel EAF Dust 13 FIG. 9 Secondary Electron (SE) and Backscattered Electron (BSE) Images of EAF Dust after Roasting at 1000°C with 50% Na 2 CO 3 and 3.7% CaCO 3 and Leaching with 200 g/L H 2 SO 4 (Sample C) In Sample D (Fig. 10), similar particles likely representing (Zn,Mn)Fe 2 O 4 (A), MnFe 2 O 4 (C), Ca 2 Fe 2 O 5 (D) and a mixture of Mn 2 FeO 4 and gypsum (B) were identified. However, in Sample D, (Zn,Mn)Fe 2 O 4 particles are much more abundant, due to the lower zinc extractions in this sample, and particles likely containing Mn 2 FeO 4 are not observed as frequently as in Sample C. FIG. 10 Secondary Electron (SE) and Backscattered Electron (BSE) Images of EAF Dust after Roasting at 1000°C with 90% Na 2 CO 3 and 3.7% CaCO 3 and Leaching with 200 g/L H 2 SO 4 (Sample D)  14 P. C. Holloway and T. H. Etsell Vol.7, No.1 5.1.4. Iron Deportment The increase in iron extractions observed with the addition of CaCO 3 were not observed when roasting the La Oroya zinc ferrite with CaCO 3 , as a small, but steady decrease in iron extractions occurred with increasing CaCO 3 additions [8]. Thus, in order to explain this difference in behaviour, an iron balance for the roasting of EAF dust with Na 2 CO 3 and CaCO 3 was then constructed using the chemical, x-ray diffraction and SEM/EDX analyses of the feed and of samples after roasting and after leaching (Table 5). Table 5 Deportment of Iron Minerals during Roasting of EAF Dust with Na 2 CO 3 and CaCO 3 and Leaching with 200 g/L H 2 SO 4 Iron % of Total Iron in Feed Minerals Feed Sample A Sample B Sample C Sample D ZnFe 2 O 4 50.3 20.9 24.1 2.0 30.7 MnFe 2 O 4 22.7 22.1 22.1 1.1 a 13.5 b Mn 2 FeO 4 0.0 0.0 0.0 5.3 a 2.3 b Fe 3 O 4 27.0 20.3 20.3 0.0 0.0 Ca 2 Fe 2 O 5 0.0 13.8 13.8 13.8 13.8 NaFeO 2 0.0 22.9 19.7 77.8 39.8 Total 100.0 100.0 100.0 100.0 100.0 Fe Extraction Projected, % 36.7 1 33.5 1 77.8 2 39.8 2 Actual, % 38.9 24.1 79.3 39.6 Difference, % -2.2 9.4 -1.5 0.2 a Calculated assuming 90% of Mn is present as Mn 2 FeO 4 b Calculated assuming 40% of the Mn is present as Mn 2 FeO 4 1 Calculated assuming the total dissolution of NaFeO 2 and Ca 2 Fe 2 O 5 during leaching 2 Calculated assuming only the dissolution of NaFeO 2 during leaching The iron balance for the feed is calculated assuming 100% of Zn and Mn in the feed are present as ZnFe 2 O 4 and MnFe 2 O 4 and the balance of the iron is present as Fe 3 O 4 . The iron balance for Samples A to D is calculated, first, using zinc extractions to determine the conversion of ZnFe 2 O 4 to NaFeO 2 and, second, assuming that Fe 3 O 4 present in the dust after roasting is insoluble under the acid leaching conditions used. Third, it was assumed for this balance that the calcium in the feed that is not associated with silicon as Ca 2 SiO 4 reacts with Fe 3 O 4 to form Ca 2 Fe 2 O 5 while the CaCO 3 added during roasting reacted with NaFeO 2 to form Ca 2 Fe 2 O 5 . (The assumption made in the iron balance for roasting with Na 2 CO 3 alone that 100% of the available calcium reacts with magnetite to form Ca 2 Fe 2 O 5 [7] would lead to a significant overestimate of the iron extraction in Samples A and B.) Fourth, because srebrodolskite (Ca 2 Fe 2 O 5 ) is observed in the XRD and SEM/EDX analysis of the leach residue from Samples C and D, but not in Samples A and B, it was assumed that the Ca 2 Fe 2 O 5 formed at high temperatures was  Vol.7, No.1 Mineralogical Transformation of Altasteel EAF Dust 15 insoluble (Samples C and D), but was still assumed to be leached completely at lower temperatures (Samples A and B). Fifth, it was assumed, based on the SEM/EDX analysis of Samples C and D, that some of the iron was present as Mn 2 FeO 4 , instead of as MnFe 2 O 4 , with the remaining iron assumed to react with Na 2 CO 3 to form NaFeO 2 . (Without this assumption, complete leaching of Ca 2 Fe 2 O 5 and complete conversion of magnetite (Fe 3 O 4 ) to NaFeO 2 in Sample C, with all the manganese as MnFe 2 O 4 , would not explain the high iron extractions observed.) In Samples A and B, all the manganese was assumed to be present as MnFe 2 O 4 . With these assumptions, the balance agrees reasonably well with the iron extractions observed. However, the deportment of iron in samples roasted at 1000°C differs considerably from the iron deportment observed for roasting the Altasteel EAF dust with Na 2 CO 3 alone [7] or roasting the La Oroya zinc ferrite with Na 2 CO 3 [10] or with Na 2 CO 3 and CaCO 3 [8]. Some of the phenomena came be readily explained. For example, the apparent decrease in the solubility of srebrodolskite (Ca 2 Fe 2 O 5 ) in H 2 SO 4 solution former at higher roasting temperatures is consistent the results from tests performed by roasting the Altasteel EAF dust with coal and CaCO 3 which showed that, though srebrodolskite (Ca 2 Fe 2 O 5 ) is formed at all temperatures between 850 and 1050°C, the srebrodolskite formed at lower temperatures is leached more readily than that formed at higher temperatures. As well, the reaction of magnetite (Fe 3 O 4 ) to form NaFeO 2 and Ca 2 Fe 2 O 5 has been proposed to explain the iron deportment during roasting of the EAF dust with Na 2 CO 3 alone [7], although the extent of reaction increases significantly with the increase in temperature and Na 2 CO 3 addition used in these tests. However, some phenomena, such as the formation of Mn(Fe,Mn) 2 O 4 spinels, are not as easily explained. Research on manganese iron spinels indicates that the formation of Mn 2 FeO 4 is more likely where, instead of direct substitution of Mn 3+ for Fe 3+ in the octahedral sites, a combination of Mn 4+ and Fe 2+ are found in the octahedral sites, with Mn 2+ remaining in the tetrahedral sites [11]. The results from roasting with Na 2 CO 3 alone or roasting at lower temperatures with Na 2 CO 3 and CaCO 3 would indicate that manganese is predominantly present as Mn 2+ , leading to the formation of jacobsitic (MnFe 2 O 4 ) spinels. Thus, if Mn 2+ is the predominant manganese species, the formation of Mn(Fe,Mn) 2 O 4 spinels would require the oxidation of manganese to Mn 4+ . (Some ferrous iron should be present in the dust in the tetrahedral sites of magnetite (Fe 3 O 4 ).) This is possible, considering that the roasting tests were conducted in air, but it is uncertain why this oxidation, and the formation of Mn(Fe,Mn) 2 O 4 spinels, would be favored, or catalyzed, by the addition of even small amounts of CaCO 3 to the roasting system. Nevertheless, these Mn(Fe,Mn) 2 O 4 spinels do form, and based on the iron extractions in Fig. 5, their formation increases significantly with increasing CaCO 3 additions.  16 P. C. Holloway and T. H. Etsell Vol.7, No.1 This type of behaviour, though, is not observed during Na 2 CO 3 roasting of the La Oroya zinc ferrite at similar roasting temperatures and much higher CaCO 3 additions [8]. It is possible that this difference in behaviour may be related to the low crystallinity of the EAF dust, as outlined earlier and in other studies on this material [7]. If portions of the EAF dust are indeed poorly crystalline and, hence, metastable, then crystallization would be expected on heating and it is possible that, if crystallization occurs in the presence of other ionic compounds, such as CaCO 3 or CaO, more thermodynamically stable ferrites, such as Ca 2 Fe 2 O 5 , may be formed preferentially. (The formation of calcium ferrites upon crystallization may reduce the amount of iron available to react with manganese in the dust to form MnFe 2 O 4 type ferrites, thus, leading to the observed increase in the formation of Mn 2 FeO 4 spinels.) Additional characterization and phase identification, though, would be required to be able to more confidently explain the mechanisms behind these observed phenomena and will be the subject of future research. 5.2. Roasting with MnCO 3 as a Secondary Additive 5.2.1. Response Surface Models and Metal Extractions The shape of the chromium and zinc extraction response surface models (Fig. 11 to Fig. 14) for leaching the roasted ash with water and 200 g/L H 2 SO 4 , respectively, closely follows the trends in extraction observed in the scoping tests for roasting with Na 2 CO 3 (Fig. 1 and Fig. 2) or Na 2 CO 3 -CaCO 3 (Fig. 3 to Fig. 5), with a maximum around 50% Na 2 CO 3 and 1000°C and a decrease in extractions at higher Na 2 CO 3 additions and lower temperatures. Increased MnCO 3 additions broaden the area of maximum (90 to 100%) chromium extraction possible with water leaching (Fig. 11), compared to roasting with Na 2 CO 3 alone (Fig. 1), but the size of the area of the maximum zinc extractions (Fig. 12 to Fig. 14) is drastically decreased as MnCO 3 additions increase. FIG. 11 Effect of Na 2 CO 3 and Temperature on Chromium Extractions from Altasteel EAF Dust Roasted with MnCO 3  Vol.7, No.1 Mineralogical Transformation of Altasteel EAF Dust 17 FIG. 12 Effect of Na 2 CO 3 and Temperature on Zinc and Iron Extractions from Altasteel EAF Dust Roasted with 4.3% MnCO 3 FIG. 13 Effect of Na 2 CO 3 and Temperature on Zinc and Iron Extractions from Altasteel EAF Dust Roasted with 10.2% MnCO 3 Iron extractions are also affected by the addition of MnCO 3 to the EAF dust during roasting. While the overall iron extraction profile is similar in shape to that observed for roasting with Na 2 CO 3 and CaCO 3 (Fig. 4 and Fig. 5), low MnCO 3 additions cause an initial increase in iron extractions to up to 80 to 90% in the region where zinc extractions were over 90% (Fig. 12) which is significantly higher than the 50 to 60% observed for roasting with Na 2 CO 3 alone (Fig. 2). Additions of up to 16.3% MnCO 3 (Fig. 14) are required to return iron extractions to the levels observed when roasting with Na 2 CO 3 alone (50 to 60%), but zinc extractions are drastically reduced at those MnCO 3 additions.  18 P. C. Holloway and T. H. Etsell Vol.7, No.1 FIG. 14 Effect of Na 2 CO 3 and Temperature on Zinc and Iron Extractions from Altasteel EAF Dust Roasted with 16.3% MnCO 3 5.2.2. X-ray Diffraction Analysis Samples at various conditions described by the model for roasting with Na 2 CO 3 and the highest MnCO 3 addition tested (16.3%) were analyzed using x-ray diffraction (Points A through D on Fig. 11 and Fig. 14) to try to correlate this behaviour to the phases formed during roasting, and remaining after leaching with 200 g/L H 2 SO 4 . The diffraction patterns for the samples of EAF dust after roasting and after leaching are shown in Fig. 15 and Fig. 16, respectively, while the identified phases are listed in Tables 6 and 7, respectively. As with the x-ray diffraction analysis of La Oroya ferrite roasted with Na 2 CO 3 and MnCO 3 [8], phase identification for the EAF dust samples roasted with MnCO 3 was less definitive than for EAF dust roasted with Na 2 CO 3 or Na 2 CO 3 -CaCO 3 . In several cases, x-ray diffraction peaks of significant intensity could not be positively identified from the available database. However, it was possible to positively identify several phases with x-ray diffraction including α-NaFeO 2 , β-NaFeO 2 , (Zn,Mn,Fe)(Fe,Mn) 2 O 4 , zincite (ZnO) and srebrodolskite (Ca 2 Fe 2 O 5 ), which are found in most of the samples tested. In Sample D, a calcium-manganese oxide (Ca 4 Mn 3 O 10 ) was also identified after roasting along with trace amounts of β-NaFeO 2 . After leaching with 200 g/L H 2 SO 4 , zincite (ZnO) and NaFeO 2 are dissolved, some calcium is dissolved and precipitated as gypsum (CaSO 4 Å2H 2 O) and spinel phases, such as (Zn,Mn,Fe)(Fe,Mn) 2 O 4 , MnFe 2 O 4 or Fe 3 O 4 , which were not dissolved during leaching were positively identified from x-ray diffraction on the leach residue (Table 7 and Fig. 16). However, several peaks could not be positively identified using the available database and software in these samples as well.  Vol.7, No.1 Mineralogical Transformation of Altasteel EAF Dust 19 FIG. 15 XRD Patterns of EAF Dust Roasted with Na 2 CO 3 and MnCO 3 Table 6 Phases Identified by XRD Analysis of EAF Dust Roasted with Na 2 CO 3 and MnCO 3 Sample Identified Phases (in order of intensity) A α-NaFeO 2 , (Zn,Mn,Fe)(Fe,Mn) 2 O 4 , ZnO, Ca 2 Fe 2 O 5 B α-NaFeO 2 , ZnO, (Zn,Mn,Fe)(Fe,Mn) 2 O 4 , ZnO, Ca 2 Fe 2 O 5 C α-NaFeO 2 , Ca 2 Fe 2 O 5, (Zn,Mn,Fe)(Fe,Mn) 2 O 4 , ZnO D α-NaFeO 2 , ZnO, Ca 4 Mn 3 O 10 , Ca 2 Fe 2 O 5, β-NaFeO 2  20 P. C. Holloway and T. H. Etsell Vol.7, No.1 FIG. 16 XRD Patterns of EAF Dust Residue after Roasting with Na 2 CO 3 and MnCO 3 and Leaching with 200 g/L H 2 SO 4 Table 7 Phases Identified by X-ray Diffraction Analysis of EAF Dust after Roasting with Na 2 CO 3 and MnCO 3 and Leaching with 200 g/L H 2 SO 4 Sample Identified Phases (in order of intensity) Leaching Wt. Loss, % A CaSO 4 Å2H 2 O, (Zn,Mn,Fe)(Fe,Mn) 2 O 4 19 1 , 72 2 B CaSO 4 Å2H 2 O, (Zn,Mn,Fe)(Fe,Mn) 2 O 4 34 1 , 54 2 C CaSO 4 Å2H 2 O, MnFe 2 O 4 /Fe 3 O 4 9 1 , 62 2 D CaSO 4 Å2H 2 O, (Zn,Mn,Fe)(Fe,Mn) 2 O 4 , MnFe 2 O 4 /Fe 3 O 4 35 1 , 50 2 1 Hot Water Leach 2 Acid Leach  Vol.7, No.1 Mineralogical Transformation of Altasteel EAF Dust 21 5.2.3. Scanning Electron Microscopy/Energy Dispersive X-ray Analysis Phase analysis using backscattered electron imaging in the scanning electron microscope and EDX analysis was performed on Sample C (1000°C, 50% Na 2 CO 3 , 16.3% MnCO 3 ), where the highest zinc extractions for this MnCO 3 addition were observed (Fig. 17 and Fig. 18). This analysis provided a much clearer picture of the phases present in the roasted EAF dust than x-ray diffraction. FIG. 17 Secondary Electron (SE) and Backscattered Electron (BSE) Images of EAF Dust after Roasting at 1000°C with 50% Na 2 CO 3 and 16.3%MnCO 3 (Sample C)  22 P. C. Holloway and T. H. Etsell Vol.7, No.1 After roasting, zinc oxide is visible as bright particles (A) in the backscattered images in Sample C (Fig. 17). Ferrites containing Mn, Fe and O (i.e., MnFe 2 O 4 (B)) are the dominant iron bearing phase identified, but particles high in Ca, Fe and O (i.e., CaFe 2 O 5 (C)) are also identified and both are consistent with the phases detected using x- ray diffraction. In addition, some darker particles were shown to be high in Ca, Si and O (i.e.,Ca 2 SiO 4 (D)) or high in Ca and O (i.e., CaO/Ca(OH) 2 (E)). The particles in view in some of the SEM micrographs are very interesting texturally, showing what appear to be lamellar type layers of MnFe 2 O 4 and ZnO in some particles. FIG. 18 Secondary Electron (SE) and Backscattered Electron (BSE) Images of EAF Dust after Roasting at 1000°C with 50% Na 2 CO 3 and 16.3%MnCO 3 and Leaching with 200 g/L H 2 SO 4 (Sample C) After leaching with 200 g/L H 2 SO 4 , the leach residue for Sample C showed gypsum (A), present as fine elongate crystals, as the major phase and likely forms because of the dissolution of larnite (Ca 2 SiO 4 ) and reprecipitation of the dissolved calcium as gypsum during leaching (Fig. 18). Iron is present mostly as metal ferrites, with particles high in Fe, Mn and O (i.e., MnFe 2 O 4 (B)) or high in Fe, Mn, Zn and O (i.e., (Zn,Mn)Fe 2 O 4 (C)) being the most common in the SEM micrograph and particles high in Ca, Fe and O (i.e., Ca 2 Fe 2 O 5 (E)) present in smaller quantities. (The presence of significant amounts of (Zn,Mn)Fe 2 O 4 would be expected, with zinc extractions of less than 90% at these roasting conditions.) Iron is also found in Particle D, which contains Fe, Mn, Si and O, likely as a Mn-Fe silicate.  Vol.7, No.1 Mineralogical Transformation of Altasteel EAF Dust 23 5.2.5. Iron and Zinc Deportment From the above analysis, it is evident that the addition of MnCO 3 promotes the formation of acid insoluble Mn-ferrites during roasting. This is indicated, first of all, by the detection of Mn ferrites using SEM/EDX analysis both before and after leaching and, second, by the decrease in iron extractions observed with increased MnCO 3 additions during roasting. However, for roasting this sample of EAF dust with Na 2 CO 3 and MnCO 3 , several phenomena remain unexplained. First, small additions of MnCO 3 (4.3%) cause an initial increase in the iron extractions observed, compared to those from roasting with Na 2 CO 3 alone, and additions of up to 16.3% are required to return iron extractions to those observed from roasting with Na 2 CO 3 alone. (In contrast, iron extractions from roasting La Oroya zinc ferrite with MnCO 3 cause a steady decrease in iron extractions, compared to roasting with Na 2 CO 3 alone.) In roasting with low CaCO 3 additions, as discussed earlier, significant amounts of Mn 2 FeO 4 , or other manganese rich ferrites, formed, resulting in less iron associated with manganese and, thus, more iron available to react with Na 2 CO 3 to form acid soluble iron compounds. A similar phenomenon may occur during roasting of the EAF dust with MnCO 3 , resulting, initially, in higher iron extractions and, then, in a steady decrease in iron extractions with higher MnCO 3 additions as MnCO 3 reacts with NaFeO 2 to form MnFe 2 O 4 . Second, increased MnCO 3 additions drastically decrease the zinc extractions possible at a given temperature. A similar phenomenon is observed for roasting La Oroya zinc ferrite with MnCO 3 , but the effect is much less significant, even at MnCO 3 additions of up to 35% [8]. The behaviour could be caused either by the presence of a ZnFe 2 O 4 - MnFe 2 O 4 solid solution in the EAF dust initially, or by its formation during roasting, either by crystallization of the EAF dust after heating in the presence of Mn either in the dust or added as MnCO 3 , or by reaction of ZnFe 2 O 4 in the EAF dust with the manganese added as MnCO 3 . (Tests indicate that, at high temperatures, MnCO 3 added without the addition of Na 2 CO 3 to La Oroya zinc ferrite readily reacts to form a ZnFe 2 O 4 -MnFe 2 O 4 solid solution leading to a low zinc extraction [8,12].) If the majority of the zinc is present as a solid solution in (Zn,Mn)Fe 2 O 4 , then it is possible that the increase in manganese content could decrease the activity of ZnFe 2 O 4 in the roasting reactions, which, in turn, could decrease the zinc extractions possible after roasting. To examine this possibility, calculations were made to determine the effect of ZnFe 2 O 4 activity on the thermodynamics of the roasting reaction (ZnFe 2 O 4 + Na 2 CO 3 → 2 NaFeO 2 + ZnO + CO 2 (∆G°=163-0.149T (kJ/mol)) using the equation, ∆G=∆G°+RTlnK. Several assumptions were made in these calculations, including assuming that all the manganese in the feed, and that added as MnCO 3 during roasting, reacts to form a solid solution of (Zn,Mn)Fe 2 O 4 , that the activity of ZnFe 2 O 4 in that solid solution is defined by Raoult’s law (i.e., ideal solution), that P CO ¿ is approximately 1 atm close to the reaction surface, that little change occurs in the activities of the other solids in the equilibrium constant expression over the temperature range considered (i.e., a solids ≈ 1, and, thus, K ≈ 1/a ZnFe ¿ O Á ) and that the maximum zinc extraction occurs where  24 P. C. Holloway and T. H. Etsell Vol.7, No.1 the activity of ZnFe 2 O 4 is lowered enough to cause ∆G to equal zero for a given temperature. Based on these assumptions, Fig. 19 was constructed to compare the theoretical maximum extractions from these activity and thermodynamic calculations with the extractions observed for roasting with 50% Na 2 CO 3 for each temperature from the response surface models (Fig. 12 to Fig. 14) for each level of MnCO 3 used in the DOE tests. FIG. 19 Comparison of Maximum Zinc Extractions and Zinc Extractions at 50% Na 2 CO 3 , from the Response Surface Models (RSM) with Maximum Extractions Calculated from the Change in Activity in a (Zn,Mn)Fe 2 O 4 Solid Solution  Vol.7, No.1 Mineralogical Transformation of Altasteel EAF Dust 25 Fig. 19 clearly shows a decrease in the theoretical zinc extraction with an increase in the MnCO 3 addition, which is a trend that is consistent with the experimental results, as is the observed trend of increasing maximum zinc extraction with increasing roasting temperature. Without MnCO 3 added, the theoretical and experimental zinc extractions do not agree closely, except at 1000°C, and the curves diverge above that temperature. With 4.3% MnCO 3 , the curves agree between 925 and 975°C but diverge at lower or higher temperatures. However, as the MnCO 3 additions are increased further, the discrepancy between the maximum theoretical and experimental zinc extractions decrease to the point that the curves converge above 950°C for 10.2% MnCO 3 addition and above 975°C for 16.3% MnCO 3 . Thus, it is probable that, at higher roasting temperatures, as MnCO 3 additions are increased, the activity of ZnFe 2 O 4 in the (Zn,Mn)Fe 2 O 4 spinel solid solution does affect the maximum zinc extractions possible during roasting of this sample of EAF dust with Na 2 CO 3 . Thus, this behaviour would be expected to make it increasingly difficult to obtain high zinc extractions with high MnCO 3 additions. 6. CONCLUSIONS From these results, neither CaCO 3 nor MnCO 3 was effective as a secondary additive to reduce iron extractions during roasting with Na 2 CO 3 . Roasting with CaCO 3 increases the amount of iron dissolved in acid leaching. Iron extractions also increase initially with the addition of MnCO 3 , but decrease with increasing MnCO 3 additions; however, zinc extractions decreased significantly with increasing MnCO 3 additions and no improvement in iron extractions over roasting with Na 2 CO 3 alone was observed. From the mineralogical analysis, these process outcomes occur because the addition of secondary additives to the Altasteel EAF dust caused significant changes mineralogically compared to roasting with Na 2 CO 3 alone. Even low CaCO 3 additions were shown to promote the formation of manganese rich iron oxides (e.g., Mn 2 FeO 4 ) which reduced the amount of iron associated with acid insoluble Mn-ferrites and caused more iron to react with Na 2 CO 3 to form acid soluble NaFeO 2 during roasting. Low additions of MnCO 3 may have had a similar effect, but larger MnCO 3 additions appear to have encouraged the formation of a ZnFe 2 O 4 -MnFe 2 O 4 solid solution while roasting at temperatures above 950°C which led to lower overall zinc recoveries during acid leaching. Because of the significant differences observed after comparison with roasting a more crystalline material (i.e., the La Oroya zinc ferrite) with similar secondary additives, it is likely that this reaction behaviour may be related to the low crystallinity of the Altasteel EAF dust as, at the high roasting temperatures tested, the ionic compounds added as secondary additives may produce changes in the initial mineralogy of the EAF dust as it crystallizes upon heating which can significantly affect the results observed from roasting with Na 2 CO 3 .  26 P. C. Holloway and T. H. Etsell Vol.7, No.1 ACKNOWLEDGEMENTS The authors would like to thank Altasteel, a division of Scaw Metals Group, for supplying a sample of electric arc furnace dust for metallurgical testing. The authors would also like to thank NSERC and Alberta Ingenuity for supplying student funding that helped support this research. REFERENCES [1] Li, C. L. and Tsai, M. S., 1993, “Mechanism of spinel ferrite dust formation in electric arc furnace steelmaking.” ISIJ Int., Vol. 33, No. 2, pp.284-90. [2] Xia, D. K. and Pickles, C. A., 1998, “Extraction of nonferrous metals from electric arc furnace dust”, In: Waste Processing and Recycling in Mineral and Metallurgical Industries III, pp.221-245, (Rao, S. R., Ed.) Montreal, QC Canadian Institute of Mining, Metallurgy and Petroleum. [3] Liebman, M., 2000, “The current status of electric arc furnace dust recycling in North America”, International Symposium on Recycling of Metals and Engineered Materials, 4th, pp.237-250, (Stewart, D. L. Jr., Daley, J. C. and Stephens, R. L. Eds.), Warrendale, Pa, Minerals, Metals & Materials Society. [4] Zunkel, A. D., 2000, “Recovering zinc and lead from electric arc furnace dust: a technology status report”, International Symposium on Recycling of Metals and Engineered Materials, 4th, pp.227-236, (Stewart, D. L. Jr., Daley, J. C. and Stephens, R. L. Eds.), Warrendale, Pa, Minerals, Metals & Materials Society. [5] Zunkel, A. D., 1997, “Electric arc furnace dust management: a review of technologies”, Iron and Steel Eng., Vol. 74, No. 3, pp.33-38. [6] Mager, K., Meurer, U., Garcia-Egocheaga, B., Goicoechea, N., Rutten, J., Saage, W., and Simonetti, F., 2000, “Recovery of zinc oxide from secondary raw materials: new developments of the Waelz process”, International Symposium on Recycling of Metals and Engineered Materials, 4th, pp.329-344, (Stewart, D. L. Jr., Daley, J. C. and Stephens, R. L. Eds.), Warrendale, Pa, Minerals, Metals & Materials Society. [7] Holloway, P.C. and Etsell, T.H., “Roasting of Altasteel Electric Arc Furnace Dust with Na 2 CO 3 ,” submitted to Metall. Trans. B. [8] Holloway, P.C. and Etsell, T.H., “The Use of Secondary Additives to Control the Iron Dissolution during Na 2 CO 3 Roasting of La Oroya Zinc Ferrite,” submitted to Metall. Trans. B. [9] Johannsen, R., 2006, Private communication, Altasteel, Edmonton, AB, Canada. [10] Holloway, P.C. and Etsell, T.H., “Roasting of La Oroya Ferrite with Na 2 CO 3 ”, submitted to Metall. Trans. B. [11] Eschenfelder, A. H., 1958, “Ionic valences in manganese-iron spinels”, J. Appl. Phys., Vol. 29, pp.378-80. [12] Holloway, P.C., 2006, “Application of Transformational Roasting to the Treatment of Metallurgical Wastes,” Ph.D. Thesis, University of Alberta. |