Paper Menu >>
Journal Menu >>
 Journal of Minerals & Materials Characterization & Engineering, Vol. 6, No.2, pp 79-101, 2007 jmmce.org Printed in the USA. All rights reserved 79 SIMULATION STUDIES OF NODULAR IRON’S BULL’S EYE EFFECT ON STRESS CONCENTRATION UNDER PLANE STRESS CONDITONS O.O. Oluwole and O.E. Olorunniwo Materials Science and Engineering Department Obafemi Awolowo University, Ile-ife, Nigeria Address for Correspondence: Dr.O.Oluwole, email leke_oluwole@yahoo.co.uk Tel. +2348033899701 Abstract A simulation study on the effect of the “bull’s eye” in ductile iron on stress concentrations was done in this work. Using the model of graphite nodules in a cavity, a two dimensional plate strip was subjected to plane stress conditions. The results were compared to the traditional theory of modeling the graphite as holes (cavity) in the iron matrix. In plane stress conditions, while the graphite in the hole model showed the hole as areas of stress concentration and therefore very critical as regards fracture, the hole model showed stress concentrated away from the holes making the holes not very critical factor as regards fracture. It was observed that areas of stress application were more critical than the voids when using the hole model. Also the graphite in the hole model was able to predict the good damping behaviour of ductile iron and the increasing elongation with decreasing nodule count. Keywords: Simulation, Ductile iron, Bull’s eye, Stress concentration, Plane stress 1.0 Introduction The high strength of nodular cast iron is well established over grey cast iron which has flaky distribution of graphite [1,2]. Recent studies have shown the graphite nodules seated in a cavity in the ductile –iron matrix like a bull’s eye [3]. However, since graphite is known to have less strength than the ductile iron matrix, it cannot be considered as a traditional strengthening element like the interstitials or substitutionals. In gray cast iron, the graphite flakes act as stress raisers, initiating microplastic deformation at flake tips at low applied stresses. Thus, gray irons cannot exhibit a true elastic deformation as the plasticity causes the stress-strain curve to decrease continually. Ferritic ductile irons on the other hand have elongations in the range 18- 30 percent and tensile strengths equivalent to those of low carbon steel. Pearlitic ductile irons have tensile strengths exceeding 825MPa but reduced ductility. Austempered ductile iron have  80 O. Oluwole and O. Olorunniwo Vol.6, No.2 strengths exceeding 1600MPa. Thus ductile irons exhibit a proportional stress-strain relationship similar to steel, but limited by the gradual onset of plastic deformation [4]. Nodularity plays an important part on mechanical properties. Decreasing nodularity has been seen to decrease tensile, yield and fatigue strengths [4, 5]. Excess nodule count is also seen to have deleterious effect on mechanical properties. Previous attempt at modeling ductile cast iron considered the graphite nodules as holes[6]. However, in the light of recent advances in knowledge in ductile iron microstructures, it will not be representative to still use the hole as a model for the graphite nodule. This paper models the graphite nodules as graphite nodules suspended in a cavity surrounded by the ductile iron matrix. Comparison is made with the hole model. 2.0 Methodology 2.1 Finite Element Modeling We consider the material to be isotropic and two dimensional. The material was subjected to two types of loading: simple tensile loading applied on one side of the plate in the x- direction, the other sides kept fixed (Fig.a); and also simulation was carried out on a plate strip subjected to biaxial loading (Fig.b). The Matlab pdetool graphics user interface was used in the finite element modeling of the material. Three-node triangular elements were used in meshing and the finite element equation applied to the elements was: [k e ]{d e } = {f e } ………………………………………………(1) Where [ ] [ ][][ ] Ω= ∫ Ω dBDBk T e e = element stiffness matrix…………….(2) [B e ] = ∂ ∂ ∂ ∂ ∂ ∂ ∂ ∂ ∂ ∂ ∂ ∂ ∂ ∂ ∂ ∂ ∂ ∂∂ ∂ ∂ ∂ ∂ ∂ x N y N x N y N x N y N y N y N y N x N x N x N 332211 3 21 3 21 000 000 ………………………..(3) [D] = − − 2 1 00 01 01 1 2 ν ν ν ν E for plane stress condition …………………..(4) 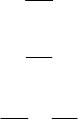 Vol.6, No.2 Simulation Studies of Nodule Iron 81 N 1 , N 2 and N 3 are shape functions for three-node triangular elements. x and y are the directions in which the forces are acting E = Youngs modulus of elasticity ν = Poisson ratio {f e } = element force vector {d e }= element displacement vector 2.2 Assembly of element equations into global equation and Solving for displacements The elemental equations were assembled and solved using the global equation: [k]\{f} = {d} …………………………………………..……(5) Where {d} = Nodal displacement vector = {u 1 v 1 u 2 v 2 u 3 v 3 } T ……..(6) 2.3 Solving for Strains, Stress and Shear stress and strains Solving for strains, we used the kinematic equation relating strains to displacements which is stated as: ∂ ∂ + ∂ ∂ ∂ ∂ ∂ ∂ = x v y u y v x u xy y x γ ε ε …………………………………………………(7) Solving for stresses, we used the constitutive equation between stress and strain { } [ ] { } εσ D= ……………………………………………………………(8) For shear stresses, equations of equilibrium of forces acting on two-dimensional Continuum was used. These are:  82 O. Oluwole and O. Olorunniwo Vol.6, No.2 0=+ ∂ ∂ + ∂ ∂ x xy x f yx τ σ and …………………………………………..(9) 0=+ ∂ ∂ + ∂ ∂ y xyy f yx σ τ Where xyyx τσσ ,, are stresses acting in the x, y directions and Shear stress, respectively. 3.0 Results And Discussion Figs.1 and 3 show the stress concentration in the graphite in the cavity model while Figs.2 and 4 show the stress distribution in the hole model. It could be seen quite clearly that both show the holes as areas of stress concentrations. However in the direction of applied stress, the graphite in hole model showed stress concentrations not only at the tips of the holes but the hole itself is a stress raiser. The y-components of stress was observed to run across the material for the graphite in the hole model whilst that of the hole model was localized to the area of stress application and showed high stress values in the y- direction.This high stress values have translated to high strain (Fig.12) which also resulted in high shearing strains ( Fig.16). This would consequently result in shear occurring at point of application of stress. The materials subjected to biaxial loading (Figs.21-24) showed clearly also that there was severe stress concentration on the bull’s eye model as opposed to the hole model. The scaling in the biaxial loading showed stress concentration in the graphite in the hole model to be about three times in the hole model (Figs. 21-24). Displacements as a result of same applied stress was observed to be less pronounced in the graphite in the hole model (Figs.5 and 7) as shown by the scaling of the displacement contours compared to the hole model (Figs.6 and 8). The hole model showed about one and a half times more elongation than the graphite in the hole model. This observation was also corroborated in the materials subjected to biaxial loading (Figs. 17-20). The graphite in the whole model showed that displacement was affected by the bull’s eye (Figs.5,7,18 and 20) whilst displacement in the hole model followed the normal flow pattern observed in metals(Figs. 6,8,17 and 19,).I A significant observation showed the displacements patterns were reflected in the srain patterns . Strains were also seen to be heavily concentrated on the bull’s eye in the graphite in the hole model whereas strain was more pronounced at points of applied stress for the hole model (Figs.9-12 and 25-28). Shear stresses acting on the graphite in the hole model were observed to be concentrated at the holes whereas the points of application of stress was the most heavily stressed part for the hole model (Figs.13 and14). This is even more pronounced under biaxial stresses (Figs.29 and 30). . This shear stress heavily localized in the hole in which the graphite sits was observed to be responsible for the shear strains heavily localized in  Vol.6, No.2 Simulation Studies of Nodule Iron 83 the graphite holes as seen in Fig.15 and 32. However in the hole model, under biaxial loading the model can predict failure by extension of voids,.though strains on the holes are about half of that in the graphite in hole model.. The implication of this is that fracture would occur by extension of voids and possible transgranular fracture which have been observed experimentally in ductile irons[7] . This cannot be predicted by the hole model for uniaxial loading studied in this work which predicts failure by crack initiation near the points of applied stress. Thus, graphite in the hole model was seen to be able to predict very pertinent behaviours in ductile iron which the hole model could always predict. These are: (i) The behavior of the bull’s eye tallies with observations of possible fracture occurring by extension of voids on which graphite nodules[7] which is clearly evident in this simulation study from the strain concentrations at the holes in which the nodules sit (Figs.9, 11, 26 and 28). (ii) The localized non-elastic behavior also noticeable in the stress distributions shows the good damping property of ductile iron. (iii) Using a more complex combinations of stresses it was observed that elongation increased at area of material where nodule count was smaller in the graphite in hole model and also decreased with increasing nodule count (Figs.18, 19, 33 and 34) which is consistent with observations in ferritic ductile iron [4]. 4.0 Conclusions Modeling graphite nodules as holes in the ductile iron matrix has been found not to be able to explain the behavioral pattern noticed experimentally in ductile iron especially when the material is subjected to biaxial loading and possibly even more complex loading. The use of graphite in a hole model has been proved to explain the behavior noticed experimentally in ductile iron such as the damping behavior, increasing elongation with increasing nodules and possible fracture initiation at voids because of strain. References [1] Walton C.F and Opar T.J. (1981): “Iron casting handbook covering data on Grey, Malleable and ductile iron, Iron casting Society Inc. New York. [2] Smith W.F., (1993): “Structure and properties of Engineering alloys”, 2 nd ed. McGraw- Hill, New York [3] Imasogie.B.I and Wendt.U. (2004) “Characterization of Graphite Particle Shape in Spheroidal Graphite Iron using a Computer-based Image Analyzer”, Journal of Minerals & Materials Characterization & Engineering, 3(1), 1-12,. [4] Ductile Iron Society (2006) “Ductile Iron Data for Design Engineers” http://www.ductile.org/didata/Section3/3part2.htm#Fracture%20Behaviour 84 O. Oluwole and O. Olorunniwo Vol.6, No.2 [5] Janowak.S.F,. Alagarsamy.A and Venugopalan.D (1990) “Fatigue strength of commercial ductile irons”, AFS Transactions, Vol.98, Pp.511-518. [6] Pundale. S.H., Rogers.R.J, Nadkarni.G.R (1998) ”Finite Element Modeling of Elastic Modulus in Ductile Irons: Effect of Graphite Morphology”, Journal of the American Foundrymen’s Society 98(102), 98-105 [7] Bailey.E (1997) “Transgranular Fracture Surface in Ductile Iron” ( sv.vt.edu/classes/.../97ClassProj/exper/bailey/www/bailey.html)  Vol.6, No.2 Simulation Studies of Nodule Iron 85 Figs. 1-16: Results For Uniaxial Loading in X-Direction. Fig.a: Uniaxial loading;other sides kept fixed. Fig.1: Stress in x-direction; graphite in hole model Fig.2: Stress in x-direction; hole model  86 O. Oluwole and O. Olorunniwo Vol.6, No.2 Fig.3: Stress in y-direction; graphite in hole model Fig.4: Stress in y-direction; hole model  Vol.6, No.2 Simulation Studies of Nodule Iron 87 Fig.5: Displacement in x-direction; graphite in hole model Fig.6: Displacement in x-direction; hole model 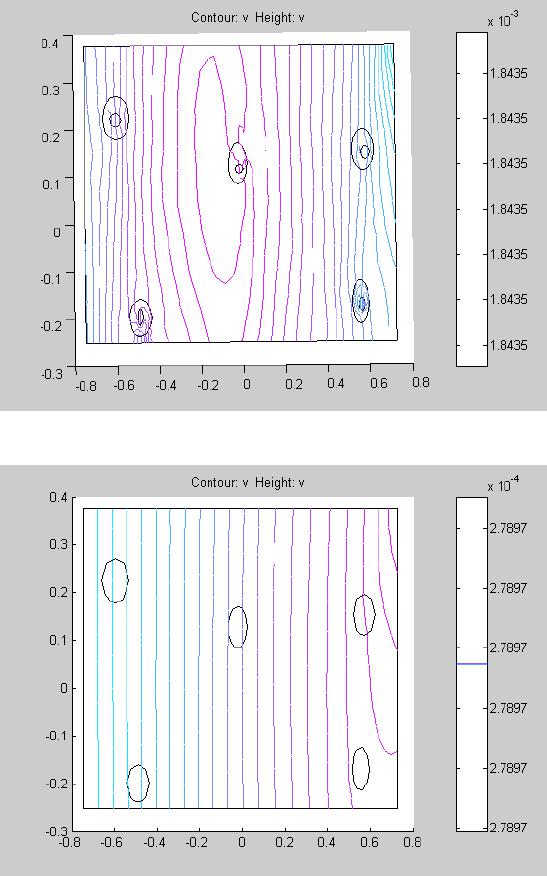 88 O. Oluwole and O. Olorunniwo Vol.6, No.2 Fig.7: Displacement in y-direction; graphite in hole model Fig.8: Displacement in y-direction; hole model. 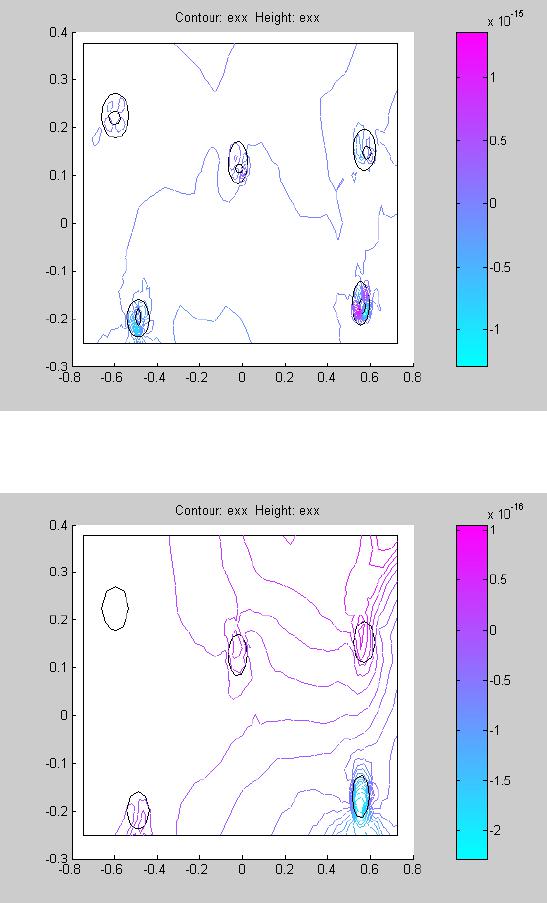 Vol.6, No.2 Simulation Studies of Nodule Iron 89 Fig.9: Strain in x-direction; graphite in hole model Fig.10: Strain in x-direction;hole model 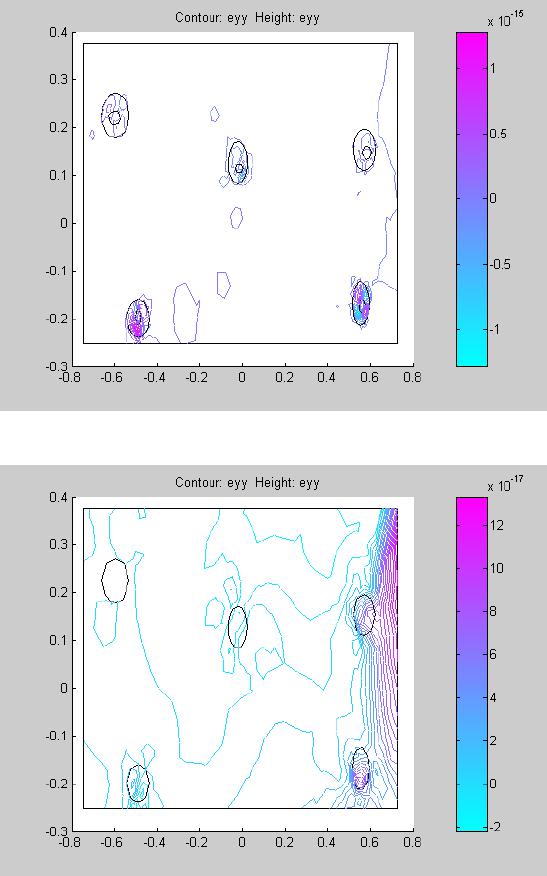 90 O. Oluwole and O. Olorunniwo Vol.6, No.2 Fig.11: Strain in y-direction; graphite in hole model Fig.12: Strain in y-direction; hole model  Vol.6, No.2 Simulation Studies of Nodule Iron 91 Fig.13: Shear stress; graphite in hole model Fig.14: Shear stress, hole model 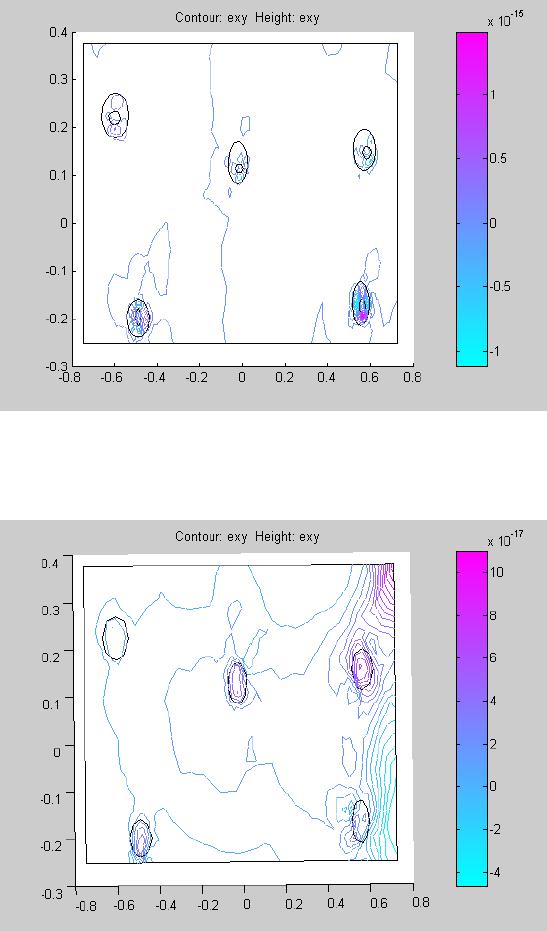 92 O. Oluwole and O. Olorunniwo Vol.6, No.2 Fig.15: Shear Strain; graphite in hole model Fig. 16: Shear strain; hole model 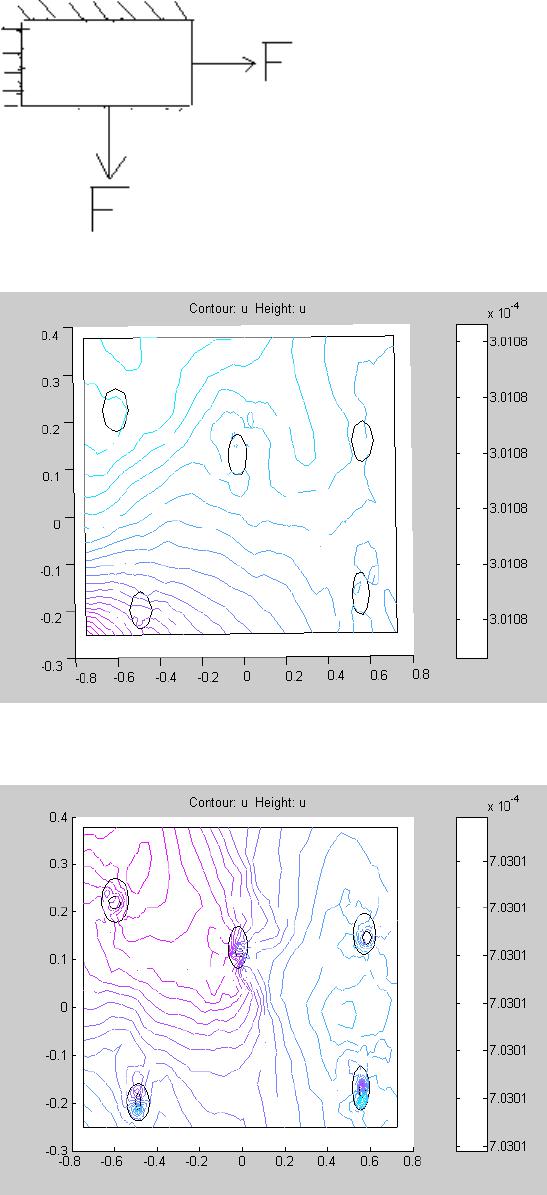 Vol.6, No.2 Simulation Studies of Nodule Iron 93 Figs. 17-32: Results For Biaxial Loading(i.e. in x and y direction) Fig.b: Biaxial loading; two sides fixed Fig.17: Displacementin x-direction under biaxial loading; hole model Fig.18: Displacement in x-direction under biaxial loading; graphite in hole model  94 O. Oluwole and O. Olorunniwo Vol.6, No.2 Fig.19: Displacements in y direction under biaxial stressing; hole model Fig.20: Displacements in y direction under biaxial stressing; graphite in hole model 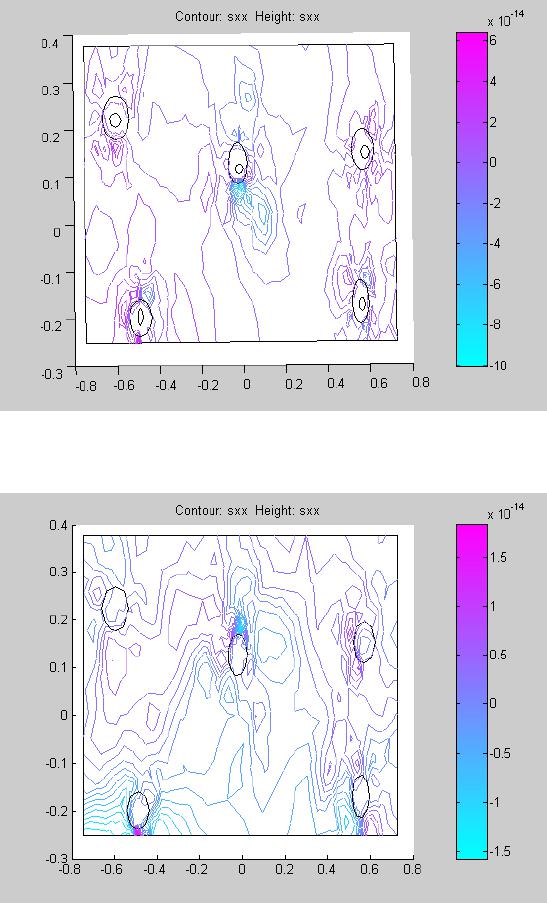 Vol.6, No.2 Simulation Studies of Nodule Iron 95 Fig.21: Stress concentration in x- direction under biaxial loading; graphite in hole model Fig.22: Stress concentration in x- direction under biaxial loading; hole model 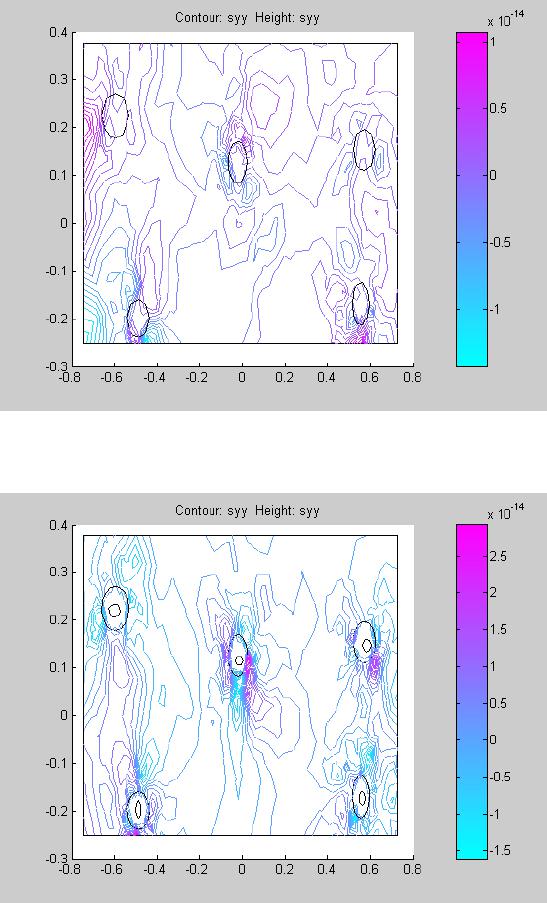 96 O. Oluwole and O. Olorunniwo Vol.6, No.2 Fig.23: Stress concentration in y- direction under biaxial loading; hole model Fig.24: Stress concentration in y- direction under biaxial loading; graphite in hole model  Vol.6, No.2 Simulation Studies of Nodule Iron 97 Fig.25: Strain lines in x- direction under biaxial loading; hole model Fig.26: Strain lines in x- direction under biaxial loading; graphite in hole model 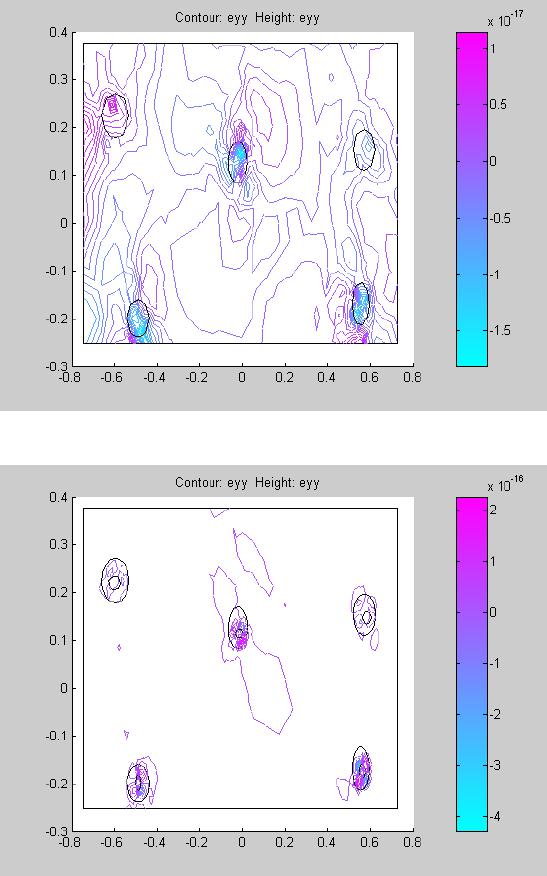 98 O. Oluwole and O. Olorunniwo Vol.6, No.2 Fig.27: Strain in y- direction under biaxial loading; hole model Fig.28: Strain in y- direction under biaxial loading; graphite in hole model  Vol.6, No.2 Simulation Studies of Nodule Iron 99 Fig.29: Shear stresses under biaxial loading; hole model Fig.30: Shear stresses under biaxial loading; graphite in hole model  100 O. Oluwole and O. Olorunniwo Vol.6, No.2 Fig.31: Shear strains under biaxial loading; hole model Fig.32: Shear strains under biaxial loading; graphite in hole model  Vol.6, No.2 Simulation Studies of Nodule Iron 101 Fig.33: Displacement in x-direction in biaxial loading of material with nodule count of eleven showing decrease in elongation as a result of increased nodule count compared toFig.18 Fig.34: Displacement in y-direction in biaxial loading of material with nodule count of eleven showing decrease in elongation as a result of increased nodule count compared to Fig.20 |