 Journal of Environmental Protection, 2010, 1, 143-154 doi:10.4236/jep.2010.12019 Published Online June 2010 (http://www.SciRP.org/journal/jep) Copyright © 2010 SciRes. JEP 1 Metallic Iron and Nickel in Cretaceous and Cenozoic Sediments: The Results of Thermomagnetic Analysis Diamar M. Pechersky Institute of Physics of the Earth, Russian Academy of Scienses, Moscow, Russia. Email: diamar1@front.ru Received December 6th, 2009; revised February 1st, 2010; accepted February 3rd, 2010. ABSTRACT With the aid of thermomagnetic analysis (TMA) up to 800ºС the composition and distribution of particles of native iron and Fe-Ni alloy was studied in 15 sections, Gams (Austria), Verhorechie and Selbuhra (Crimea), Kvirinaki and Tetrit- skaro (Georgia), Aimaki, Bass, Dzhengutaj, Madzhalis and Gergebil (North Caucasus, Russia), Klyuchi and Teplovka (Volga Region, Russia), Koshak (Kazakhstan), Kara-Kala and Khalats (Turkmenistan). The age of sediments varies from Miocene to Early Cretaceous. Iron particles are present at 521samples out of 921studied. Their percentage varies from 10 -5% to 0.05%. The distribution consists of two groups: 1) “zero” group (iron is not found by TMA); 2) group of logarithmic normal distribution with a differing modes. The global enrichment by iron particles in synchronous depos- its of Miocene, Maastrichtian-Danian, Santonian and Cenomanian was discovered. With respect to nickel content, the iron particles fall into two groups: 1) nearly pure iron without nickel; and 2) iron with nickel content up to 20%, with modal value of 5% . The source of iron particles is the cosmic dust. Particles of pure nickel and the alloy containing more of 20% of nickel are very rare. Possibly, such particles are related mainly with impact events. A peak of elevated iron content with nearly constant nickel of 5-6% was found in almost all studied sections. It is a global effect which is not dependent of place and time of deposition of iron particles. Keywords: Cosmic Dust, Metallic Iron, Nickel, Fe-Ni Alloy, Meteorites, Sediments, Thermomagnetic Analysis, Curie Point 1. Introduction Modern data on distribution of native iron and nickel in the cosmic dust is rather limited, since only “direct” me- thods of detecting such particles were used. Thermo- magnetic analysis (TMA) up to 800ºC was employed during petromagnetic (rock-magnetic) studies of sedi- ments [1-7]. The increase of ТMA temperature interval by 100о has given the chance to observe a detailed pic- ture of a distribution of metallic iron in space and time. Thermomagnetic investigations of composition and distribution of particles of native iron and Fe-Ni alloy was performed in 15 sediment sections: Gams (Austria, Upper Maastrichtian-Danian, 48oN, 15.2oE), Verhorechie and Selbuhra (Crimea, Barrem-Apt, Senomanian, 44.7oN, 34oE), Kvirinaki and Tetritskaro (Georgia, Miocene, Upper Maastrichtian-Danian, 42оN, 43oE), Aimaki, Bass, Dzhengutaj, Madzhalis and Gergebil (North Caucasus, Russia, Cretaceous, 42.1-42.9oN, 46-47.9oE), Klyuchi and Teplovka (Volga Region, Russia, Upper Maas- trichtian-Danian, 51.9oN, 46.5oE and 52.2oN, 46.2oE), Koshak (Kazakhstan, Mangyshlak, Upper Maastrichtian- Danian, 39.5oN, 54oE), Kara-Kala and Khalats (Turk- menistan, Upper Cretaceous, 38.47oN, 56.2oE and Mio- cene, 38oN, 58.3oE). The spatial spread of the objects, from Gams in the west to Khalats in the east, is approximately 3000km. It allows to evaluate the global character of accumulation of cosmic particles in coeval deposits. Detailed selection of samples from Cretaceous sequences helps to find out features of accumulation of particles in time. 2. Methods of Petromagnetic Studies Petromagnetic studies included measurements of sample magnetization and its dependence upon temperature, i.e. thermomagnetic analysis (TMA). TMA was carried out with the aid of Curie express balance [8]. The curves of М (T) after the first and second heating to 800°C were obtained for all samples. It is possible to analyze distri- bution of Curie points. It is known that in particles of cosmic iron the basic impurity is nickel. Converting Cu- rie points into Ni content facilitates subsequent compari- son of TMA data with those of microprobe and other analyses. 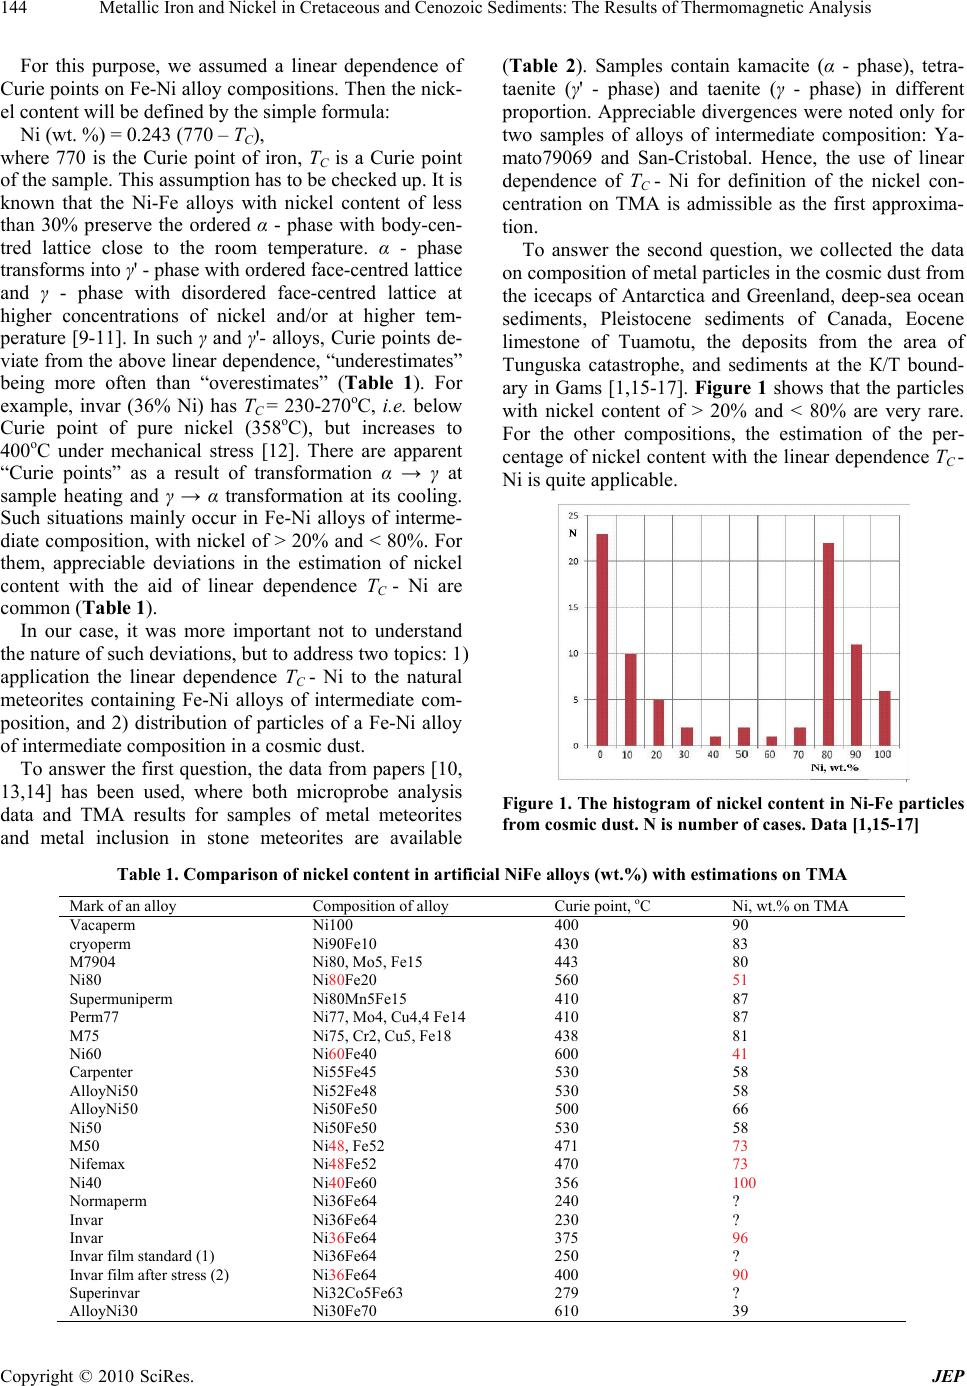 144 Metallic Iron and Nickel in Cretaceous and Cenozoic Sediments: The Results of Thermomagnetic Analysis For this purpose, we assumed a linear dependence of Curie points on Fe-Ni alloy compositions. Then the nick- el content will be defined by the simple formula: Ni (wt. %) = 0.243 (770 – TC), where 770 is the Curie point of iron, TC is a Curie point of the sample. This assumption has to be checked up. It is known that the Ni-Fe alloys with nickel content of less than 30% preserve the ordered α - phase with body-cen- tred lattice close to the room temperature. α - phase transforms into γ' - phase with ordered face-centred lattice and γ - phase with disordered face-centred lattice at higher concentrations of nickel and/or at higher tem- perature [9-11]. In such γ and γ'- alloys, Curie points de- viate from the above linear dependence, “underestimates” being more often than “overestimates” (Table 1). For example, invar (36% Ni) has TC = 230-270oC, i.e. below Curie point of pure nickel (358оС), but increases to 400оС under mechanical stress [12]. There are apparent “Curie points” as a result of transformation α → γ at sample heating and γ → α transformation at its cooling. Such situations mainly occur in Fe-Ni alloys of interme- diate composition, with nickel of > 20% and < 80%. For them, appreciable deviations in the estimation of nickel content with the aid of linear dependence ТС - Ni are common (Table 1). In our case, it was more important not to understand the nature of such deviations, but to address two topics: 1) application the linear dependence ТС - Ni to the natural meteorites containing Fe-Ni alloys of intermediate com- position, and 2) distribution of particles of a Fe-Ni alloy of intermediate composition in a cosmic dust. To answer the first question, the data from papers [10, 13,14] has been used, where both microprobe analysis data and ТMA results for samples of metal meteorites and metal inclusion in stone meteorites are available (Table 2). Samples contain kamacite (α - phase), tetra- taenite (γ' - phase) and taenite (γ - phase) in different proportion. Appreciable divergences were noted only for two samples of alloys of intermediate composition: Ya- mato79069 and San-Cristobal. Hence, the use of linear dependence of TC - Ni for definition of the nickel con- centration on ТMA is admissible as the first approxima- tion. To answer the second question, we collected the data on composition of metal particles in the cosmic dust from the icecaps of Antarctica and Greenland, deep-sea ocean sediments, Pleistocene sediments of Canada, Eocene limestone of Tuamotu, the deposits from the area of Tunguska catastrophe, and sediments at the К/Т bound- ary in Gams [1,15-17]. Figure 1 shows that the particles with nickel content of > 20% and < 80% are very rare. For the other compositions, the estimation of the per- centage of nickel content with the linear dependence ТС - Ni is quite applicable. Figure 1. The histogram of nickel content in Ni-Fe particles from cosmic dust. N is number of cases. Data [1,15-17] Table 1. Comparison of nickel content in artificial NiFe alloys (wt.%) with estimations on ТМА Mark of an alloy Composition of alloy Curie point, оC Ni, wt.% on ТМА Vacaperm Ni100 400 90 cryoperm Ni90Fe10 430 83 M7904 Ni80, Мо5, Fe15 443 80 Ni80 Ni80Fe20 560 51 Supermuniperm Ni80Mn5Fe15 410 87 Perm77 Ni77, Mo4, Cu4,4 Fe14 410 87 M75 Ni75, Cr2, Cu5, Fe18 438 81 Ni60 Ni60Fe40 600 41 Carpenter Ni55Fe45 530 58 AlloyNi50 Ni52Fe48 530 58 AlloyNi50 Ni50Fe50 500 66 Ni50 Ni50Fe50 530 58 M50 Ni48, Fe52 471 73 Nifemax Ni48Fe52 470 73 Ni40 Ni40Fe60 356 100 Normaperm Ni36Fe64 240 ? Invar Ni36Fe64 230 ? Invar Ni36Fe64 375 96 Invar film standard (1) Ni36Fe64 250 ? Invar film after stress (2) Ni36Fe64 400 90 Superinvar Ni32Co5Fe63 279 ? AlloyNi30 Ni30Fe70 610 39 Copyright © 2010 SciRes. JEP 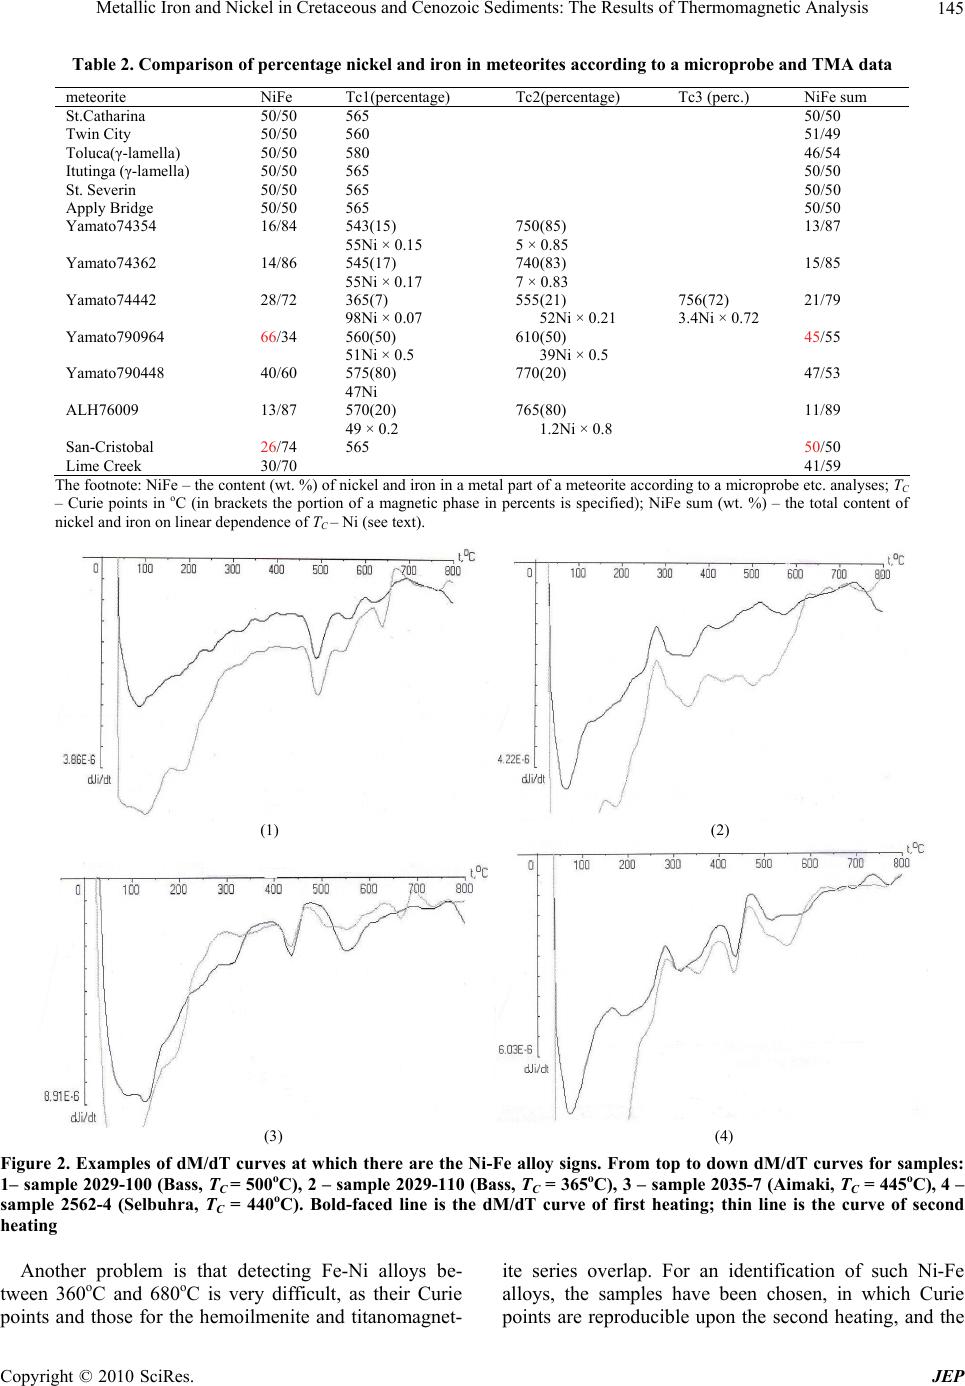 Metallic Iron and Nickel in Cretaceous and Cenozoic Sediments: The Results of Thermomagnetic Analysis145 Table 2. Comparison of percentage nickel and iron in meteorites according to a microprobe and ТМА data meteorite NiFe Tc1(percentage) Tc2(percentage) Tc3 (perc.) NiFe sum St.Catharina 50/50 565 50/50 Twin City 50/50 560 51/49 Toluca(γ-lamella) 50/50 580 46/54 Itutinga (γ-lamella) 50/50 565 50/50 St. Severin 50/50 565 50/50 Apply Bridge 50/50 565 50/50 Yamato74354 16/84 543(15) 55Ni × 0.15 750(85) 5 × 0.85 13/87 Yamato74362 14/86 545(17) 55Ni × 0.17 740(83) 7 × 0.83 15/85 Yamato74442 28/72 365(7) 98Ni × 0.07 555(21) 52Ni × 0.21 756(72) 3.4Ni × 0.72 21/79 Yamato790964 66/34 560(50) 51Ni × 0.5 610(50) 39Ni × 0.5 45/55 Yamato790448 40/60 575(80) 47Ni 770(20) 47/53 ALH76009 13/87 570(20) 49 × 0.2 765(80) 1.2Ni × 0.8 11/89 San-Cristobal 26/74 565 50/50 Lime Creek 30/70 41/59 The footnote: NiFe – the content (wt. %) of nickel and iron in a metal part of a meteorite according to a microprobe etc. analyses; TC – Curie points in oC (in brackets the portion of a magnetic phase in percents is specified); NiFe sum (wt. %) – the total content of nickel and iron on linear dependence of TC – Ni (see text). (1) (2) (3) (4) Figure 2. Examples of dM/dT curves at which there are the Ni-Fe alloy signs. From top to down dM/dT curves for samples: 1– sample 2029-100 (Bass, ТC = 500оC), 2 – sample 2029-110 (Bass, ТC = 365оC), 3 – sample 2035-7 (Aimaki, ТC = 445оC), 4 – sample 2562-4 (Selbuhra, ТC = 440оC). Bold-faced line is the dM/dT curve of first heating; thin line is the curve of second heating Another problem is that detecting Fe-Ni alloys be- tween 360оC and 680оC is very difficult, as their Curie points and those for the hemoilmenite and titanomagnet- ite series overlap. For an identification of such Ni-Fe alloys, the samples have been chosen, in which Curie points are reproducible upon the second heating, and the Copyright © 2010 SciRes. JEP 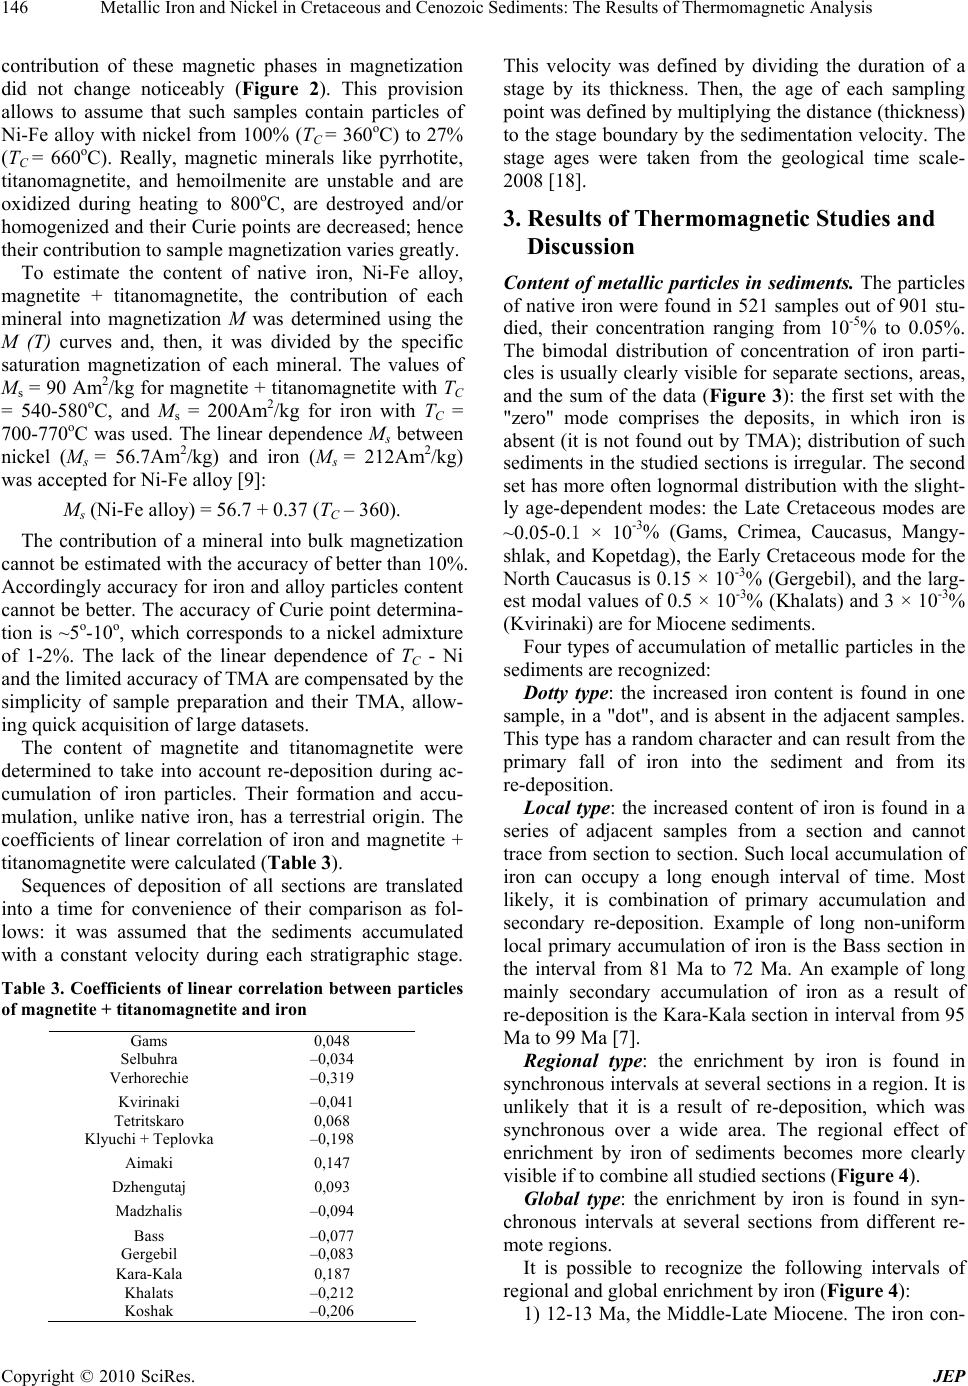 146 Metallic Iron and Nickel in Cretaceous and Cenozoic Sediments: The Results of Thermomagnetic Analysis contribution of these magnetic phases in magnetization did not change noticeably (Figure 2). This provision allows to assume that such samples contain particles of Ni-Fe alloy with nickel from 100% (ТC = 360оС) to 27% (ТC = 660оС). Really, magnetic minerals like pyrrhotite, titanomagnetite, and hemoilmenite are unstable and are oxidized during heating to 800оС, are destroyed and/or homogenized and their Curie points are decreased; hence their contribution to sample magnetization varies greatly. To estimate the content of native iron, Ni-Fe alloy, magnetite + titanomagnetite, the contribution of each mineral into magnetization M was determined using the M (T) curves and, then, it was divided by the specific saturation magnetization of each mineral. The values of Ms = 90 Аm2/kg for magnetite + titanomagnetite with TC = 540-580oC, and Ms = 200Аm2/kg for iron with TC = 700-770oC was used. The linear dependence Ms between nickel (Мs = 56.7Аm2/kg) and iron (Мs = 212Аm2/kg) was accepted for Ni-Fe alloy [9]: Мs (Ni-Fe alloy) = 56.7 + 0.37 (ТC – 360). The contribution of a mineral into bulk magnetization cannot be estimated with the accuracy of better than 10%. Accordingly accuracy for iron and alloy particles content cannot be better. The accuracy of Curie point determina- tion is ~5о-10o, which corresponds to a nickel admixture of 1-2%. The lack of the linear dependence of TC - Ni and the limited accuracy of ТMA are compensated by the simplicity of sample preparation and their TMA, allow- ing quick acquisition of large datasets. The content of magnetite and titanomagnetite were determined to take into account re-deposition during ac- cumulation of iron particles. Their formation and accu- mulation, unlike native iron, has a terrestrial origin. The coefficients of linear correlation of iron and magnetite + titanomagnetite were calculated (Table 3). Sequences of deposition of all sections are translated into a time for convenience of their comparison as fol- lows: it was assumed that the sediments accumulated with a constant velocity during each stratigraphic stage. Table 3. Coefficients of linear correlation between particles of magnetite + titanomagnetite and iron Gams 0,048 Selbuhra –0,034 Verhorechie –0,319 Kvirinaki –0,041 Tetritskaro 0,068 Klyuchi + Teplovka –0,198 Aimaki 0,147 Dzhengutaj 0,093 Madzhalis –0,094 Bass –0,077 Gergebil –0,083 Kara-Kala 0,187 Khalats –0,212 Koshak –0,206 This velocity was defined by dividing the duration of a stage by its thickness. Then, the age of each sampling point was defined by multiplying the distance (thickness) to the stage boundary by the sedimentation velocity. The stage ages were taken from the geological time scale- 2008 [18]. 3. Results of Thermomagnetic Studies and Discussion Content of metallic particles in sediments. The particles of native iron were found in 521 samples out of 901 stu- died, their concentration ranging from 10-5% to 0.05%. The bimodal distribution of concentration of iron parti- cles is usually clearly visible for separate sections, areas, and the sum of the data (Figure 3): the first set with the "zero" mode comprises the deposits, in which iron is absent (it is not found out by ТMA); distribution of such sediments in the studied sections is irregular. The second set has more often lognormal distribution with the slight- ly age-dependent modes: the Late Cretaceous modes are ~0.05-0.1 × 10⁻³% (Gams, Crimea, Caucasus, Mangy- shlak, and Kopetdag), the Early Cretaceous mode for the North Caucasus is 0.15 × 10⁻³% (Gergebil), and the larg- est modal values of 0.5 × 10⁻³% (Khalats) and 3 × 10⁻³% (Kvirinaki) are for Miocene sediments. Four types of accumulation of metallic particles in the sediments are recognized: Dotty type: the increased iron content is found in one sample, in a "dot", and is absent in the adjacent samples. This type has a random character and can result from the primary fall of iron into the sediment and from its re-deposition. Local type: the increased content of iron is found in a series of adjacent samples from a section and cannot trace from section to section. Such local accumulation of iron can occupy a long enough interval of time. Most likely, it is combination of primary accumulation and secondary re-deposition. Example of long non-uniform local primary accumulation of iron is the Bass section in the interval from 81 Ma to 72 Ma. An example of long mainly secondary accumulation of iron as a result of re-deposition is the Kara-Kala section in interval from 95 Ma to 99 Ma [7]. Regional type: the enrichment by iron is found in synchronous intervals at several sections in a region. It is unlikely that it is a result of re-deposition, which was synchronous over a wide area. The regional effect of enrichment by iron of sediments becomes more clearly visible if to combine all studied sections (Figure 4). Global type: the enrichment by iron is found in syn- chronous intervals at several sections from different re- mote regions. It is possible to recognize the following intervals of regional and global enrichment by iron (Figure 4): 1) 12-13 Ma, the Middle-Late Miocene. The iron con- Copyright © 2010 SciRes. JEP  Metallic Iron and Nickel in Cretaceous and Cenozoic Sediments: The Results of Thermomagnetic Analysis Copyright © 2010 SciRes. JEP 147 tent that reaches 4 × 10⁻³% is found at two sections (Kha- lats and Kvirinaki) that are more than 1500 km apart. 2) 64-67 Ma, Early Danian-Late Maastrichtian. The iron content that reaches 4 × 10⁻³% is found in the Gams, North Caucasus, Teplovka sections, but isn’t detected in the Crimea, Tetritskaro, and Koshak sections. 3) 84-86 Ma, Santonian. The increased iron concentra- tion is found at five sections that are more 1000 km apart, with the maximum content ranging from 0.2 × 10⁻³% (Madzhalis) to 2.9 × 10⁻³% (Kara-Kala). This interval nearly coincides with the upper boundary of the Dzhalal paleomagnetic hyperchron (the interval of the geomag- netic field without reversals, 125-85 Ma [19]). The lower boundary of the Dzhalal hyperchron is not defined accu- rately, probably because of sparse sampling at the Ger- gebil (Caucasus) and Verhorechie (Crimea) sections (Fig- ure 4). 4) 94-96 Ma, Late Cenomanian. The increased iron concentration is found at the Aimaki (94.9-95.6 Ma) and Kara-Kala (93.8-97.4 Ma) sections that are more than 1000 km apart. With a less certainty, this interval can be related to the global enrichment by iron because of some role of iron re-deposition in the lower parts of both sec- tions [7]. The wide spatial distribution of iron particles and global character of the above noted intervals of the in- creased iron concentration testifies to the cosmic dust as their main cause. The iron particles fell on the Earth sur- face irregularly and probably came from different sources, as is indicated by the bimodal distribution of their concentrations (Figure 3). In contrast to iron particles, the particles of Ni-Fe alloy with > 20% Ni are rare, their concentration does not cor- relate with the concentration of iron particles (r = –0.045). Appreciable correlation with the magnetite + titanomag- netite concentration (r = 0.7) in the sediments may mean that the noticeable part of these particles is not a Ni-Fe alloy, while the terrestrial minerals, like titanomagnetite and hemoilmenite, are fully preserved after heating to 800оС, which is unlikely. Otherwise, these are the parti- cles of a Ni-Fe alloy that were re-deposited together with terrestrial minerals. Such a sharp difference in the quan- tity and accumulation conditions between iron and Ni-Fe alloy particles and the absence of correlation between their contents most likely testifies to their different origin. If the first are produced by cosmic dust fall on the Earth surface, the second are possibly connected with impact events. Irrespective of the reliability of detecting Ni-Fe alloy particles, it is possible to assert that their concentra- tion is likely to be below 10-5% (i.e., below of sensitivity threshold of ТMA) in the cosmic dust. Figure 3. Histograms of iron particles concentrations in the studied sections. Intervals of iron concentrations (logarith- mic scale): 1 – 0-0.01(10-3%); 2 – 0.01-0.03; 3 – 0.03-0.07; 4 – 0.07-0.15; 5 – 0.15-0.31; 6 – 0.31-0.63; 7 – 0.63-1.27; 8 – 1.27-2.55; 9 – 2.55-5.11; 10 – 5.11-10.23; 11 – 10.23-20.49; 12 – 20.49-54 (10-3%). Histograms are arranged on age from Miocene to Early Cretaceous Composition of metallic particles. Judging by the Cu- rie points, composition of iron particles varies approxi- mately in the same range from 680оC to 780оC in all sec- tions that corresponds to Ni-content from 22% to zero 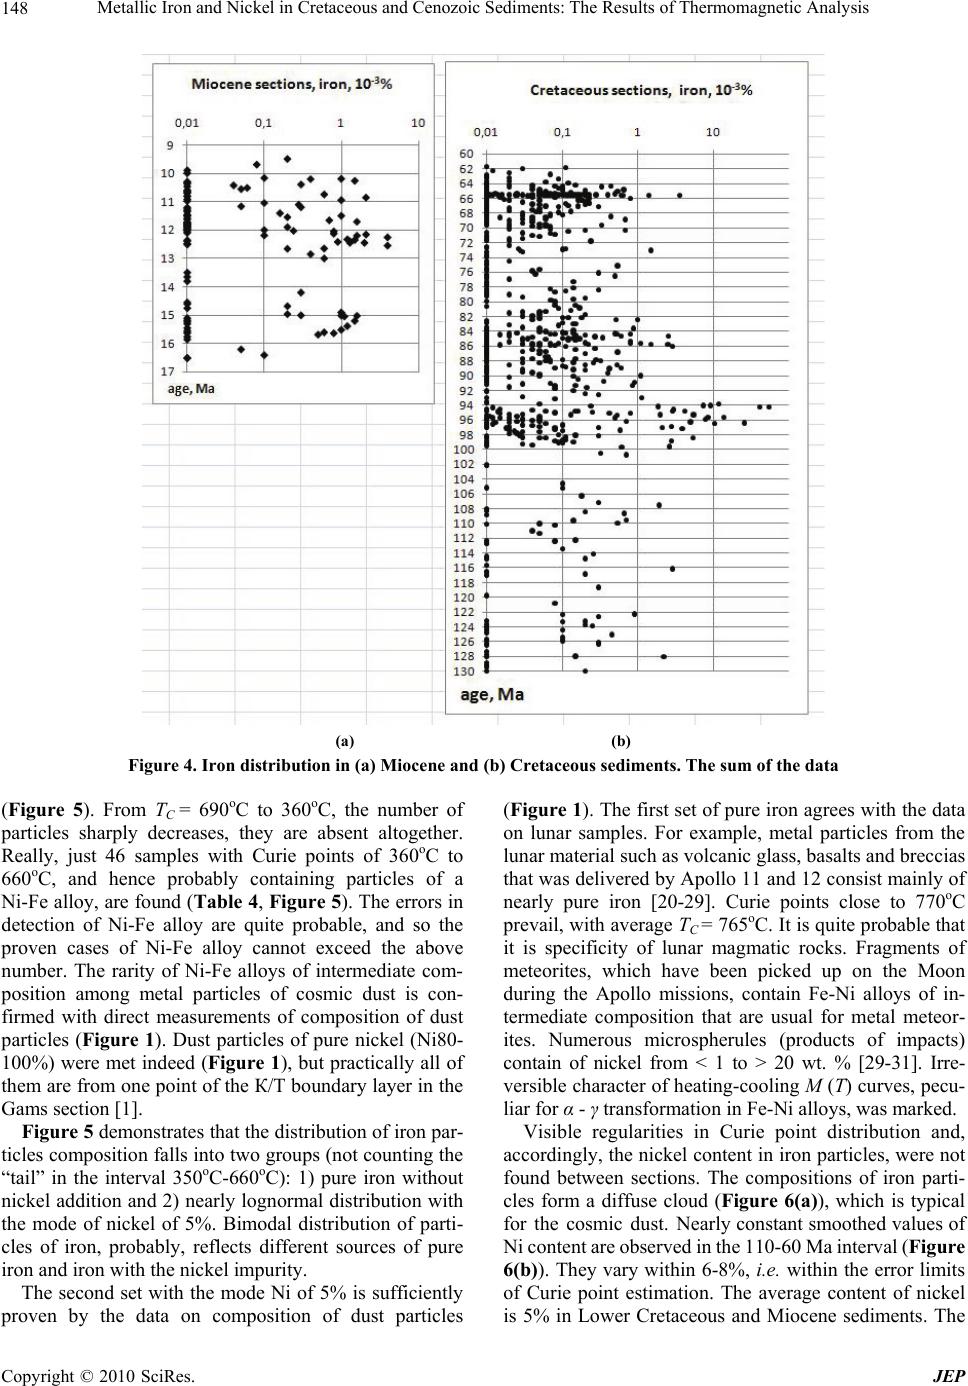 Metallic Iron and Nickel in Cretaceous and Cenozoic Sediments: The Results of Thermomagnetic Analysis 148 (a) (b) Figure 4. Iron distribution in (a) Miocene and (b) Cretaceous sediments. The sum of the data (Figure 5). From TC = 690oC to 360оC, the number of particles sharply decreases, they are absent altogether. Really, just 46 samples with Curie points of 360oC to 660оC, and hence probably containing particles of a Ni-Fe alloy, are found (Table 4, Figure 5). The errors in detection of Ni-Fe alloy are quite probable, and so the proven cases of Ni-Fe alloy cannot exceed the above number. The rarity of Ni-Fe alloys of intermediate com- position among metal particles of cosmic dust is con- firmed with direct measurements of composition of dust particles (Figure 1). Dust particles of pure nickel (Ni80- 100%) were met indeed (Figure 1), but practically all of them are from one point of the К/Т boundary layer in the Gams section [1]. Figure 5 demonstrates that the distribution of iron par- ticles composition falls into two groups (not counting the “tail” in the interval 350oC-660оС): 1) pure iron without nickel addition and 2) nearly lognormal distribution with the mode of nickel of 5%. Bimodal distribution of parti- cles of iron, probably, reflects different sources of pure iron and iron with the nickel impurity. The second set with the mode Ni of 5% is sufficiently proven by the data on composition of dust particles (Figure 1). The first set of pure iron agrees with the data on lunar samples. For example, metal particles from the lunar material such as volcanic glass, basalts and breccias that was delivered by Apollo 11 and 12 consist mainly of nearly pure iron [20-29]. Curie points close to 770оC prevail, with average TC = 765oC. It is quite probable that it is specificity of lunar magmatic rocks. Fragments of meteorites, which have been picked up on the Moon during the Apollo missions, contain Fe-Ni alloys of in- termediate composition that are usual for metal meteor- ites. Numerous microspherules (products of impacts) contain of nickel from < 1 to > 20 wt. % [29-31]. Irre- versible character of heating-cooling M (T) curves, pecu- liar for α - γ transformation in Fe-Ni alloys, was marked. Visible regularities in Curie point distribution and, accordingly, the nickel content in iron particles, were not found between sections. The compositions of iron parti- cles form a diffuse cloud (Figure 6(а)), which is typical for the cosmic dust. Nearly constant smoothed values of Ni content are observed in the 110-60 Ma interval (Figure 6(b)). They vary within 6-8%, i.e. within the error limits of Curie point estimation. The average content of nickel is 5% in Lower Cretaceous and Miocene sediments. The Copyright © 2010 SciRes. JEP 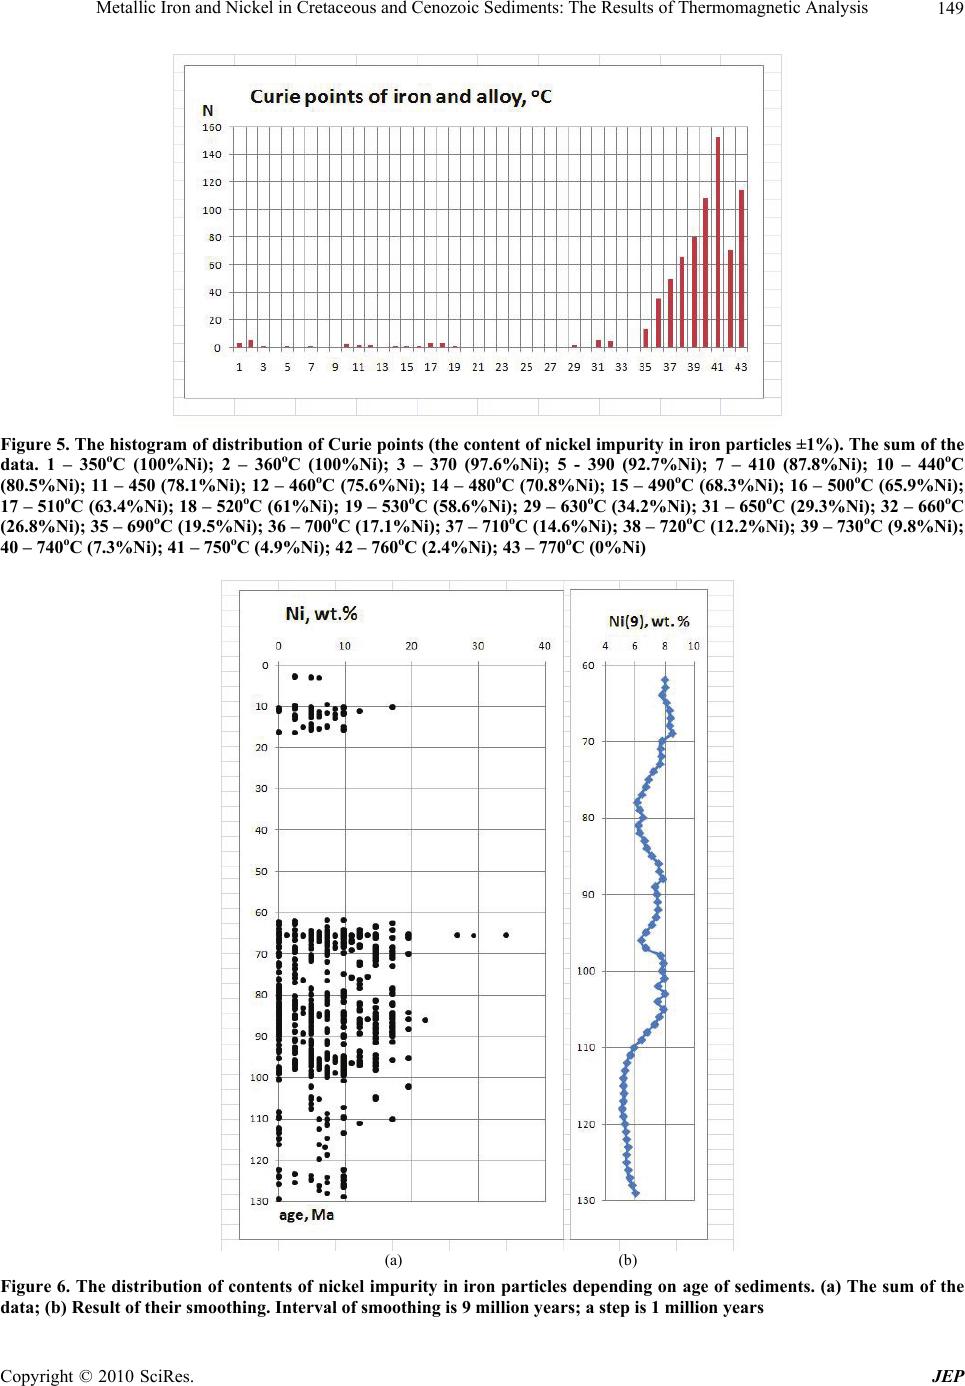 Metallic Iron and Nickel in Cretaceous and Cenozoic Sediments: The Results of Thermomagnetic Analysis 149 Figure 5. The histogram of distribution of Curie points (the content of nickel impurity in iron particles ±1%). The sum of the data. 1 – 350оC (100%Ni); 2 – 360оC (100%Ni); 3 – 370 (97.6%Ni); 5 - 390 (92.7%Ni); 7 – 410 (87.8%Ni); 10 – 440оC (80.5%Ni); 11 – 450 (78.1%Ni); 12 – 460оC (75.6%Ni); 14 – 480оC (70.8%Ni); 15 – 490оC (68.3%Ni); 16 – 500оC (65.9%Ni); 17 – 510оC (63.4%Ni); 18 – 520оC (61%Ni); 19 – 530оC (58.6%Ni); 29 – 630оC (34.2%Ni); 31 – 650оC (29.3%Ni); 32 – 660оC (26.8%Ni); 35 – 690оC (19.5%Ni); 36 – 700оC (17.1%Ni); 37 – 710оC (14.6%Ni); 38 – 720оC (12.2%Ni); 39 – 730оC (9.8%Ni); 40 – 740оC (7.3%Ni); 41 – 750оC (4.9%Ni); 42 – 760оC (2.4%Ni); 43 – 770оC (0%Ni) (a) (b) Figure 6. The distribution of contents of nickel impurity in iron particles depending on age of sediments. (a) The sum of the data; (b) Result of their smoothing. Interval of smoothing is 9 million years; a step is 1 million years Copyright © 2010 SciRes. JEP  150 Metallic Iron and Nickel in Cretaceous and Cenozoic Sediments: The Results of Thermomagnetic Analysis Copyright © 2010 SciRes. JEP Table 4. Ni-Fe-alloys in sediments section Sample TC %Ni Ni Fe МТ Ма N N(Fe) N(Ni) Aimaki 2035-7 450 78,5 0,11 0,09 1 99,06 112 60 1 Bass 2029-110 370 97 0,1 0 0,4 62,78 104 57 2 2029-100 500 66,6 0,08 0,01 0,3 64,96 Gergebil 2038-206 460 76,2 0,12 0 0,9 110,13 44 36 4 83 380 93 0,4 0 2 123,8 31 455 77,4 0,3 0 24,5 127,36 6 360 100 0,35 0 23,2 129,43 Madzhalis 2061-48 440 81 0,02 0 0,7 86,1 57 39 2 37 365 98 0,05 0 0,3 87,2 Dzhengutaj 2057-78 445 79,7 0,04 0,8 1,28 84,4 13 8 2 19 455 77,4 0,03 0,03 1,3 89,5 Karakala 2048-128 455 77,4 0,13 0,04 6,3 69,72 181 98 3 138 450 78,5 0,05 0,03 2 70,64 175 440 81 0,01 0,01 8,6 74,5 Selbuhra 2562-4 440 81 0,1 0,14 0,8 99,02 46 36 2 2562-7 440 81 0,07 0,12 0,75 98,44 Kvirinaki 384 525 60 0,46 1,1 20 15,04 77 31 2? 385 515? 63,1 0,45 0,2 20 14,96 Klyuchi 2 370 97 0,08 0,12 0,5 65,7 9 3 2 3 390? 92,8 0,07 0,02 1,6 65,6 Teplovka 10 5 0 Koshak 104 455 77,4 0,02 0,02 0,15 67,3 20 13 1 Tetritskaro 1--1 475 72,6 0,09 0 0,17 65,5 81 37 13 1--4 485 70,2 0,04 0 0,02 65,5 5 360? 100 0,11 0 0,12 65,47 6 530? 59,5 0,0040 0,1 65,45 14 410? 88,1 0,02 0 0,4 64,94 15 635? 34,5 0,03 0 1 64,81 19--1 355 100 0,12 0,07 1 65,51 21 350? 100 0,03 0,02 0,4 65,52 23 350? 100 0,02 0 7,6 65,54 24 355 100 0,21 0,05 2,6 65,58 25 355? 100 0,09 0 1,3 65,65 39 350? 100 0,06 0 0,9 67,1 глина б. 515 63,1 0,1 0 0,7 65,5 Khalats 16-68 350? 100 0,06 0,1 3 16,4 49 30 7 41-68 510? 64,3 0,13 1,5 11,5 12,35 44-68 515 63,1 0,08 0,1 8 12 49-68 510? 64,3 0,13 1 12 10,95 54-68 510? 64,3 0,14 0,3 14,5 10,4 59-68 510 64,3 0,09 0,2 10 9,5 68-68 505? 65,5 0,18 0 18 2,85 Gams J6 355 100 200 0,05 50 65,5 98 68 2 J4 355 100 5 0,05 2 65,5 J3-1 650 22 0,2 0,2 5 65,5 J4-1 650 22 0,19 0,16 6 65,5 T14 660 27 0,09 0,1 8 65,47 sum 901 521 43 Footnote: TC – Curie point of Ni-Fe alloy particles, oC; %Ni – content of nickel in alloy, determined by linear dependence TC – Ni; Ni – percentage of Ni-Fe alloy (10-3%) in sample; Fe – percentage of iron (10-3%) in the same sample; МТ– percentage of magnetite + titanomagnetite (10-3%) in the same sample; Ma – the age of sediment in the point of selection of the sample; N – total number measured ТМА samples in the given section; N (Fe) – number of samples in which iron particles are revealed; N (Ni) - number of samples in which Ni-Fe alloy with TC < 670°C is found out. 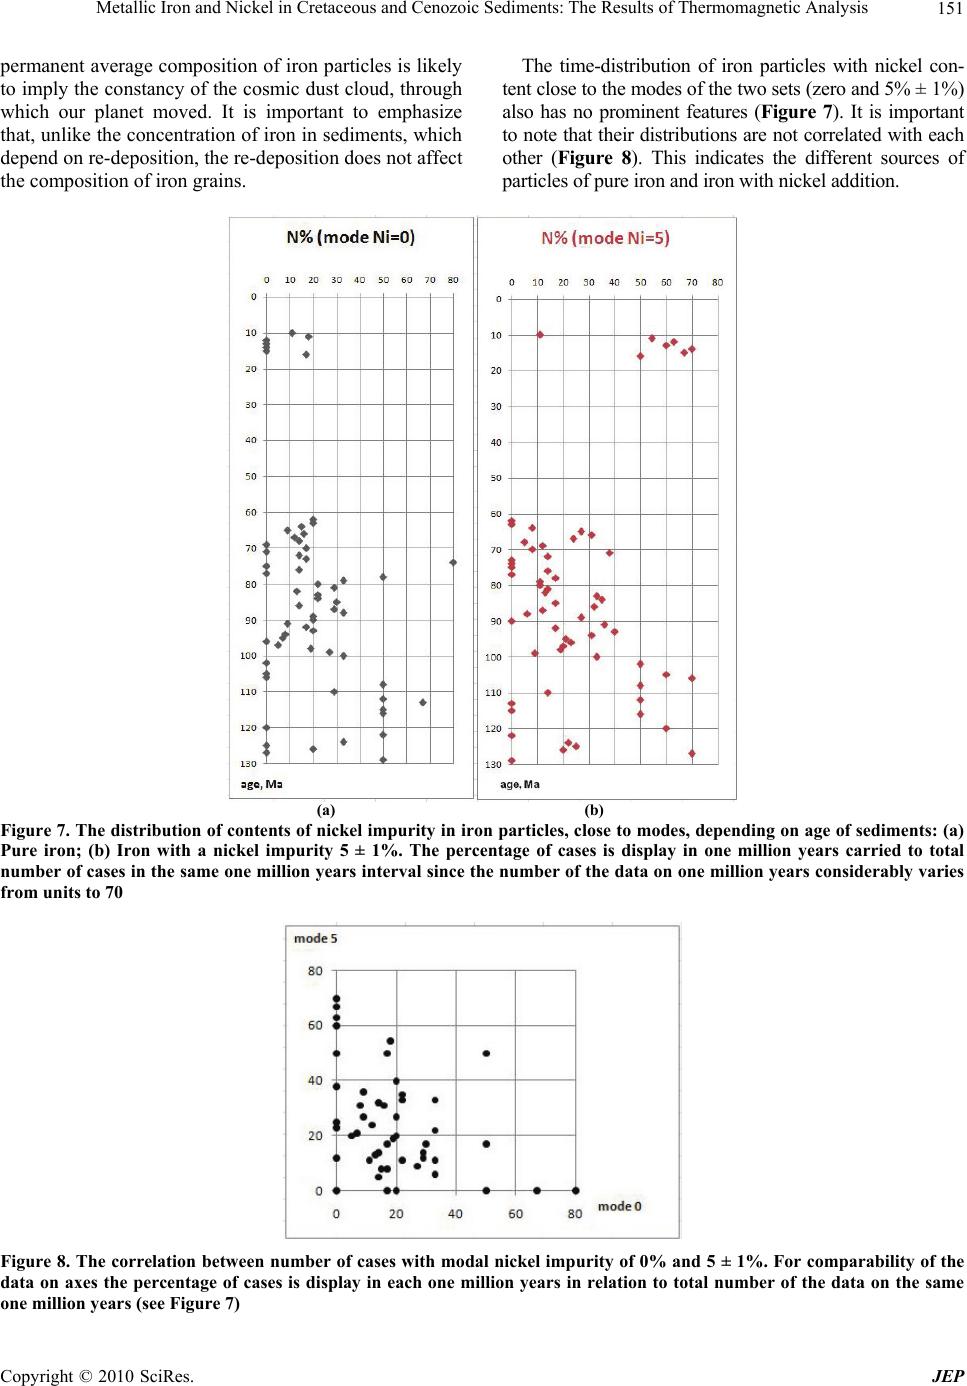 Metallic Iron and Nickel in Cretaceous and Cenozoic Sediments: The Results of Thermomagnetic Analysis 151 permanent average composition of iron particles is likely to imply the constancy of the cosmic dust cloud, through which our planet moved. It is important to emphasize that, unlike the concentration of iron in sediments, which depend on re-deposition, the re-deposition does not affect the composition of iron grains. The time-distribution of iron particles with nickel con- tent close to the modes of the two sets (zero and 5% ± 1%) also has no prominent features (Figure 7). It is important to note that their distributions are not correlated with each other (Figure 8). This indicates the different sources of particles of pure iron and iron with nickel addition. (a) (b) Figure 7. The distribution of contents of nickel impurity in iron particles, close to modes, depending on age of sediments: (a) Pure iron; (b) Iron with a nickel impurity 5 ± 1%. The percentage of cases is display in one million years carried to total number of cases in the same one million years interval since the number of the data on one million years considerably varies from units to 70 Figure 8. The correlation between number of cases with modal nickel impurity of 0% and 5 ± 1%. For comparability of the data on axes the percentage of cases is display in each one million years in relation to total number of the data on the same one million years (see Figure 7) Copyright © 2010 SciRes. JEP  Metallic Iron and Nickel in Cretaceous and Cenozoic Sediments: The Results of Thermomagnetic Analysis 152 During four intervals of global enrichment of sedi- ments by iron, the particles of the second set (Fe with Ni addition) obviously prevail (Figure 9). The number of cases of pure iron is insignificant and varies from interval to interval: 1) Just one sample with pure iron out 16 ТMA data is found for the 10-13 Ma interval. The nickel content varies from 3% to 10%, 5.2% on average. 2) For the 64-66 Ma interval, pure iron is found in eight cases out of 150 ТMA data. The nickel admixture varies from 2 to 34%, 7.6% on average. 3) For the interval 84-86 Ma, pure iron is found in twelve cases out of 68 ТMA data. The nickel admixture varies from 2 to 20%, 8.4% on average. 4) For the 94-96 Ma interval, pure iron is de- tected in two cases out of 48 ТMA data. The nickel ad- mixture varies from 2 to 20%, 8.1% on average. So, the average nickel contents nearly coincide in the Late Cre- taceous intervals and significantly differ in the Miocene. No correlation between the concentration of iron parti- cles and the nickel content in them is observed (r = –0,024). On this background, a peak of enrichment by iron with almost constant nickel content of 5% is visible, irrespective of the place and age of sediments (Figure 10). This enrichment is found even in Crimea, where the iron content very low (Figure 10). Thus this is a certain global effect. 4. Conclusions The detailed pattern of distribution of native iron parti- cles in place and time during the Cretaceous, Danian and Miocene is discovered with the aid of thermomagnetic analysis up to 800ºС. The main results of our studies are as follows: 1) The concentration of native iron particles in sedi- ments ranges from 10-5% to 0.05%; they are found in 521 samples out of 921 studied from 15 Cretaceous, Danian and Miocene sections of Austria, Russia (the Volga re- gion, Caucasus), Georgia, Kazakhstan and Turkmenistan. Irrespective of sediment age and locality, their bimodal distribution is typical. The first set with the zero mode includes the sediments, in which iron is not revealed by ТMA; the distribution of such deposits in the studied sections is irregular and likely reflects the non-uniformity of iron particle fall. The second set has lognormal distri- bution with the mode of 0.04-0.15 (10-3%). 2) The global enrichment by iron particles is discov- ered in Miocene (12-13 Ma), Maastrichtian-Danian (64-66 Ma), Santonian (84-86 Ma) and Cenomanian (94-96 Ma) deposits in the sections more than 1000km apart. The omnipresence of iron particles and global spread Figure 9. The content of nickel impurity in intervals of global enrichment of iron particles in sediments Copyright © 2010 SciRes. JEP 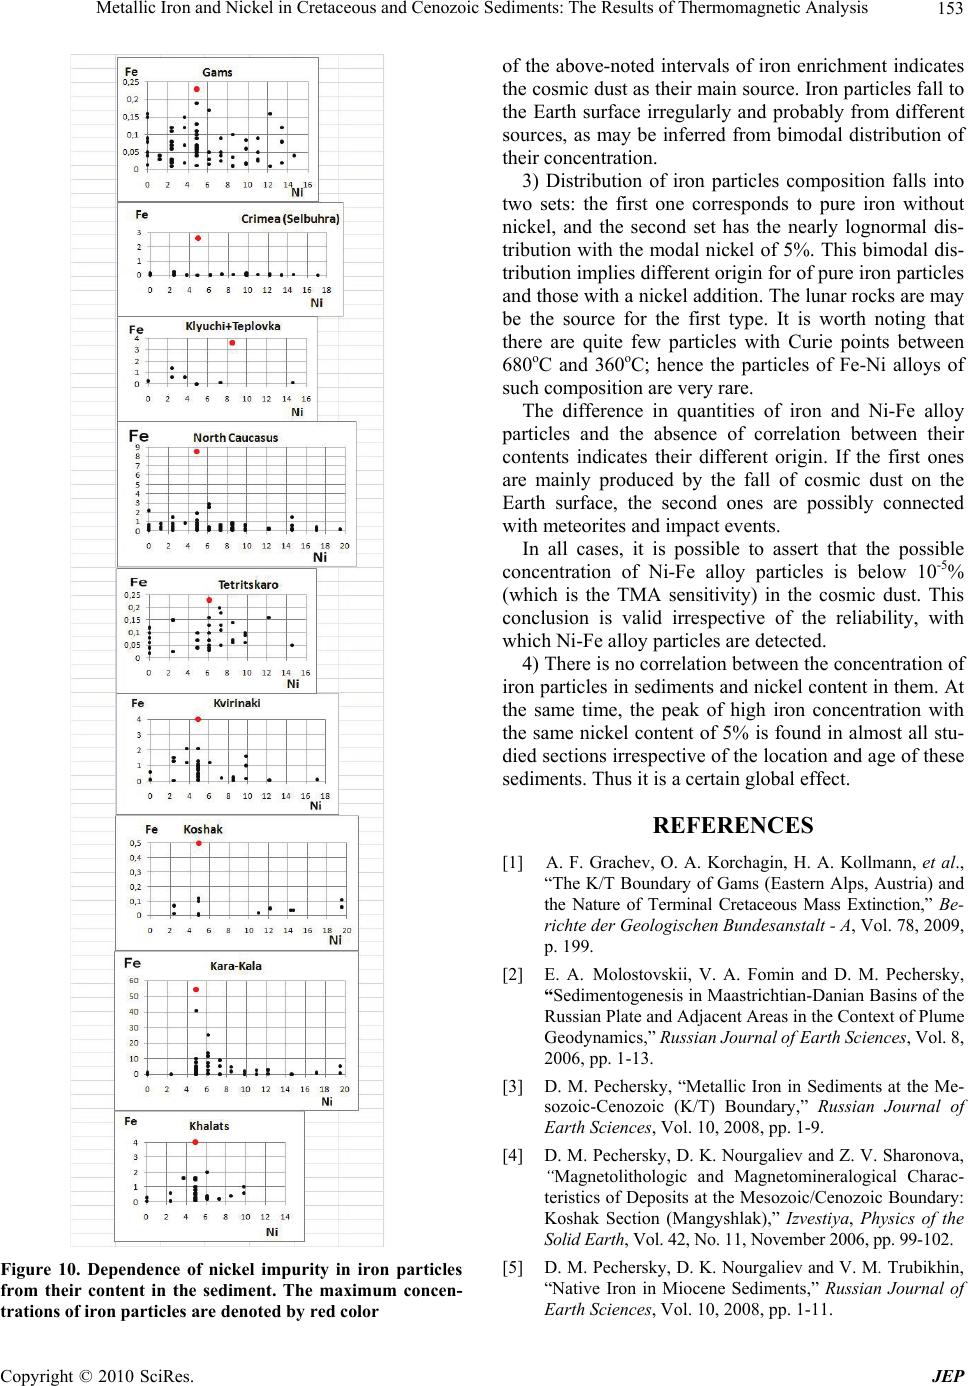 Metallic Iron and Nickel in Cretaceous and Cenozoic Sediments: The Results of Thermomagnetic Analysis 153 Figure 10. Dependence of nickel impurity in iron particles from their content in the sediment. The maximum concen- trations of iron particles are denoted by red color of the above-noted intervals of iron enrichment indicates the cosmic dust as their main source. Iron particles fall to the Earth surface irregularly and probably from different sources, as may be inferred from bimodal distribution of their concentration. 3) Distribution of iron particles composition falls into two sets: the first one corresponds to pure iron without nickel, and the second set has the nearly lognormal dis- tribution with the modal nickel of 5%. This bimodal dis- tribution implies different origin for of pure iron particles and those with a nickel addition. The lunar rocks are may be the source for the first type. It is worth noting that there are quite few particles with Curie points between 680оС and 360оС; hence the particles of Fe-Ni alloys of such composition are very rare. The difference in quantities of iron and Ni-Fe alloy particles and the absence of correlation between their contents indicates their different origin. If the first ones are mainly produced by the fall of cosmic dust on the Earth surface, the second ones are possibly connected with meteorites and impact events. In all cases, it is possible to assert that the possible concentration of Ni-Fe alloy particles is below 10-5% (which is the ТMA sensitivity) in the cosmic dust. This conclusion is valid irrespective of the reliability, with which Ni-Fe alloy particles are detected. 4) There is no correlation between the concentration of iron particles in sediments and nickel content in them. At the same time, the peak of high iron concentration with the same nickel content of 5% is found in almost all stu- died sections irrespective of the location and age of these sediments. Thus it is a certain global effect. REFERENCES [1] A. F. Grachev, O. A. Korchagin, H. A. Kollmann, et al., “The K/T Boundary of Gams (Eastern Alps, Austria) and the Nature of Terminal Cretaceous Mass Extinction,” Be- richte der Geologischen Bundesanstalt - A, Vol. 78, 2009, p. 199. [2] E. A. Molostovskii, V. A. Fomin and D. M. Pechersky, “Sedimentogenesis in Maastrichtian-Danian Basins of the Russian Plate and Adjacent Areas in the Context of Plume Geodynamics,” Russian Journal of Earth Sciences, Vol. 8, 2006, pp. 1-13. [3] D. M. Pechersky, “Metallic Iron in Sediments at the Me- sozoic-Cenozoic (K/T) Boundary,” Russian Journal of Earth Sciences, Vol. 10, 2008, pp. 1-9. [4] D. M. Pechersky, D. K. Nourgaliev and Z. V. Sharonova, “Magnetolithologic and Magnetomineralogical Charac- teristics of Deposits at the Mesozoic/Cenozoic Boundary: Koshak Section (Mangyshlak),” Izvestiya, Physics of the Solid Earth, Vol. 42, No. 11, November 2006, pp. 99-102. [5] D. M. Pechersky, D. K. Nourgaliev and V. M. Trubikhin, “Native Iron in Miocene Sediments,” Russian Journal of Earth Sciences, Vol. 10, 2008, pp. 1-11. Copyright © 2010 SciRes. JEP  154 Metallic Iron and Nickel in Cretaceous and Cenozoic Sediments: The Results of Thermomagnetic Analysis Copyright © 2010 SciRes. JEP [6] D. M. Pechersky, B. Z. Asanidze, D. K. Nourgaliev and Z. V. Sharonova, “Rock-Magnetism and Magnetostratigra- phy of Sediments at the Mesozoic-Cenozoic Boundary: Tetrytskaro Section (Georgia),” Izvestiya, Physics of the Solid Earth, Vol. 45, No. 2, February 2009, pp. 134-145. [7] D. M. Pechersky, D. K. Nourgaliev, V. A. Fomin, Z. V. Sharonova and D. M. Gilmanova, “Cosmic Iron in the Cretaceous-Danian Sediments,” Izvestiya, Physics of the Solid Earth, Vol. 46, No. 12, December 2010. [8] B. V. Burov, D. C. Nourgaliev and P. G. Yasonov, “Pa- leomagnetic Analysis,” in Russian, Kazan State Univer- sity Publishers, Kazan, 1986. [9] R. M. Bozorth, “Ferromagnetism,” David Van Nostrand Company Inc., Toronto, 1951. [10] T. Nagata, M. Funaki and J. Danon, “Magnetic Properties of Tetrataenite-Rich Iron Meteorites,” Memoirs of Na- tional Institute of Polar Research, Special Issue, Vol. 41, 1986, pp. 364-370. [11] N. P. Lyakishev, “Diagrams of the States of Double Me- tallic Systems,” Mashinostroenie, Moscow, Book 1, Vol. 3, 1997. [12] P. Gorria, D. Martinez-Blanco, M. Pérez, et al., “Stress- Induced Large Curie Temperature Enhancement in Fe64Ni36 Invar Alloy,” Physical Review, Vol. B80, 2009, pp. 1-6. [13] T. Nagata and M. Funaki, “Tetrataenite Phase in Antarc- tic Meteorites,” Memoirs of National Institute of Polar Research, Special Issue, Vol. 46, 1987, pp. 245-262. [14] T. Nagata, J. Danon and M. Funaki, “Magnetic Properties of Ni-Rich Iron Meteorites,” Memoirs of National Insti- tute of Polar Research, Special Issue, Vol. 46, 1987, pp. 263-282. [15] D. E. Brownlee, “Morphological, Chemical and Minera- logical Studies of Cosmic Dust,” Philosophical Transac- tions of the Royal Society London, Vol. A323, 1987, pp. 305-323. [16] D. W. Parkin, “Cosmic Dust in Antarctic,” British Ant- arctic Survey Bulletin, Vol. 23, 1964. [17] M. Shima and H. Yabuki, “Study of the Extraterrestrial Material in Antarctica,” National Institute of Polar Re- search, No. 3, March 1988, pp. 53-66. [18] F. M. Gradstein, J. Ogg and M. van Kranendonk, “On the Geological Time Scale (2008),” Newsletters on Strati- graphy, Vol. 43, No. 1, June 2008, pp. 5-13. [19] E. A. Molostovskii, D. M. Pechersky and I. Y. Frolov, “Magnetostratigraphic Time Scale of the Phanerozoic and its Description Using a Cumulative Distribution Func- tion,” Izvestiya, Physics of the Solid Earth, Vol. 43, No. 10, October 2007, pp. 811-818. [20] K. B. Doell, C. S. Gromme, A. N. Thorne and F. E. Sentfle, “Magnetic Studies of Lunar Samples,” Science, Vol. 167, No. 3918, January 1970, pp. 695-697. [21] C. E. Helsley, “Magnetic Properties of Lunar Dust and Rock Samples,” Science, Vol. 167, No. 3918, January 1970, pp. 693-695. [22] C. E. Helsley, “Magnetic Properties of Lunar 10022, 10069, 10084 and 10085 Samples,” Proceedings of Apollo 11 Lunar Science Conference, Houston, Vol. 3, 5-8 January 1970, pp. 2213-2216. [23] A. Larochelle and E. J. Schwarz, “Magnetic Properties of Lunar Sample 10048-22,” Science, Vol. 167, No. 3918, January 1970, pp. 700-703. [24] T. Nagata, Y. Ishikawa, H. Kinoshita, et al., “Magnetic Properties of Lunar Samples,” Science, Vol. 167, No. 3918, January 1970, pp. 703-706. [25] S. K. Runcorn, D. W. Collinson, W. O'Reilly, A. Ste- phenson, et al., “Magnetic Properties of Lunar Samples,” Science, Vol. 167, No. 3918, January 1970, pp. 697-700. [26] S. K. Runcorn, D. W. Collinson, W. O'Reilly, A. Ste- phenson, et al., “Magnetic Properties of Lunar Samples,” Proceedings of Royal Society of London, Vol. A325, 1971, pp. 157-174. [27] D. W. Strangway, E. E. Larson and G. H. Pearce, “Mag- netic Properties of Lunar Samples,” Science, Vol. 167, No. 3918, January 1970, pp. 691-693. [28] A. M. Reid, C. M. Ir, R. S. Harmon and R. Brett, “Metal Grains in Apollo 12 Igneous Rocks,” Earth and Planetary Science Letters, Vol. 9, No. 1, 1970, pp. 1-5. [29] J. I. Goldstein and H. Yakowitz, “Metallic Inclusions and Metal Particles in the Apollo 12 Lunar Soil,” Proceedings of 2nd Lunar Science Conference, Houston, Vol. 1, 11-14 January 1971, pp. 177-191. [30] H. Wanke, F. Wlotzka, E. Jagoutz and F. Beglmann, “Composition and Structure of Metallic Iron Particles in Lunar Fines,” Proceedings of Apollo 11 Lunar Science Conference, Houston, Vol. 1, 5-8 January 1970, pp. 931- 935. [31] F. Wlotzka, B. Spettel and H. Wanke, “On the Composi- tion of Metal from Apollo 16 Fines and Meteoritic Com- ponent,” Proceedings of 4th Lunar Science Conference, Houston, Vol. 2, 5-8 March 1973, pp. 1483-1491.
|