Paper Menu >>
Journal Menu >>
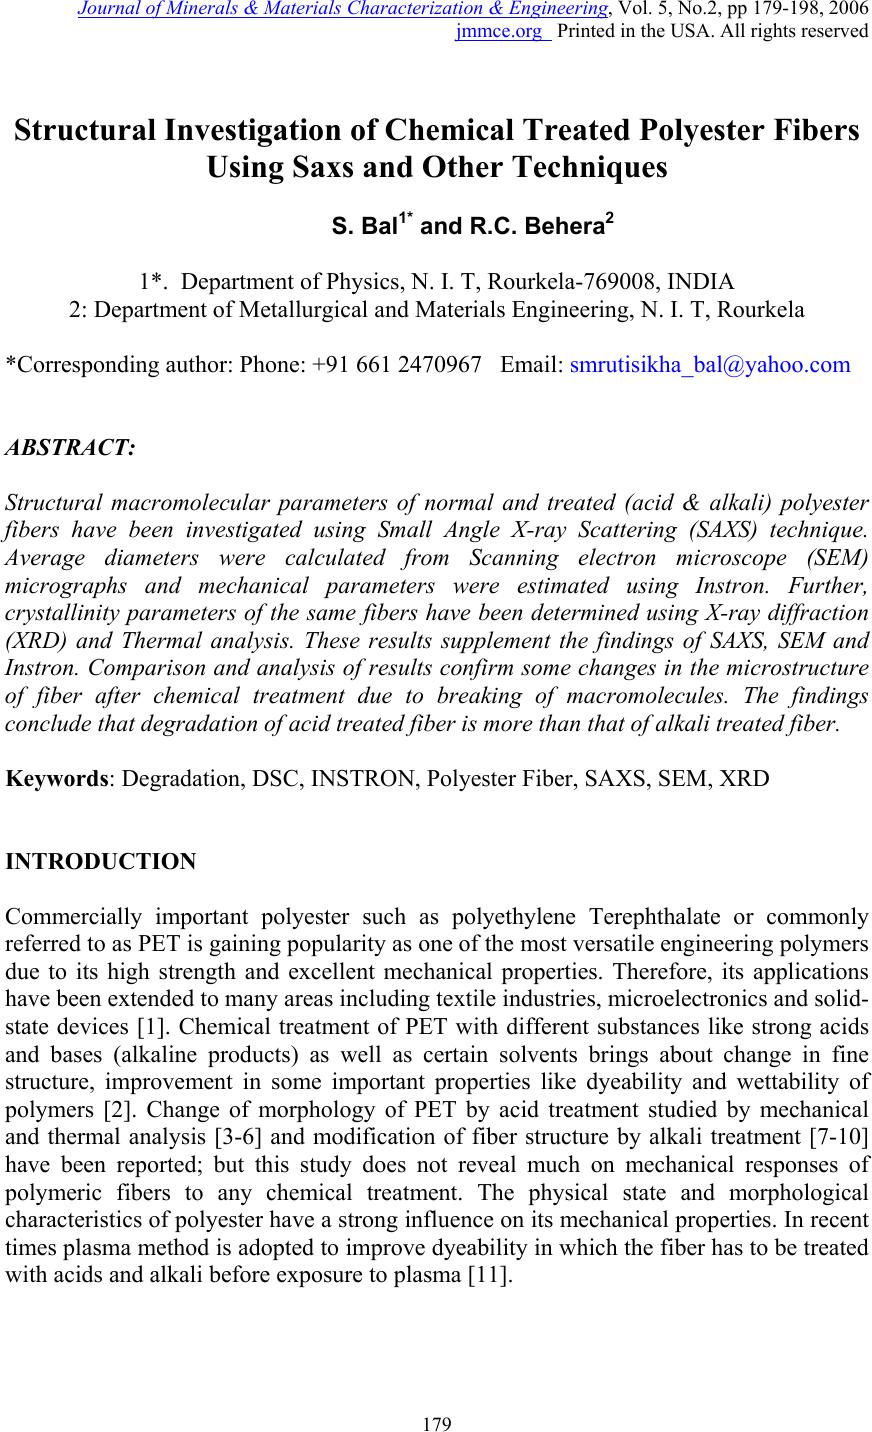 Journal of Minerals & Materials Characterization & Engineering, Vol. 5, No.2, pp 179-198, 2006 jmmce.org Printed in the USA. All rights reserved 179 Structural Investigation of Chemical Treated Polyester Fibers Using Saxs and Other Techniques S. Bal 1* and R.C. Behera 2 1*. Department of Physics, N. I. T, Rourkela-769008, INDIA 2: Department of Metallurgical and Materials Engineering, N. I. T, Rourkela *Corresponding author: Phone: +91 661 2470967 Email: smrutisikha_bal@yahoo.com ABSTRACT: Structural macromolecular parameters of normal and treated (acid & alkali) polyester fibers have been investigated using Small Angle X-ray Scattering (SAXS) technique. Average diameters were calculated from Scanning electron microscope (SEM) micrographs and mechanical parameters were estimated using Instron. Further, crystallinity parameters of the same fibers have been determined using X-ray diffraction (XRD) and Thermal analysis. These results supplement the findings of SAXS, SEM and Instron. Comparison and analysis of results confirm some changes in the microstructure of fiber after chemical treatment due to breaking of macromolecules. The findings conclude that degradation of acid treated fiber is more than that of alkali treated fiber. Keywords: Degradation, DSC, INSTRON, Polyester Fiber, SAXS, SEM, XRD INTRODUCTION Commercially important polyester such as polyethylene Terephthalate or commonly referred to as PET is gaining popularity as one of the most versatile engineering polymers due to its high strength and excellent mechanical properties. Therefore, its applications have been extended to many areas including textile industries, microelectronics and solid- state devices [1]. Chemical treatment of PET with different substances like strong acids and bases (alkaline products) as well as certain solvents brings about change in fine structure, improvement in some important properties like dyeability and wettability of polymers [2]. Change of morphology of PET by acid treatment studied by mechanical and thermal analysis [3-6] and modification of fiber structure by alkali treatment [7-10] have been reported; but this study does not reveal much on mechanical responses of polymeric fibers to any chemical treatment. The physical state and morphological characteristics of polyester have a strong influence on its mechanical properties. In recent times plasma method is adopted to improve dyeability in which the fiber has to be treated with acids and alkali before exposure to plasma [11]. 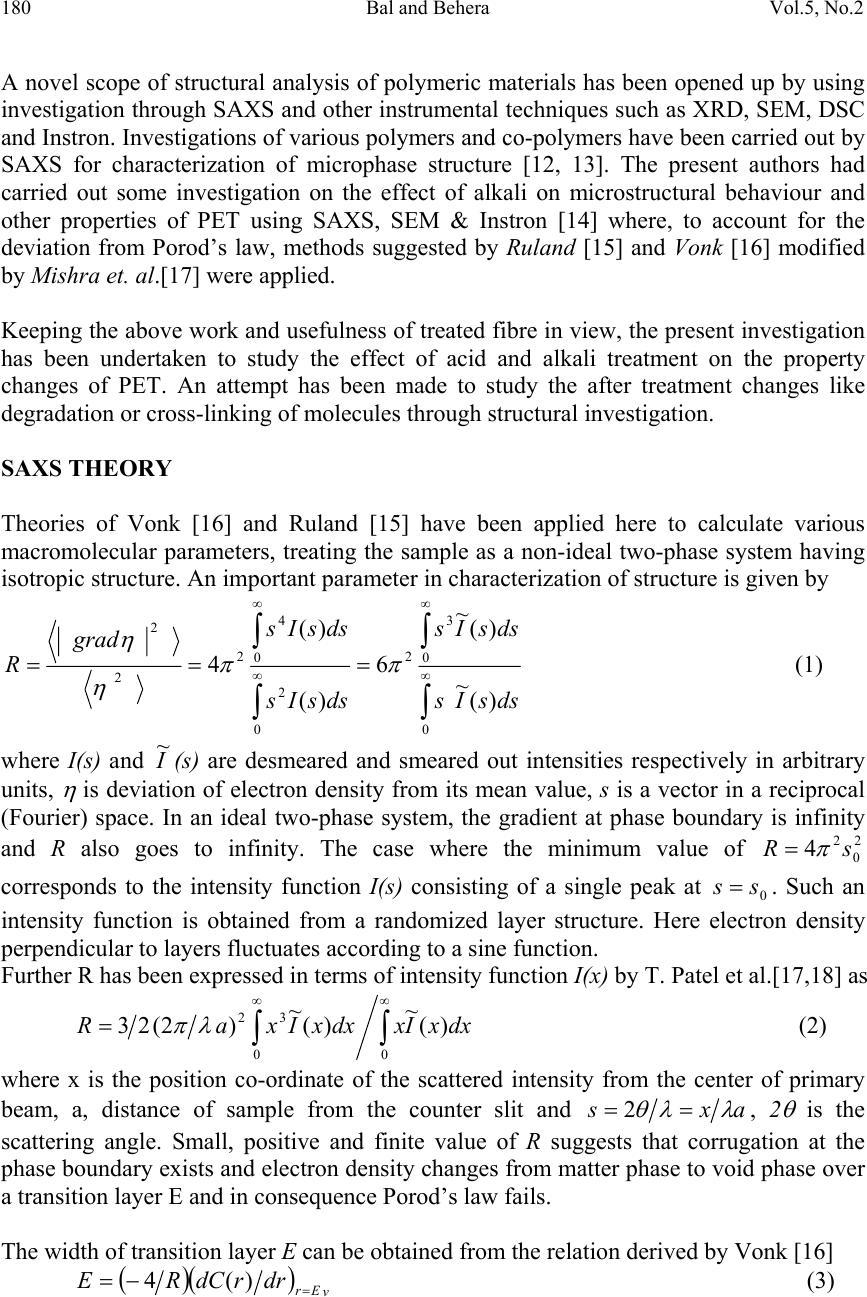 180 Bal and Behera Vol.5, No.2 A novel scope of structural analysis of polymeric materials has been opened up by using investigation through SAXS and other instrumental techniques such as XRD, SEM, DSC and Instron. Investigations of various polymers and co-polymers have been carried out by SAXS for characterization of microphase structure [12, 13]. The present authors had carried out some investigation on the effect of alkali on microstructural behaviour and other properties of PET using SAXS, SEM & Instron [14] where, to account for the deviation from Porod’s law, methods suggested by Ruland [15] and Vonk [16] modified by Mishra et. al.[17] were applied. Keeping the above work and usefulness of treated fibre in view, the present investigation has been undertaken to study the effect of acid and alkali treatment on the property changes of PET. An attempt has been made to study the after treatment changes like degradation or cross-linking of molecules through structural investigation. SAXS THEORY Theories of Vonk [16] and Ruland [15] have been applied here to calculate various macromolecular parameters, treating the sample as a non-ideal two-phase system having isotropic structure. An important parameter in characterization of structure is given by dssIs dssIs dssIs dssIs grad R )( ~ )( ~ 6 )( )( 4 0 0 3 2 0 2 0 4 2 2 2 ∫ ∫ ∫ ∫ ∞ ∞ ∞ ∞ === ππ η η (1) where I(s) and I ~ (s) are desmeared and smeared out intensities respectively in arbitrary units, η is deviation of electron density from its mean value, s is a vector in a reciprocal (Fourier) space. In an ideal two-phase system, the gradient at phase boundary is infinity and R also goes to infinity. The case where the minimum value of 2 0 2 4sR π = corresponds to the intensity function I(s) consisting of a single peak at 0 ss= . Such an intensity function is obtained from a randomized layer structure. Here electron density perpendicular to layers fluctuates according to a sine function. Further R has been expressed in terms of intensity function I(x) by T. Patel et al.[17,18] as ∫∫ ∞∞ = 00 32 )( ~ )( ~ )2(23dxxIxdxxIxaR λπ (2) where x is the position co-ordinate of the scattered intensity from the center of primary beam, a, distance of sample from the counter slit and axs λ λ θ = = 2, 2 θ is the scattering angle. Small, positive and finite value of R suggests that corrugation at the phase boundary exists and electron density changes from matter phase to void phase over a transition layer E and in consequence Porod’s law fails. The width of transition layer E can be obtained from the relation derived by Vonk [16] () ( ) v Er drrdCRE = −=)(4 (3) 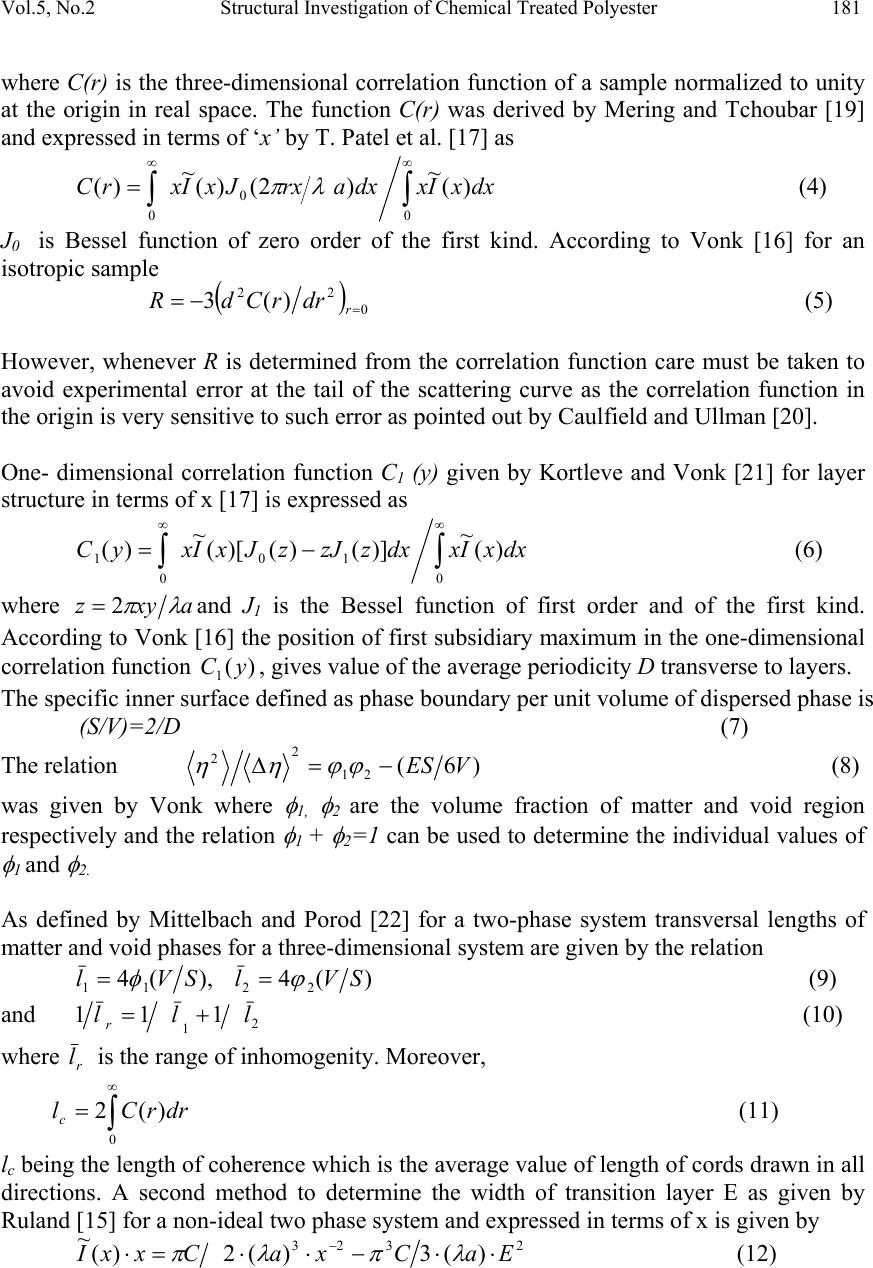 Vol.5, No.2 Structural Investigation of Chemical Treated Polyester 181 where C(r) is the three-dimensional correlation function of a sample normalized to unity at the origin in real space. The function C(r) was derived by Mering and Tchoubar [19] and expressed in terms of ‘ x’ by T. Patel et al. [17] as ∫∫ ∞∞ = 0 0 0 )( ~ )2()( ~ )(dxxIxdxarxJxIxrC λπ (4) J 0 is Bessel function of zero order of the first kind. According to Vonk [16] for an isotropic sample ( ) 0 22 )(3 = −= r drrCdR (5) However, whenever R is determined from the correlation function care must be taken to avoid experimental error at the tail of the scattering curve as the correlation function in the origin is very sensitive to such error as pointed out by Caulfield and Ullman [20]. One- dimensional correlation function C 1 (y) given by Kortleve and Vonk [21] for layer structure in terms of x [17] is expressed as ∫∫ ∞∞ −= 0 10 0 1 )( ~ )]()()[( ~ )(dxxIxdxzzJzJxIxyC (6) where axyz λ π 2=and J 1 is the Bessel function of first order and of the first kind. According to Vonk [16] the position of first subsidiary maximum in the one-dimensional correlation function )( 1 yC, gives value of the average periodicity D transverse to layers. The specific inner surface defined as phase boundary per unit volume of dispersed phase is (S/V)=2/D (7) The relation )6( 21 2 2 VES−=∆ ϕϕηη (8) was given by Vonk where φ 1, φ 2 are the volume fraction of matter and void region respectively and the relation φ 1 + φ 2 =1 can be used to determine the individual values of φ 1 and φ 2. As defined by Mittelbach and Porod [22] for a two-phase system transversal lengths of matter and void phases for a three-dimensional system are given by the relation )(4),(4 2211 SVlSVl ϕφ == (9) and 2 1 111lll r += (10) where r l is the range of inhomogenity. Moreover, ∫ ∞ = 0 )(2drrCl c (11) l c being the length of coherence which is the average value of length of cords drawn in all directions. A second method to determine the width of transition layer E as given by Ruland [15] for a non-ideal two phase system and expressed in terms of x is given by 2323 )(3)(2)( ~ EaCxaCxxI⋅⋅−⋅⋅=⋅ − λπλπ (12)  182 Bal and Behera Vol.5, No.2 From the above equation the plot of I ~ (x). x versus x -2 at the tail end of the SAXS pattern is known as Ruland plot. Equation (12) reduces to Porod’s law if E=0, for an ideal two- phase system. EXPERIMENTAL PART The polyester fiber used for present investigation was obtained from a private firm. The details can be obtained from work done by Bal et.al. [14]. One part of the sample was soaked in sulphuric acid solution at a concentration pH1 and the other part was soaked in sodium hydroxide solution at concentration pH12. The samples were kept in these conditions for 48 hours at ambient temperature and then they were washed with distilled water and dried. The untreated sample was named as Polyester-0, the acid-treated sample as Polyester-I and the alkali-treated sample as Polyester-II. Small angle X-ray scattering A Phillips PW 1729 X-ray generator with a copper target was used for collection of intensity data. SAXS intensity data for all the samples were collected using compact Kratky camera having counter attachment. The following identical experimental conditions were maintained for all the samples considered in this work. (i) Tube voltage = 35kV. (ii) Tube current = 20 mA. (iii) Vacuum pressure = (1/2) mbar. (iv) Slit width = 80 µm. (v) Counter slit width = 250 µm. (vi) λ, wave length of Cu k α radiation = 1.5418 A 0 . (vii) A, the counter- sample distance = 20 cms. (viii) Capillary diameter (d) = 1 mm. The room temperature was maintained at 22.5 ± 0.5 0 C. Monochromatic Cu k α ( λ=1.54 A 0 ) radiation was obtained using a nickel filter of 10 µ m thickness which was used to irradiate polyester fibers packed in Mark capillary tube of 1 mm diameter. Wide-angle x-ray diffraction The as received and treated samples were characterized for its change in crystalline behaviour by wide-angle X-ray diffraction technique. The experiment was carried out using Rich-Seifert (Model ISO-Debyeflex 2000) diffractometer. The XRD pattern was obtained using CuK α radiation that was monochromatised with a curved Graphite crystal monochromator and nickel filter. Samples were scanned at a scanning speed of 3 0 /min in the 2 θ range 7 0 to 40 0 . 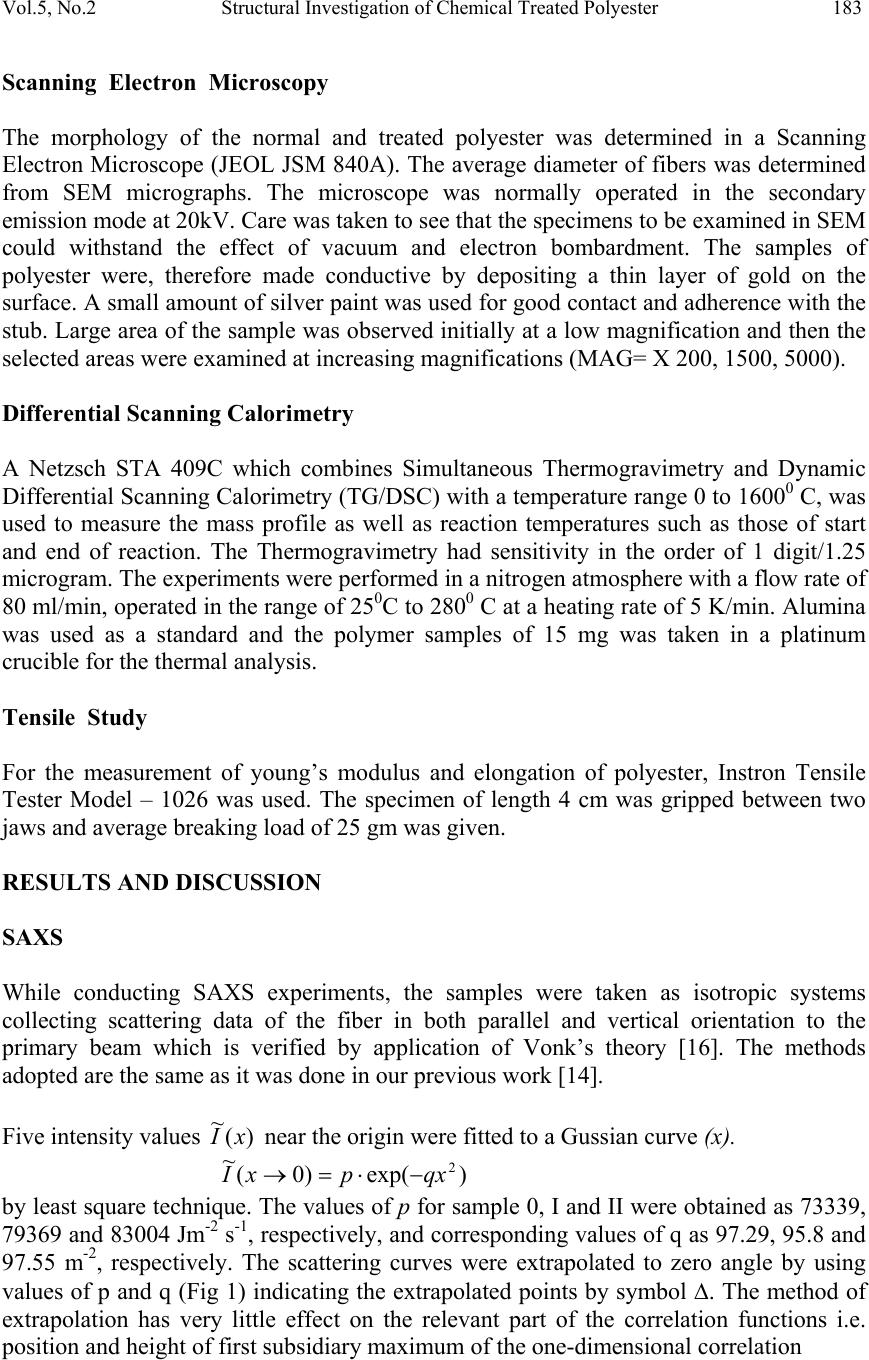 Vol.5, No.2 Structural Investigation of Chemical Treated Polyester 183 Scanning Electron Microscopy The morphology of the normal and treated polyester was determined in a Scanning Electron Microscope (JEOL JSM 840A). The average diameter of fibers was determined from SEM micrographs. The microscope was normally operated in the secondary emission mode at 20kV. Care was taken to see that the specimens to be examined in SEM could withstand the effect of vacuum and electron bombardment. The samples of polyester were, therefore made conductive by depositing a thin layer of gold on the surface. A small amount of silver paint was used for good contact and adherence with the stub. Large area of the sample was observed initially at a low magnification and then the selected areas were examined at increasing magnifications (MAG= X 200, 1500, 5000). Differential Scanning Calorimetry A Netzsch STA 409C which combines Simultaneous Thermogravimetry and Dynamic Differential Scanning Calorimetry (TG/DSC) with a temperature range 0 to 1600 0 C, was used to measure the mass profile as well as reaction temperatures such as those of start and end of reaction. The Thermogravimetry had sensitivity in the order of 1 digit/1.25 microgram. The experiments were performed in a nitrogen atmosphere with a flow rate of 80 ml/min, operated in the range of 25 0 C to 280 0 C at a heating rate of 5 K/min. Alumina was used as a standard and the polymer samples of 15 mg was taken in a platinum crucible for the thermal analysis. Tensile Study For the measurement of young’s modulus and elongation of polyester, Instron Tensile Tester Model – 1026 was used. The specimen of length 4 cm was gripped between two jaws and average breaking load of 25 gm was given. RESULTS AND DISCUSSION SAXS While conducting SAXS experiments, the samples were taken as isotropic systems collecting scattering data of the fiber in both parallel and vertical orientation to the primary beam which is verified by application of Vonk’s theory [16]. The methods adopted are the same as it was done in our previous work [14]. Five intensity values )( ~ xI near the origin were fitted to a Gussian curve (x). )exp()0( ~ 2 qxpxI−⋅=→ by least square technique. The values of p for sample 0, I and II were obtained as 73339, 79369 and 83004 Jm -2 s -1 , respectively, and corresponding values of q as 97.29, 95.8 and 97.55 m -2 , respectively. The scattering curves were extrapolated to zero angle by using values of p and q (Fig 1) indicating the extrapolated points by symbol ∆. The method of extrapolation has very little effect on the relevant part of the correlation functions i.e. position and height of first subsidiary maximum of the one-dimensional correlation  184 Bal and Behera Vol.5, No.2 function is not affected much [17]. Values of R were determined using equation (2) and were found to be (23.12 ± 0.28) 10 -4 2 0 − A, (26.58 ± 0.31) 10 -4 2 0 − A and (26.36 ± 0.31) 10 -4 2 0 − A for sample-0, sample-I and sample-II respectively. Small and positive values of R parameter for all samples prove that electron density gradient at phase boundary is 0 10000 20000 30000 40000 50000 60000 70000 80000 00.10.2 0 1000 2000 3000 4000 5000 6000 0.20.30.40.50.60.7 Io (x) in counts/sec A x (cm) Io (x) in counts/sec 0 10000 20000 30000 40000 50000 60000 70000 80000 90000 00.10.2 0 1000 2000 3000 4000 5000 6000 7000 0.20.30.40.50.60.70.8 C x (cm) B Fig. 1 Smeared out scattering curve of sample-0, I and II are shown in (A), (B) and (C) respectively. Extrapolated points are shown by ∆ sign. 0 20000 40000 60000 80000 00.10.2 0 2000 4000 6000 0.20.30.40.50.60.7 x in cm Io (x) in counts/sec 5 ~ I  Vol.5, No.2 Structural Investigation of Chemical Treated Polyester 185 finite thus suggesting belongingness of sample to a non-ideal two-phase system. Values of R obtained by relation (5) using five-point forward difference method were found out to be (23.12 ± 0.03) 10 -4 2 0 − A, (26.25 ± 0.03) 10 -4 2 0 − A and (26.12 ± 0.08) 10 -4 2 0 − A for sample-0, sample-I and sample-II, respectively. These figures are almost equal to the values of R of the corresponding samples that were already obtained using equation (2), which indicates isotropic nature of the sample. For various values of r and y, the three- and one-dimensional correlation function for the samples were computed respectively and are shown in Fig. 2 and Fig. 3 with error bars. According to Vonk the width of transition layer (E) was obtained from the plot of ⎥ ⎦ ⎤ ⎢ ⎣ ⎡ ⋅ ⎟ ⎠ ⎞ ⎜ ⎝ ⎛ − dr rdC R )(4 versus r in Fig. 4. The value of average periodicity transverse to the layers (D) were obtained from the position of first subsidiary maximum in one-dimensional correlation function (Fig. 3). The value of the specific inner surface (S/V), the volume fractions of matter and void (φ 1 and φ 2) , the transversal lengths in matter and void ( 1 l& 2 l), range of inhomogenity (l r ), the length of coherence (lc) were estimated. All main SAXS parameters are tabulated in Table 1. Ruland Plot )( ~ xI x versus x -2 of the two samples are shown in Fig. 5 which give straight lines at the limiting region of the scattering curve where slopes are (98±0.04), (104.04±0.28) , (138.72±0.1) and y intercepts are (-248.99 ± 1), (-231.30 ± 1.3), (-322.16 ±0.5) of samples 0, I and II respectively. Using these slopes and intercepts, the width of transition layer (E R ) by Ruland method were found out which is quite close to E v (Table 1). Standard deviation of the intensities σ(I) 1/2 was calculated at tail region of SAXS curve of samples and values are well within the permissible limits (0.5) (Table 1) [23]. The regression coefficient γ for sample-0 = 0.91, sample-I = 0.95 and for sample-II = 0.9 confirms the accuracy of collected data [24]. Lamellar models for the three samples are shown in Fig. 6, which are based on findings of SAXS parameters (Table 1). In case of polyester-I and polyester-II, it was observed that there is slight increase in the value of specific inner surface (S/V) and decrease in the value of average periodicity, D as compared to corresponding parameters of polyester-0. The volume fraction of the matter phase, φ 1 decreases and as a result of which volume fraction of void phase, φ 2 increases when treated with sulphuric acid of pH–1 and sodium hydroxide of pH-12. Moreover, there is considerable decrease in the values of the transversal length in matter (l 1 ), the range of inhomogeneity (l r ) and the length of coherence (l c ) of polyester-I and polyester- II. The values for the transversal length of void phase (l 2 ) of these samples are increased in comparison to polyester-0. Acids act on the fiber through hydrolysis of some of the ester linkages in the chain thus producing shorter chains. It is reported by other workers that generally concentrated sulphuric acid dissolves synthetic fiber by breaking down the molecular structure of the polymer. Alkali penetrates between chains which breaks the secondary valences and hence change the average length of the chains. In other words  186 Bal and Behera Vol.5, No.2 this action of strong acid and alkali breaks up the functional groups of the macromolecules, and hence the polyester degrades. Our present results obtained from SAXS are also in close agreement to the earlier findings reported in [25,26]. Table 1. Parameters of the Untreated and Treated Polymers determined from SAXS. PARAMETERS polyester-0 polyester-I polyester-II D(A 0 ) 319 296 301 E v (A 0 ) 21.2 ± 0.017 19.2± 0.017 19.2 ± 0.017 E R (A 0 ) 19.13 ± 0.04 17.91± 0.05 18.3 ± 0.016 S/V (A 0-1 ) 0.0063 0.0067 0.0066 φ 1 0.846± 0.004 0.825± 0.004 0.83 ±0.004 φ 2 0.154 ± 0.004 0.175± 0.004 0.17 ± 0.004 2E V /D (%) 13.29 ± 0.01 12.97± 0.01 12.76 ± 0.01 l 1 (A 0 ) 540 ± 2.55 488.40± 2.37 499.66 ± 2.41 l 2 (A 0 ) 97.99 ± 2.55 103.60± 2.37 102.34 ± 2.41 l r (A 0 ) 82.94 ± 0.011 81.69± 0.011 81.63 ± 0.011 l c (A 0 ) 127.71 ± 0.22 123.86± 0.21 125.49 ± 0.21 f c 0.76 0.77 0.81 σ 0.16 0.23 0.19 γ 0.91 0.95 0.9  Vol.5, No.2 Structural Investigation of Chemical Treated Polyester 187 0.0 0.1 0.2 0.3 0.4 0.5 0.6 0.7 0.8 0.9 1.0 0100200 C(r) -0.006 -0.004 -0.002 0.0 00 0.0 02 0.0 04 0.0 06 0.0 08 0.0 10 0.0 12 0.0 14 0.0 16 200250300350400450500550 r(A o ) A -0.004 0 0.004 0.008 0.012 200250300350400450500 0 0.2 0.4 0.6 0.8 1 0100200 C (r) r ( 0 A ) B -0.006 -0.004 -0.002 0.000 0.002 0.004 0.006 0.008 0.010 0.012 0.014 0.016 200250300350400450500 r(A o ) 0.0 0.1 0.2 0.3 0.4 0.5 0.6 0.7 0.8 0.9 1.0 0100200 C(r) C Fig. 2 Three Dimensional Correlation Function ‘ C( r)’ against ‘r’ with error bars of sample-0, I and II  188 Bal and Behera Vol.5, No.2 C 1 (y) -0.4 -0.2 0 0.2 0.4 0.6 0.8 1 0100200300400 y ( 0 A) A -0.4 0 0.4 0.8 0100200300400 C 1 (y) y ( 0 A ) B -0.4 0 0.4 0.8 0200400600 y ( 0 A) C 1 (y) Fig. 3 Curves of one dimensional Correlation Function ‘C 1 (y)’ against ‘y’ with error bars of of sample-0, I and II C  Vol.5, No.2 Structural Investigation of Chemical Treated Polyester 189 0 10 20 30 0102030 r ( 0 A ) -(4/R 1 ) (dC(r)/dr E V = 21.2 0 A A 0 10 20 30 0 102030 -(4/R 1 ) (dC(r)/dr r ( 0 A ) E V = 19.2 0 A B . 0 10 20 30 0102030 r ( 0 A ) -(4/R 1 ) (dC(r)/dr E V = 19.2 0 A C Fig. 4 Curves of ‘-4R (dC(r)/dr)’ against ‘r’ of sample-0, I and II  190 Bal and Behera Vol.5, No.2 x - 2 (cm - -300 -250 -200 -150 -100 -50 0 50 100 150 0123 4 I (x ) E R = x - 2 (cm - E R = 19.13 0 A -250 -200 -150 -100 -50 0 50 100 01234 I (x) -350 -250 -150 -50 50 150 0123 x - 2 (cm - E R = 18 3 0 A I (x) Fig. 5 Ruland Plot of I(x)x against x 2 of sample-0, I  Vol.5, No.2 Structural Investigation of Chemical Treated Polyester 191 Fig 6. Lamellar models of polyester-0 (Fig. a), polyester-I (Fig. b) & polyester-II(Fig. c) drawn from SAXS results d 1 MM E d 2 D V MM d 2 E d 1 D V MM D E d 1 d 2 (c) (a) (b)  192 Bal and Behera Vol.5, No.2 XRD Fig. 7 shows the X-ray scattering Diffractogram of untreated and treated samples while the estimated parameters are presented in Table 2. The crystallite size has been calculated from its relationship with peak width at half maximum and the crystallinity content has been individually calculated from amorphous content. First, the amorphous content of the samples (A in %) has been determined from respective diffractograms by evaluating the integrated scattering Intensities [27]. Then the crystalline content (percentage crystallinity) has been determined as (100-A). The estimation of the crystalline content in the polymer samples involves a comparison of the relative intensity of the crystalline and amorphous region of the polymers, with the implicit assumption that the scattering powers of the two regions are equivalent and considering equal masses of scattering materials. The slight differences in the peak positions, intensity and diffuse scattering maxima can be associated with the structural differences of the samples used in the present study. The d-spacing of the crystalline part of the polymer was calculated using the Bragg equation: nλ = 2d sinθ. (13) Where n=order of reflection (n=1), d=Bragg spacing and θ = Bragg’s angle, λ= Wave length of radiation (1.542A 0 ). The width ‘∆w’ at half the maximum of crystalline peak was measured and the crystallite size was calculated using the relation [28]; θ λ cos 9.0 ⋅∆ = w t (14) Where t=crystallite size, ∆w= peak width at half maxima in radians. The result shows that the crystallite size of the treated PET is smaller in comparison to the untreated PET. This is also evident from the increase in the half width of peaks (∆w) in polyester-I & polyester-II in comparison to polyester-0 (Table 2). Further, the percentage crystallinity (C) and ‘d’ spacing decrease for the treated samples; this may be due to considerable destruction of crystallites or that the smaller crystallites have been partially dissolved [29]. DSC The DSC/TG curves of as received as well as treated PET samples are shown in the Fig 8. Each of the three curves shows an identical pattern from room temperature to 300 0 C. The curve has a broad endothermic peak at around 80 0 C followed by a small exothermic peak at 130 0 C. This is further followed by a large endothermic peak at about 258 0 C. The first endothermic peak at 80 0 C may be assigned the glass transition temp (T g ) of the polymer. The second peak, which is exothermic in nature, can be assigned to the cold crystallization temp (T c ) of the polymer. The last peak is again endothermic in nature and indicates melting temp (T m ) of the polymer.  Vol.5, No.2 Structural Investigation of Chemical Treated Polyester 193 Fig 7. X-ray Diffractograms of untreated and treated PET fiber Table 2. Parameters of the Untreated and Treated Polymers determined from XRD. Sample Peak No 2 θ (degrees ) 2 12 φ φ − =∆w (degrees) Bragg Spacing 2sinθ nλ d= ( 0 A ) Crystallite Size θ λ cos 9.0 w t ∆ = ( 0 A ) Percentage Crystallinity (C in %) 1 17.4 1.45 5.09 55.48 2 23.5 2.75 3.79 29.53 Polyester-0 3 26.1 2.15 3.41 37.96 25 1 17.7 1.75 5.01 45.98 2 23.5 2.95 3.79 27.53 Polyester-I 3 25.5 2.45 3.49 33.27 19.85 1 18.0 1.80 4.93 44.73 2 23.3 2.90 3.82 27.99 Polyester-II 3 25.6 2.45 3.48 33.28 20.23  194 Bal and Behera Vol.5, No.2 The data as estimated from TG/DSC graphs (Fig.8) are presented in Table 3. The heats of melting, ∆Hm, and those of cold crystallization, ∆Hc, are determined by integrating the areas (J/g) under the peaks from the respective thermograms of the samples. Depending upon the sample’s given thermal history, a cold crystallization exothermic peak may or may not be observed during the DSC experiment. The percent crystallinity is then determined using the following equation: % Crystallinity = [∆Hm –∆ Hc] /∆Hm o ●100% (15) In this equation, the heats of melting and cold crystallization are in terms of J/g. The terms ∆Hm 0 is a reference value and represents the heat of melting if the polymer were 100% crystalline. The reference heat of melting has been established for PET polymers to be ∆Hm 0 = 140.1 (J/g) [30]. Crystallinity percentages calculated from DSC thermograms are 28.85% for polyester-0, 21.29% for polyester-I and 23% for polyester-II. Although the corresponding results are little more than that obtained from XRD (Table 2), the trend is same. Here also there is a decrease in crystallinity of treated samples compared to untreated one. Further the effect is observed to be more in acid treated sample than alkali treated one. SEM The average diameters of polyester-0, polyester-I & polyester-II obtained from SEM study are 2150×10 2 A 0 , 1900×10 2 A 0 and 2000×10 2 A 0 , respectively. The SEM micrographs of samples at different magnifications are shown in Fig. 9. Each SEM photograph contains a dark and bright region clearly indicating the two-phase nature of the sample. Moreover the photographs at 5000 magnification clearly show that there is no preferred orientation of the matter in any direction confirming isotropic nature of the sample. The values of the diameters of samples obtained from SEM study show that there is slight reduction in the diameter of the fiber when treated with strong acid & alkali. Instron Tensile test in Instron shows the percentage elongation of polyester-0, polyester-I and polyester-II to be 20%, 33.7% & 28% and Young’s moduli to be 3.9x10 9 N/m 2 , 2.3x10 9 N/m 2 & 2.8x10 9 N/m 2 , respectively. Decrease in Young’s modulus of treated fibers indicate reduction in stiffness that is evident from decrease in crystallinity obtained from XRD and DSC. This may be due to the fact that small solvent molecules usually can diffuse through the crystalline domains, hence barrier properties and solvent resistance decrease. These results are also well matched with our previous findings obtained from SAXS that the decrease in width of matter phase or the increase in width of void phase is due to degradation of macromolecules [14,32,33].  Vol.5, No.2 Structural Investigation of Chemical Treated Polyester 195 (8a) (8b) (8c) Fig 8: TG/DSC thermograms of untreated (Fig. 8a), Acid Treated (Fig. 8b) and Alkali treated (Fig 8c) PET fiber  196 Bal and Behera Vol.5, No.2 Fig 9. SEM micrographs of polyester-0 (Fig.a, Fig.b & Fig.c), polyester-I (Fig.d, Fig.e & Fig.f) & polyester-II (Fig.g, Fig.h & Fig.i). Table 3. Parameters of the Untreated and Treated Polymers as obtained from DSC. Sample specification Heat of Crystallization (J/g) Peak temp. of crystallization ( 0 C) Heat of Fusion (J/g) Peaktemp of Fusion ( 0 C) Crystallinity (%) Polyester-0 (untreated) 0.614 131.2 41.04 258.4 28.85 Polyester-I (Acid treated) 1.110 129.8 30.95 257.7 21.29 Polyester-II (Alkali Treated) 0.194 132.1 32.48 257.5 23.00  Vol.5, No.2 Structural Investigation of Chemical Treated Polyester 197 CONCLUSIONS The values of width of transition layer E v and E R obtained by the methods of Vonk (E v ) and Ruland (E R ) are nearly equal showing the correctness of collected data and method of analysis. The fiber when treated with strong acid and alkali undergoes degradation thereby decreasing the width of matter phase. The treatment may break the interactive bonds and hence alters the average chain length of the samples after treatment. The degradative effect breaks longer chains into shorter chains that increase free volume thus resulting in a more open structure. In other words the action of chemicals breaks up the functional groups of the macromolecules, and hence there is a structural degradation. The findings obtained from SAXS are consistent with the results obtained through SEM, XRD and Instron studies. These conclusions confirm that polyester fiber is affected to some extent when treated with acid and alkali of higher concentration (pH). In essence the fiber degrades more in strong acid compared to strong alkali that is evident from above comparison of parameters. REFERENCES: [1] Bhat, N. V. and Naik, S. G., 1984, Textile Res. J., vol. 54, pp. 868. [2] Hsieh, Y. L., Miller, A. and Thompson, J., 1996, Textile Res. J., vol. 66, no.1, pp. 1. [3] Simal., Abigail Lisbao., de Araujo. and Marcia Silva., 1996, J. Appl. Polym. Sci., vol. 60, no. 13, Jun 27, pp. 2453. [4] Chidambaram, D., Venkatraj, R. and Manisankar, P., 2003, J. Appl. Polym. Sci., vol. 87, no. 9, 28 Feb, pp. 1500. 5] Fan, Q., Hoskote, S. and Hou, Y., 2001, Proceedings of SPIE - The International Society for Optical Engineering, vol. 4193, pp. 309. [6] Adams, G. C., 1975, Polymer Preprints, Division of Polymer Chemistry, American Chemical Society, Aug, vol.16, no. 2, pp. 401. [7] Datye, Keshav, V., Palan and Bharat, H., 1990, J. Appl. Polym. Sc., vol. 39. no. 4, Feb 20, pp. 893. [8] Collins, M. J., Zeronian, S. H. and Semmelmeyer, M., 1990, J. Appl. Polym. Sci., vol. 42, no. 8 , pp. 2149. [9] Okamoto, M., Suzuki, N. and Aoki, K., 2002, Bull. Yamagata Univ..Eng.,Vol.27, no.1, Feb2002, Department of Polymer Science and Engineering, 10] Shukla, S. R. and Mathur, M. R. , 2000, J. Appl. Polym. Sci., vol. 75, no.9, pp. 1097. [11] Arun, N., 1999, Man made textiles in INDIA, June, pp. 263. [12] Kawahara, Y., Shioya, M. and Kikutani, T., 2002, J.Macromolecular Sci. - Physics, part B, vol. 41, no. 2, pp. 397. [13] Krumova, M, Fakirov, S and Balta Calleja, F.J, 1998, Journal of Materials Science, vol. 33, pp. 2857-2868. [14] Patel, T. and Bal, S., 2001, Polym. J., Japan, vol. 33, no. 2, pp. 121. [15] Ruland, W., 1971, J. Appl. Crystallogr., vol. 4, pp. 70.  198 Bal and Behera Vol.5, No.2 [16] Vonk, C.G., 1973, J. Appl. Crystallogr., vol. 6, pp. 81. [17] Mishra, T., Patra, K.C. and Patel, T., 1984, Colloid. Polym. Sci., vol. 262 , pp. 611. [18] Mishra T., Bisoi D. K., Patel T., Patra K. C. & Patel A., 1988, Polym. J., vol. 20, pp. 739. [19] Mering J. and Tchoubar D., 1968, J. Appl. Crystallogr., vol. 1, pp. 153. [20] Caulfield D. and Ullman R., 1962, J. Appl. Phys., vol. 33, pp. 1737. [21] Kortleve G. and Vonk C. G., 1968, Kolloid Z. Z. Polym., vol. 225, pp. 124. [22] Mittelbach P. and Porod G., 1965, Kolloid Z. Z. Polym., vol. 202, pp. 40. [23] Vonk, C.G., 1971, J. Appl. Crystallogr., vol. 4, pp. 340. [24] Topping, J., 1972, ‘Errors of Observation and their treatment’, 4 th Edition, pp. 82 and 104, Chapman and Hall, London. [25] Kuleznev, V.N. and Shersnev, V.A., 1990 , ‘The chemistry and physics of polymers’ pp.271, Mir Puplisher, Moscow. [26] Arora, M.G. and Singh, M., 1994, ‘Polymer Chemistry’, pp. 377, New Delhi. [27] Clark, G.L., 1963, ‘Encyclopedia of X-rays and Gamma rays’, pp. 785, New York. [28] Scherrer, P., 1918, Gottinger Nachorichten, vol. 2, pp. 98. [29] Naik, S.G.and Bhat, N.V., 1986, Polymer, 27 Feb, pp. 233. [30] Mehta, Aspy et.al, 1978 , J. Polym. Sci. Polym. Phys. Ed., vol. 16, pp. 289. [31] Niu, S.and Wakida, T., 1993, Textile Res. J., vol.63, no. 6, pp. 346. [32] Patel, T.and Bal, S., 2000, Bulletin of Orissa Physical Society, vol. VIII, pp. 74. [33] Patel, T., Bal, S. and Mallick, B., 1999, IUCR International conference on SAXS . |