Developed New Procedure for Low Concentrations of Hydrazine Determination by Spectrophotometry:
Hydrazine-Potassium Permanganate System
101
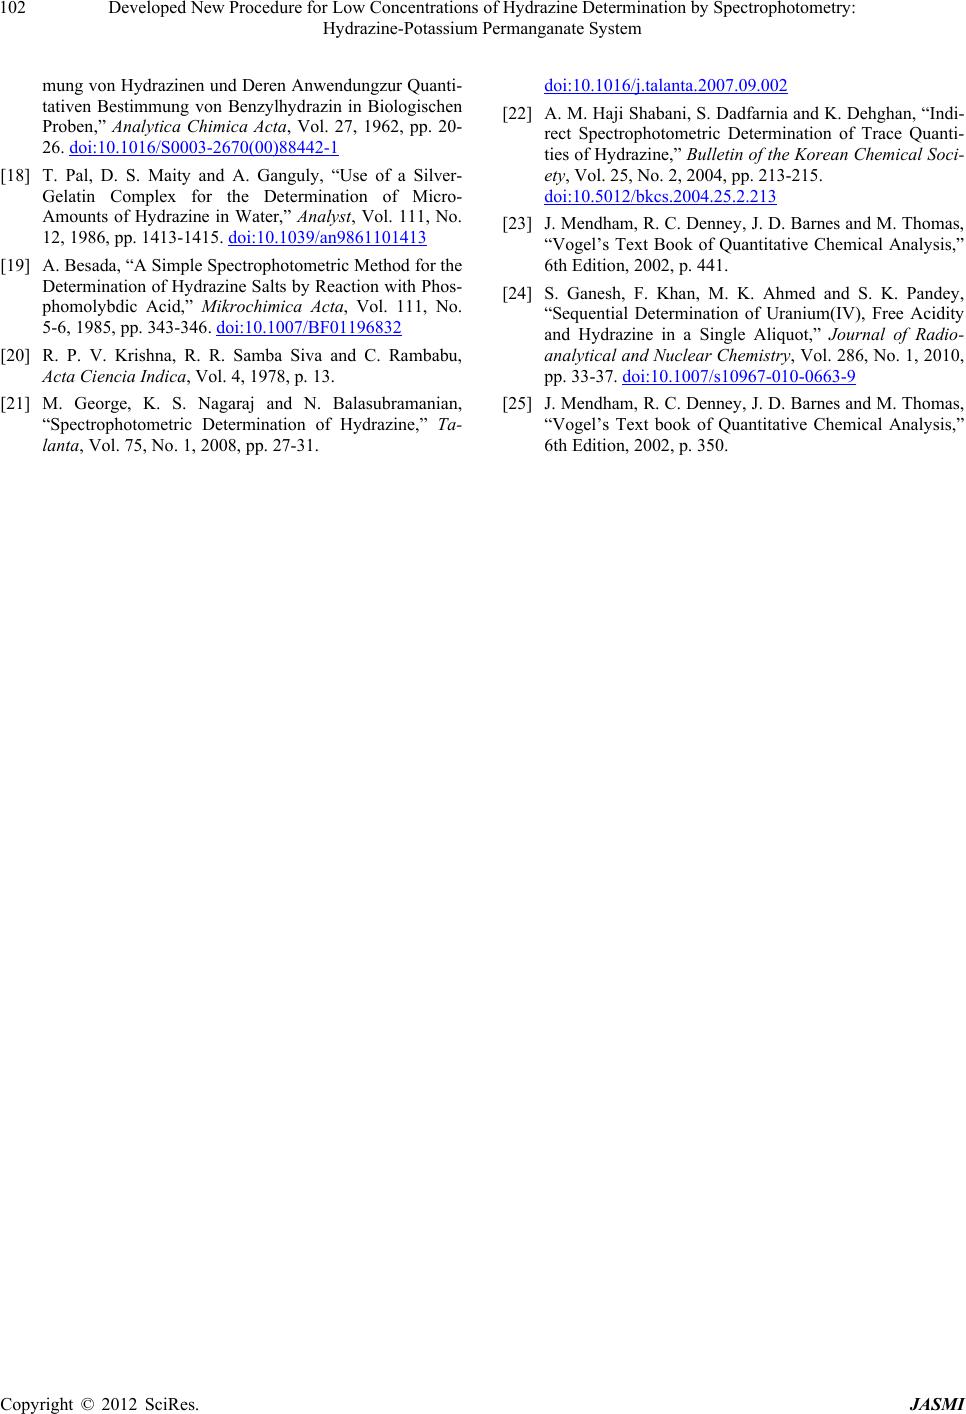
Table 1. Comparsion of two different analytical technique.
Concentration of hydrazine (µg/ml)
S.No.
Spectrophotometry Ion-chromatographic
Technique
1 6.24 6.303
2 10.80 10.01
3 25.30 24.80
4 12.28 12.10
Table 2. Typical results of hydrazine in water samples (Water
samples were collected from various located in Chhatisgarh
state, India).
S.No Absorbance Conc. of Hydrazine (μg/ml)
S1 0.814 534.054
S2 0.660 828.375
S3 0.528 1035.469
S4 0.878 406.524
S5 1.542 67.714
S6 0.971 107.534
S7 0.918 113.743
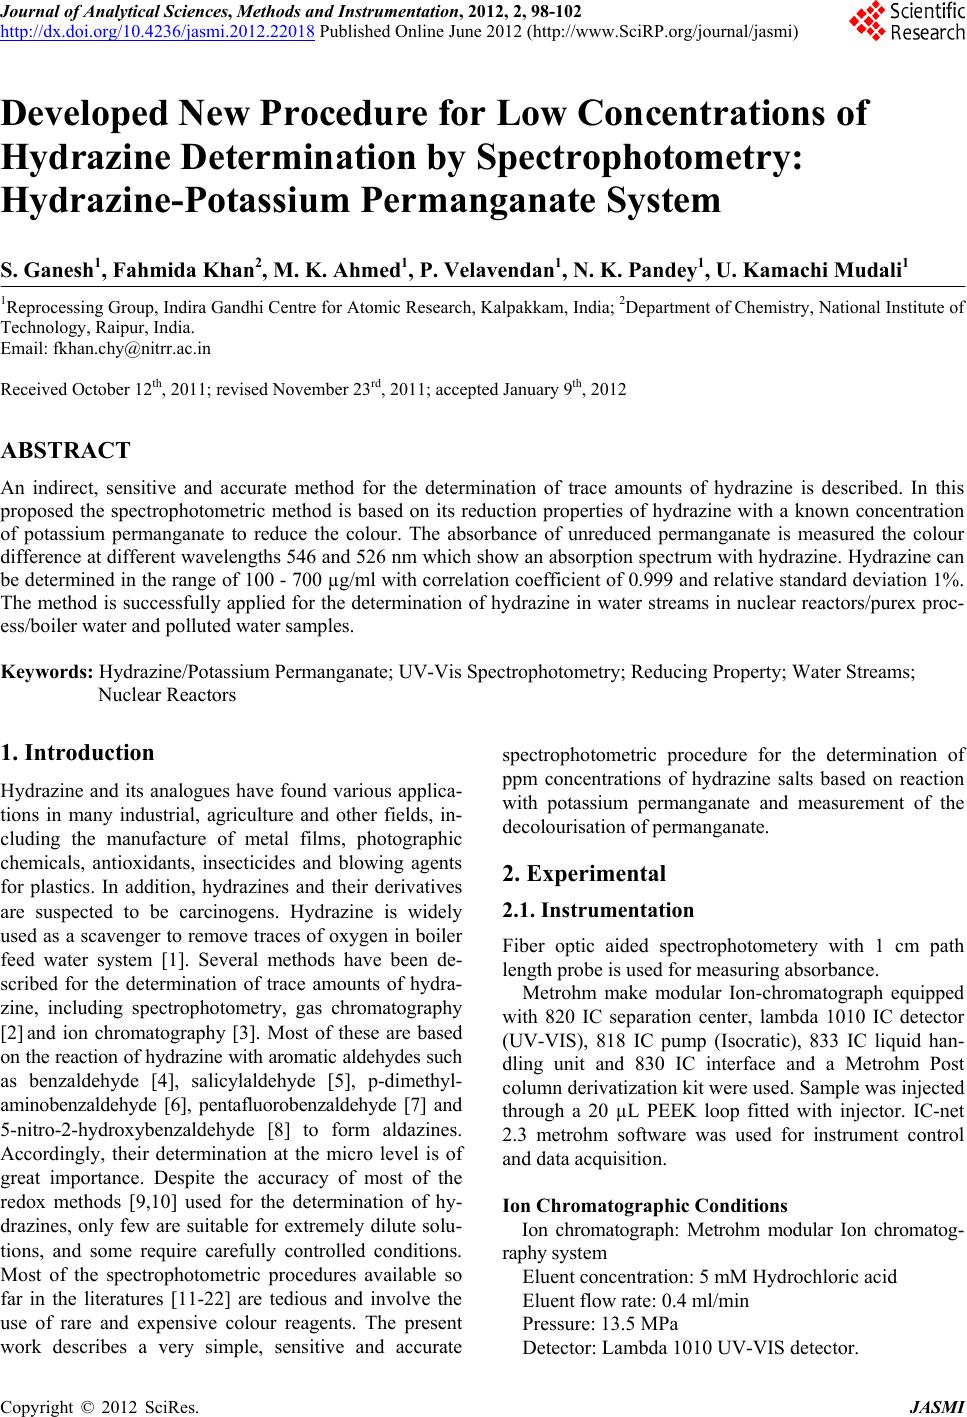
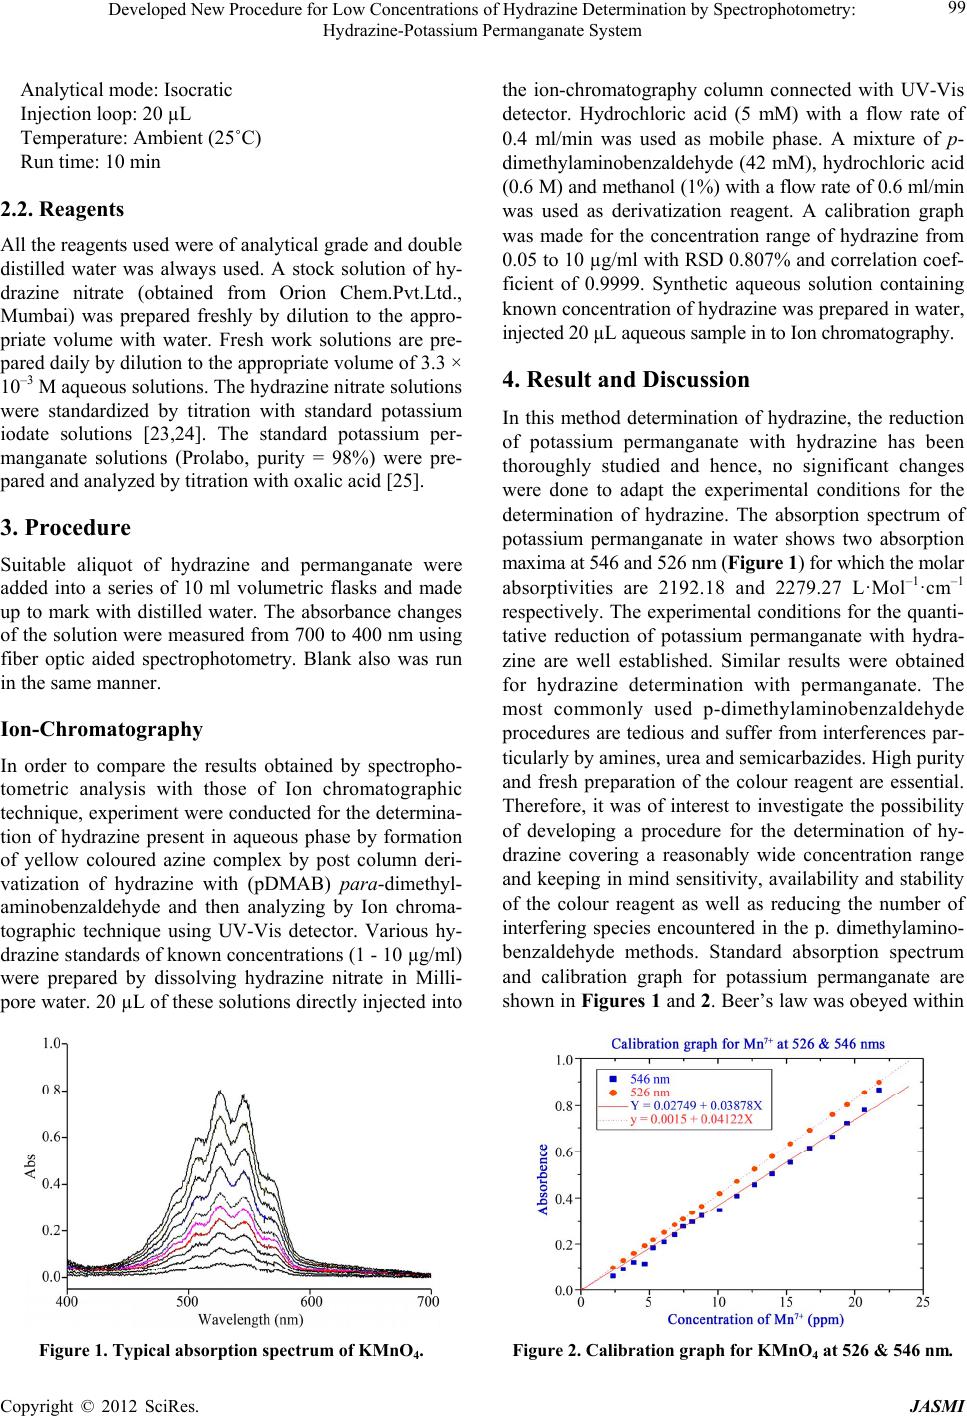
5. Conclusion
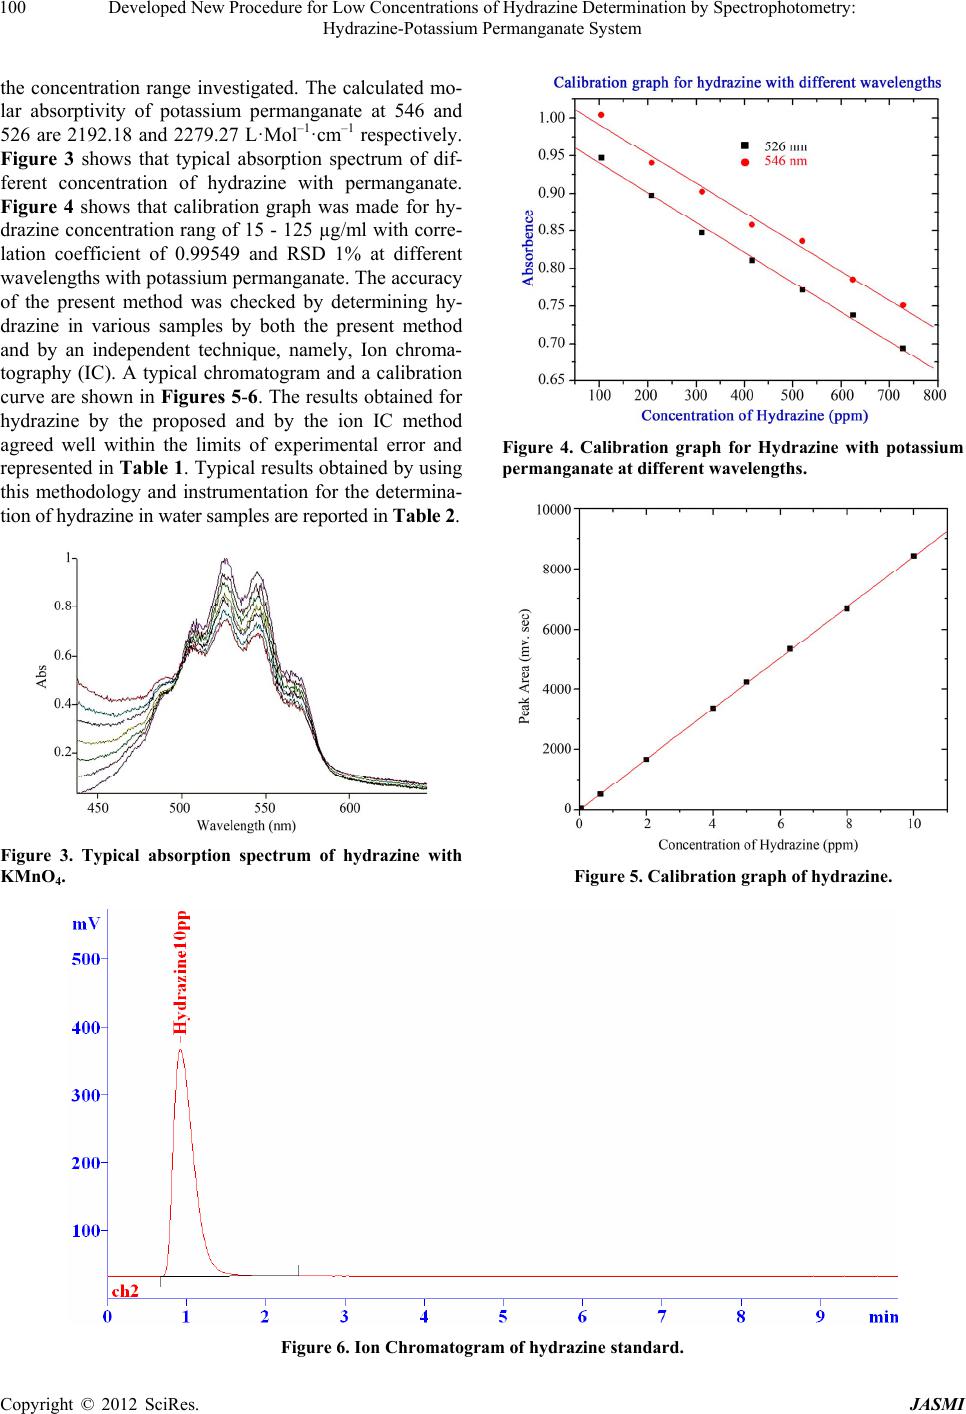
A simple, rapid and sensitive spectrophotometric proce-
dure is described for ppm determination of hydrazine
salts. It is based on reduction of potassium permanganate
and measurement of the absorbance at 546 and 526 nm.
When compared with other procedures, this method was
proved to be of comparable sensitivity and has less inter-
ference.
6. Acknowledgements
Authors are highly indebted to Shri. S.C.Chetal, Director,
IGCAR, Kalpakkam. Authors are grateful to Shri. R.
Natarajan, Director, RpG for his valuable suggestions
and encouragement during the course of this work.
REFERENCES
[1] L. F. Audrieth and B. A. Ogg, “The Chemistry of Hy-
drazines,” John Wiley & Sons, Inc., New York, 1951, p.
225.
[2] V. Vatsala, V. Bansal, D. K. Tuili, M. M. Rai, M. M. Jain,
S. P. Srivastava and A. K. Bhatnagar, “Gaschroma-
tographic Determination of Residual Hydrazine and
Morpholine in Boiler Feed Water and Steam Conden-
sates,” Chromatographia, Vol. 38, No. 7-8, 1994, p. 456.
doi:10.1007/BF02269836
[3] S. L. Larson and A. B. Strong, Technical Report, IRRP-
96-3, 1996.
[4] F. Matsui, D. L. Robertson and E. G. Lovering, “De-
termination of Hydrazine in Pharmaceuticals III: Hydra-
lazine and Isoniazid Using GLC,” Journal of Pharmaceu-
tical Sciences, Vol. 72, No. 8, 1983, pp. 948-951.
doi:10.1002/jps.2600720829
[5] P. E. Kester and N. D. Danielson, “Determination of Hy-
drazine and 1,1-Dimethylhydrazine as Salicyldehyde
Derivates by Liquid Chromatography with Electrochemi-
cal Detection,” Chromatographia, Vol. 18, No. 3, 1984,
pp. 125-128. doi:10.1007/BF02258767
[6] G. W. Watt and J. D. Chrisp, “Spectrophotometric
Method for Determination of Hydrazine,” Analytical Che-
mistry, Vol. 24, No. 12, 1952, pp. 2006-2008.
doi:10.1021/ac60072a044
[7] Y. Y. Liu, J. Schemeltz and D. Hoffman, “Chemical
Studies on Tobacco Smoke. Quantitative Analysis of Hy-
drazine in Tobacco and Cigarette Smoke,” Analytical
Chemistry, Vol. 46, No. 7, 1974, pp. 885-889.
doi:10.1021/ac60343a046
[8] G. Neurath and W. J. Luttich, “Gas Chromatographic
Separation of 5-Nitro-2-hydroxybenzal Derivatives of
Unsymmetric Hydrazines,” Journal of Chormatography
A, Vol. 34, 1968, pp. 257-258.
doi:10.1016/0021-9673(68)80047-0
[9] S. Ganesh, F. Khan, M. K. Ahmed and S. K. Pandey,
“Sequential Determination of Free Acidity and Hydrazine
in Presence of Hydrolysable Ions,” Radiochimica Acta,
Vol. 99, No. 9, 2011, pp. 587-591.
doi:10.1524/ract.2011.1836
[10] S. Ganesh, F. Khan, M. K. Ahmed and S. K. Pandey,
“Potentiometric Determination of Free Acidity in Pres-
ence of Hydrolysable Ions and Sequential Determination
of Hydrazine,” Talanta, Vo. 85, No. 2, 2011, pp. 958-963.
doi:10.1016/j.talanta.2011.05.001
[11] C. Gojon and B. Dureault, “Spectrophotometric Study of
the Reaction between Hydrazine and p-Dimethylamino-
benzaldehyde,” Journal of Nuclear Science and Technol-
ogy, Vol. 33, No. 9, 1966, pp. 731-735.
doi:10.3327/jnst.33.731
[12] R. Kaveeshwar and V. K. Gupta, “A New Spectropho-
tometric Method for the Determination of Hydrazine in
Environmental Samples,” Fresenius’ Journal of Analyti-
cal Chemistry, Vol. 344, No. 3, 1992, pp. 114-117.
doi:10.1007/BF00325125
[13] S. Amlathe and V. K. Gupta, “Spectrophotometric De-
termination of Trace Amounts of Hydrazine in Polluted
Water,” Analyst, Vol. 13, No. 9, 1988, pp. 1481-1483.
doi:10.1039/an9881301481
[14] J. Manes, P. Campillos, G. Front, H. Martre and P.
Prognon, “Extraction-Spectrophotometric Determination
of Hydrazine with 2-Hydroxy-1-naphthaldehyde,” Ana-
lyst, Vol. 112, No. 8, 1987, pp. 1183-1184.
doi:10.1039/an9871201183
[15] A. Besada, ”Analytical Use of Copper(II)-Neocuproine in
the Spectrophotometric Determination of Hydrazines,”
Analytical Letters, Vol. 21, 10, 1988, pp. 1917-1925.
doi:10.1080/00032718808066357
[16] O. S. Sire and J. Burno, Talanta, Vol. 47, 1979, p. 26.
[17] M. Roth and J. Rieder, “Spektrofluorometrische Bestim-
Copyright © 2012 SciRes. JASMI