D. CHAUHAN ET AL.
Copyright © 2012 SciRes. IJMNTA
45
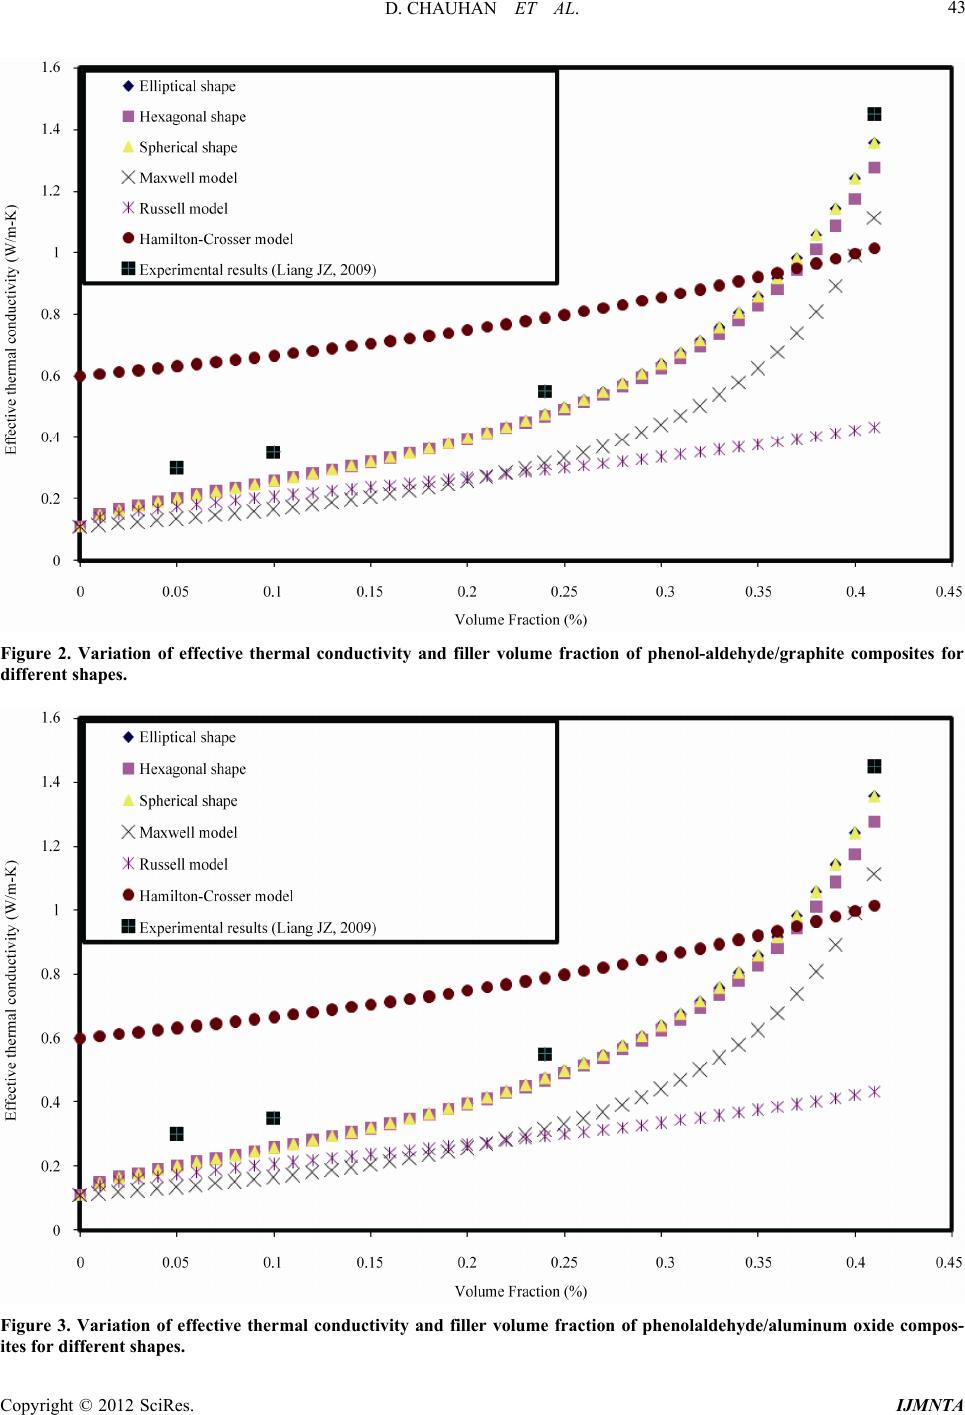
Table 1. Thermal conductivity of various samples used in our computations.
Polymer Matrix Thermal Conductivity (W/m-K) Filler Thermal Conductivity (W/m-K)
Phenol Aldehyde 0.111 Graphite 120
Phenol Aldehyde 0.111 Aluminium Oxide 204
Polypropylene 0.25 Aluminium 237
Polypropylene 0.25 Copper 387
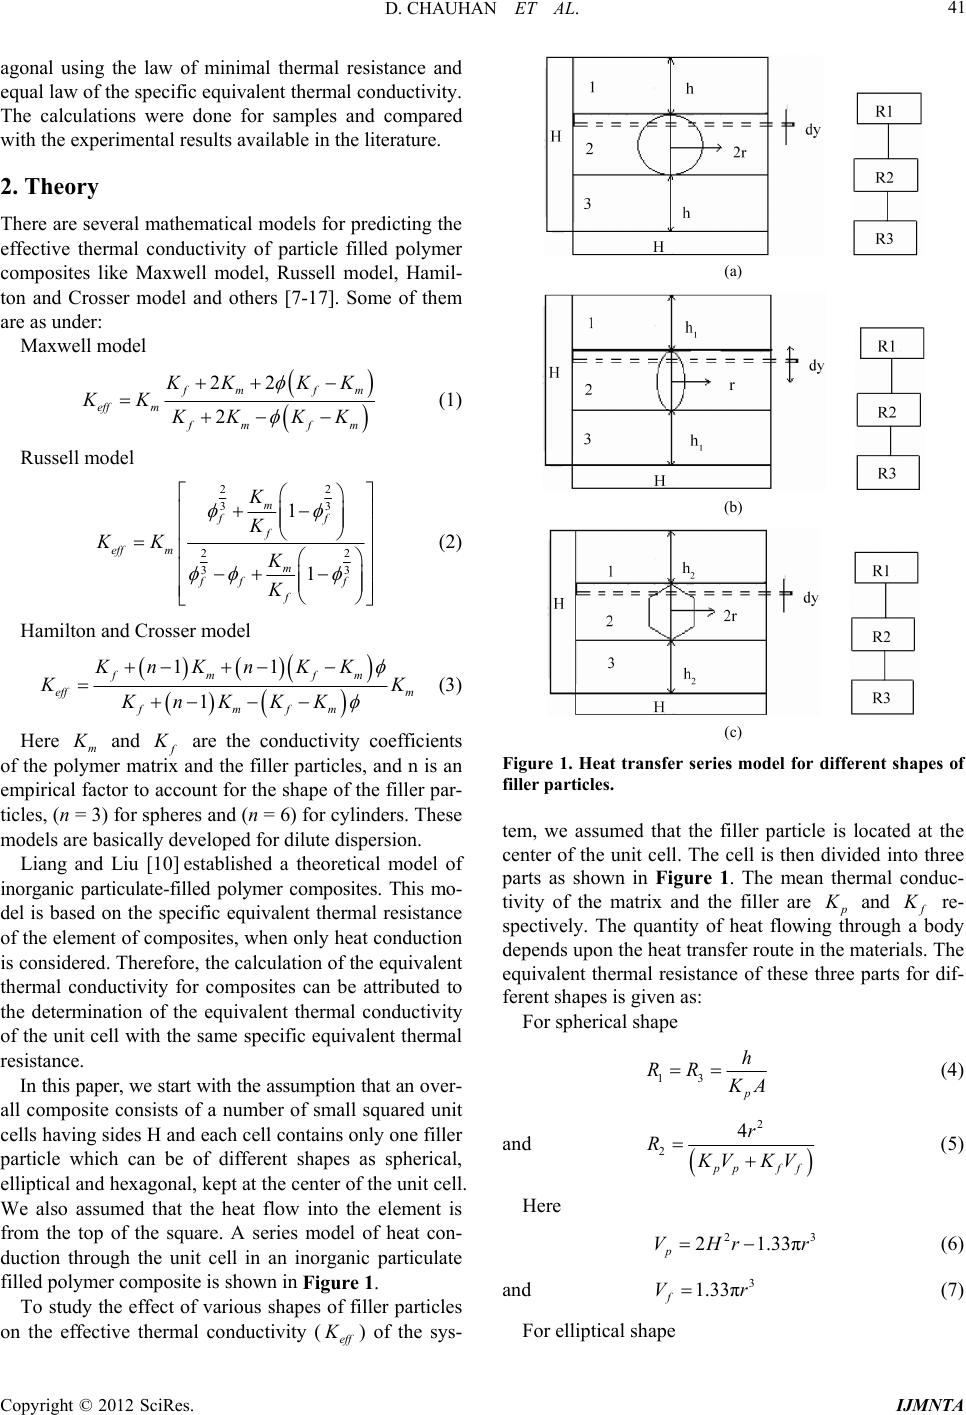
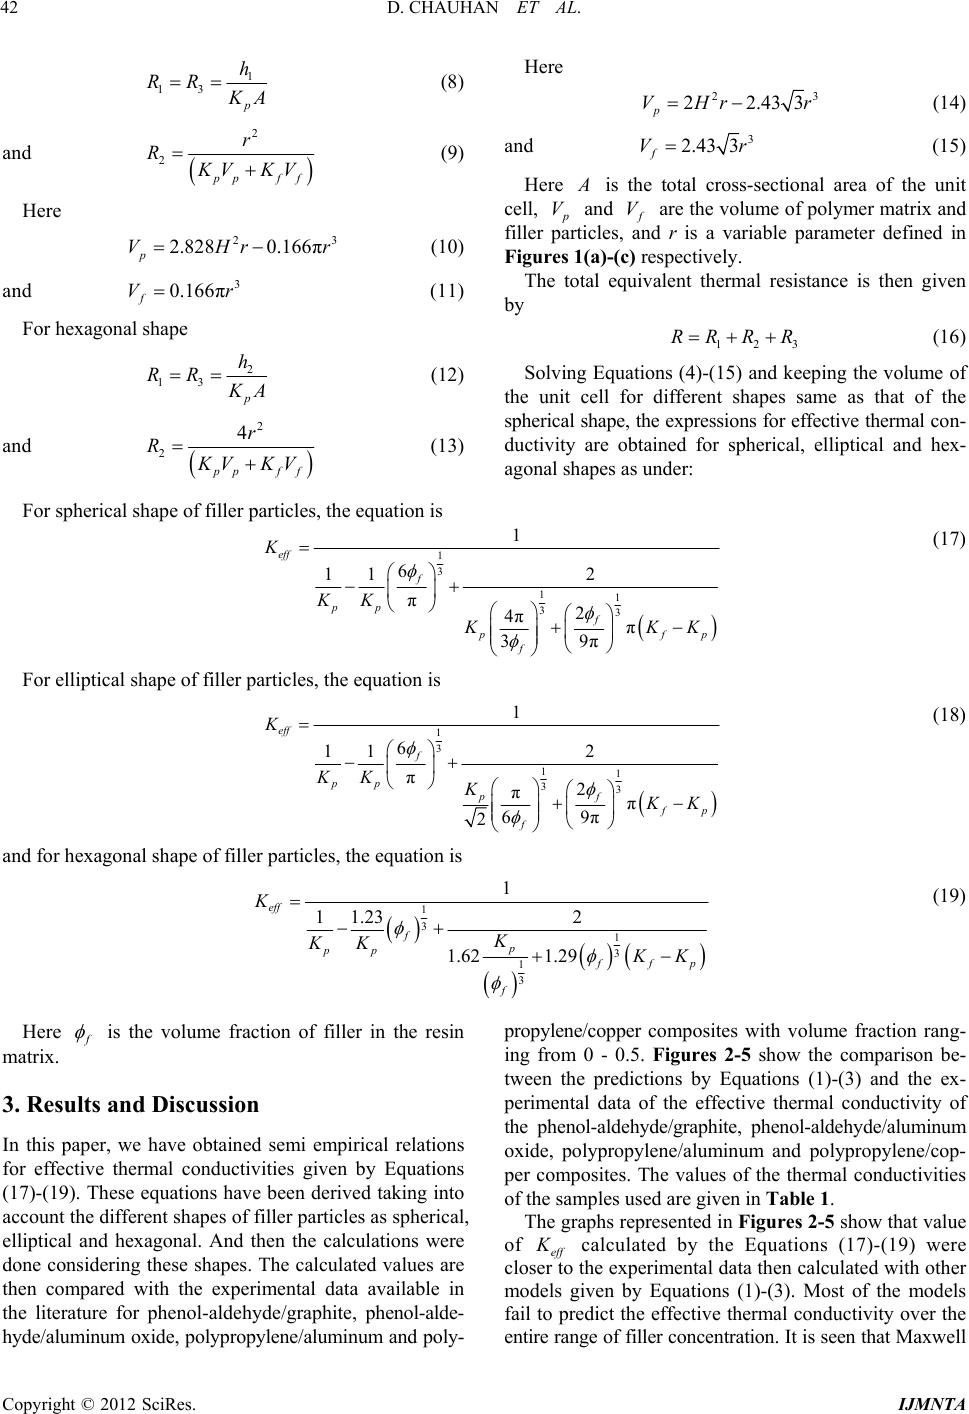
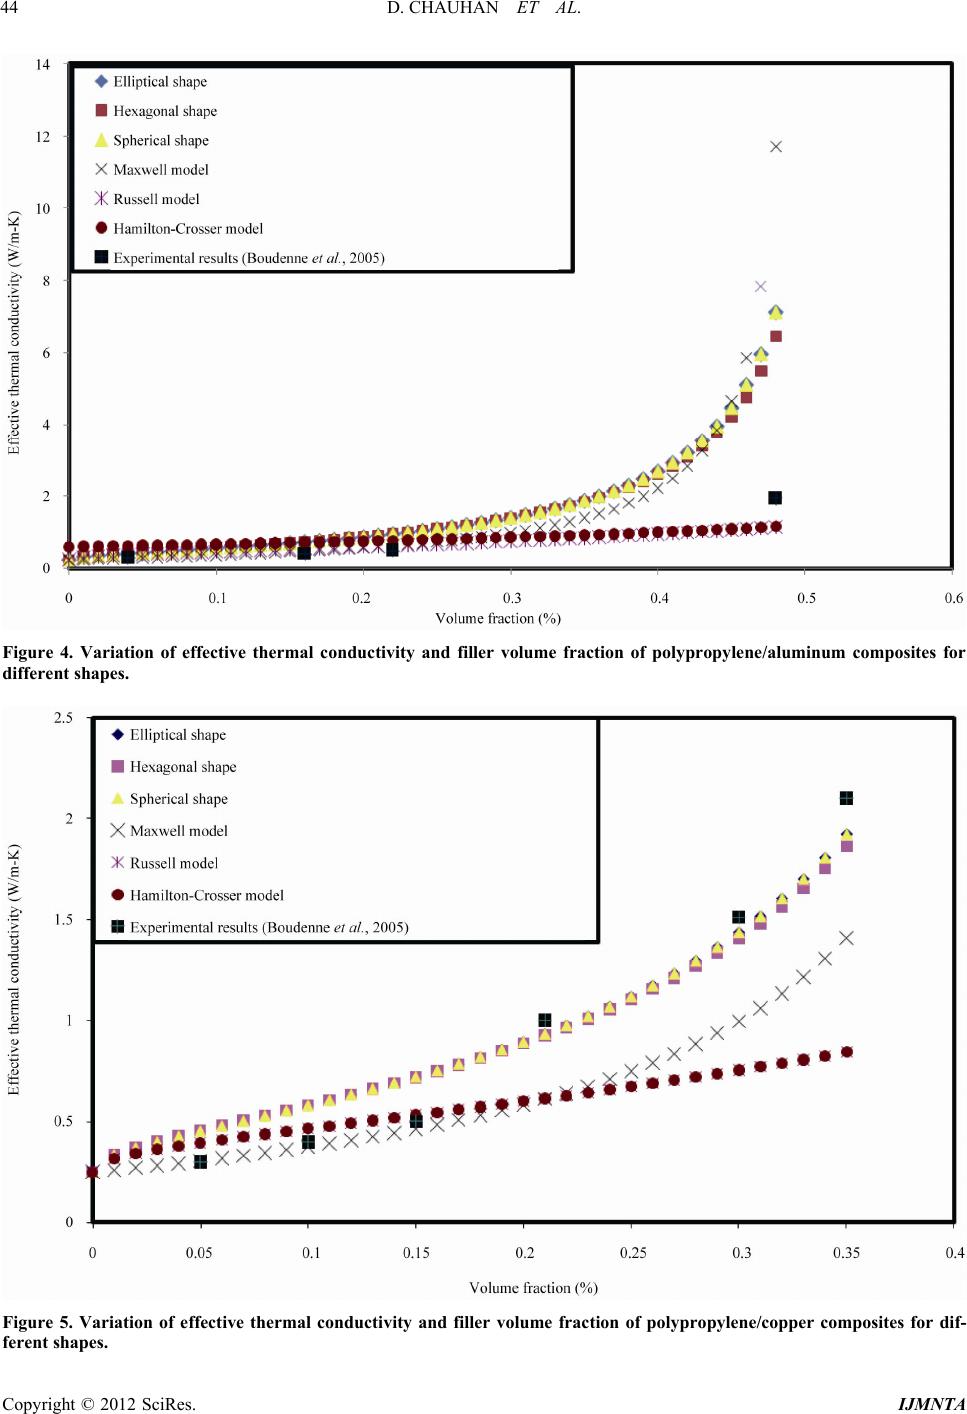
and Russell equations under estimate the experimental
data over the entire range of filler concentrations, while
the Hamilton and Crosser model (with n = 3, spherical
shape of fillers) over estimates the effective thermal con-
ductivity of the materials for phenol-aldehyde/graphite
and phenol aldehyde/aluminum oxide composites. It can
also be seen that, the calculations done by our model for
different shapes are closer to the experimental data then
done by any other theoretical model predicted earlier
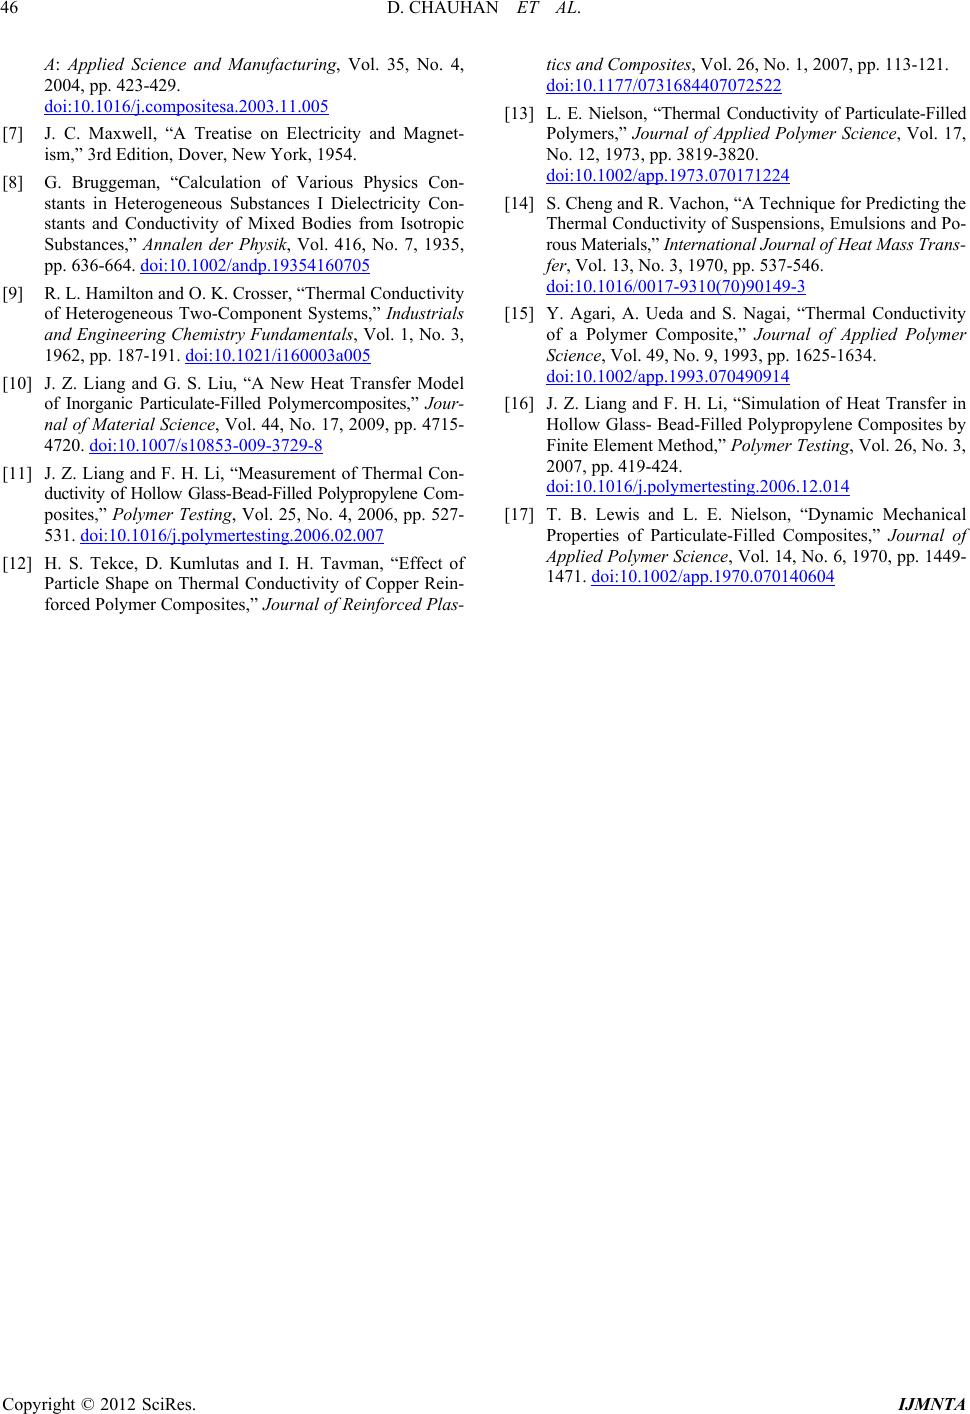
Equations (1)-(3). It is seen from the Figures 2-5 that
with the increase in the filler concentration, the effective
thermal conductivity of the composite increases. The
effective thermal conductivity values of the samples used
for our computations are mentioned in Table 1. Table 1
show that the thermal conductivity of the fillers is sig-
nificantly higher than that of the matrix. There is a sig-
nificant change in the eff
of the composite systems as
we change the shape of the filler particles. It is seen from
the figures that the eff
increases nonlinearly with an
increase in the volume fraction of filler particles.
Sphericity is a measure of the roundness of the particle,
denoted by
. The value of
is one for spherical
particles and less than one for other shapes of the parti-
cles. The change in the geometrical configuration of the
particles changes the value of sphericity. An increase in
the value of
means that there is decrease in the an-
gularity, which brings the particles closer and there is an
increase in the eff
of the system. This change in the
sphericity can be seen in the form of small deviations
among the theoretical curves drawn for different shapes
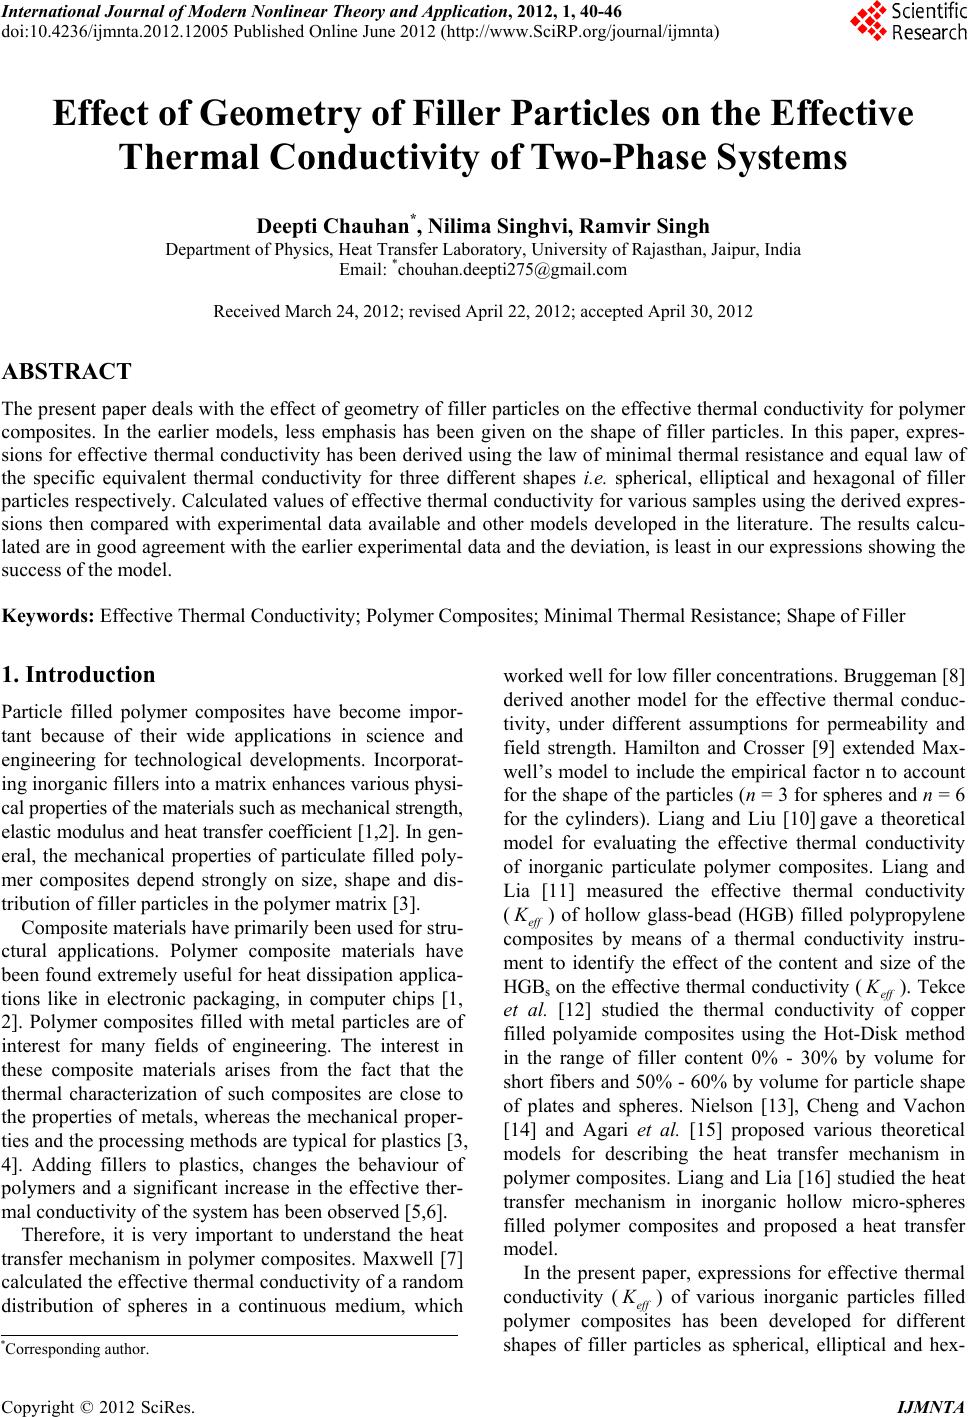
as spherical, elliptical and hexagonal Figures 2-3.
Hence, it is observed that the theoretical values for
eff
calculated by our model proposed for different
shapes, with other existing mathematical models Equa-
tions (1)-(3) are in good agreement with each other for
low volume fractions i.e.
< 0.3. This is because of
the low dispersion of particles in the matrix, due to which
the particles are not able to interact with each other.
However, when the volume fraction increases more than
0.3, there is a rapid increase in the eff
of the system as
the particles come closer as such the interaction between
filler particles become stronger.
4. Conclusions
Theoretical expressions for effective thermal conductiv-
ity for the polymer composites which were established,
was based on the law of minimal thermal resistance and
the equal law of the specific equivalent thermal conduc-
tivity. The different shapes of filler particles as spherical,
elliptical and hexagonal were considered for the calcula-
tions. Equations (17)-(19) gives the relationship between
the effective thermal conductivity (eff
) of filled poly-
mer composites in terms of inclusion volume fraction as
well as other physical parameters of polymer matrix and
fillers when filler volume fraction is less than 60%.
The values of the effective thermal conductivity (eff
)
of phenol-aldehyde/graphite, phenol aldehyde/aluminum
oxide, polypropylene/aluminum and polypropylene/cop-
per composites were then calculated. Good agreement
was found between the theoretical estimations and ex-
perimental data available in the literature. We further
plan to verify these formulae for some more samples.
REFERENCES
[1] C. P. Wong and R. S. Bollampally, “Thermal Conductiv-
ity, Elastic Modulus, and Coefficient of Thermal Expan-
sion of Polymer Composites Filled with Ceramic Particles
for Electronic Packaging,” Journal of Applied Polymer
Science, Vol. 74, No. 14, pp. 3396-3403.
doi:10.1002/(SICI)1097-4628(19991227)74:14<3396::AI
D-APP13>3.0.CO;2-3
[2] X. Lu and G. Xu, “Thermally Conductive Polymer Com-
posites for Electronic Packaging,” Journal of Applied
Polymer Science, Vol. 65, No. 13, 1997, pp. 2733-2738.
doi:10.1002/(SICI)1097-4628(19970926)65:13<2733::AI
D-APP15>3.0.CO;2-Y
[3] H. Tavman, “Thermal and Mechanical Properties of Cop-
per Powder Filled Poly (Ethylene) Composites,” Powder
Technology, Vol. 91, No. 1, 1997, pp. 63-67.
doi:10.1016/S0032-5910(96)03247-0
[4] A. Boudenne, L. Ibos, E. Gehin, M. Fois and J. C. Ma-
jeste, “Anomalous Behavior of Thermal Conductivity and
Diffusivity in Polymeric Materials Filled with Metallic
Particles,” Journal of Material Science, Vol. 40, No. 16,
2005, pp. 4163-4167. doi:10.1007/s10853-005-3818-2
[5] N. M. Sofian, M. Rusu, R. Neagu and E. Neagu, “Metal
Powder-Filled Polyethylene Composites. V. Thermal Pro-
perties,” Journal of Thermoplastic Composite Materials,
Vol. 14, No. 1, 2001, pp. 20-33.
doi:10.1106/9N6K-VKH1-MHYX-FBC4
[6] B. Weidenfeller, M. Hofer and F. R. Schilling, “Thermal
Conductivity, Thermal Diffusivity, and Specific Heat Ca-
pacity of Particle Filled Polypropylene,” Composites Part