Paper Menu >>
Journal Menu >>
 Journal of Minerals & Materials Characterization & Engineering, Vol. 5, No.1, pp 87-101, 2006 jmmce.org Printed in the USA. All rights reserved 87 The Role of Fillers on Friction and Slide Wear Characteristics in Glass-Epoxy Composite Systems B. Suresha*1, G. Chandramohan1, J. N. Prakash2, V. Balusamy3 and K.Sankaranarayanasamy4 1Department of Mechanical Engineering, PSG College of Technology, Coimbatore- 6 41 004, INDIA 2 Research and Development Centre, East Point College of Engineering. and Technology, Bangalore-560 025, INDIA 3 Department of Metallurgical Engineering, PSG College of Technology, Coimbatore- 6 41 004, INDIA 4 Department of Mechanical Engineering, National Institute of Technology, Trichy-620 015, INDIA *Corresponding author’s e-mail address: sureshab2004@yahoo.co.in ABSTRACT The comparative performance of Glass-Epoxy (G-E) composite systems interfaced with graded fillers has been examined. In this study, composite materials were experimentally investigated under varying load and sliding velocities by using a Pin-on-Disc type wear tester. The influence of two inorganic fillers, silicon carbide particles (SiC) and graphite, on the wear of the glass fabric reinforced epoxy composites under dry sliding conditions has been investigated. For increased load and sliding velocity situations, higher wear loss was recorded. Some of these observations are supplemented by scanning electron microscopic (SEM) investigations. The coefficients of frictional values show an increasing trend with subsequent increase in load/sliding velocities. It was observed that the Graphite filled G-E composite shows lower coefficient of friction than the other two composites irrespective of variation in the load/sliding velocities. SiC filled G-E composite exhibited the maximum wear resistance. Further, wear of the matrix, breakage of reinforcing fibers, matrix debris formation and interface separation were observed in unfilled and graphite-filled G-E composites. Other interesting SEM features have been noticed and discussed. KEYWORDS: Glass-epoxy composite; Fillers; Slide wear; Scanning electron microscopy. 88 Suresha, Chandramohan, Prakash, Balusamy, and Sankaranarayanasamy Vol.5, No.1 1. INTRODUCTION In recent times, there has been a remarkable growth in the large-scale production of fiber and/or filler reinforced epoxy matrix composites. Because of their high strength-to- weight and stiffness-to-weight ratios, they are extensively used for a wide variety of structural applications as in aerospace, automotive and chemical industries [1]. On account of their good combination of properties, fiber reinforced polymer composites (FRPCs) are used for producing a number of mechanical components such as gears, cams, wheels, brakes, clutches, bearings and seals. Most of these are subjected to tribological loading conditions. The FRPCs exhibit relatively low densities and they can also be tailored for our design requirements by altering the stacking sequences to provide high strength and stiffness in the direction of high loading [2]. A number of material-processing strategies have been used to improve the wear performance of polymers. Glass fiber reinforced polymeric composites traditionally show poor wear resistance and high friction due to the brittle nature of the reinforcing fibers. This has prompted many researchers to cast the polymers with fibers/fillers. Considerable efforts are being made to extend the range of applications. Such use would provide economical and functional benefits to both manufacturers and consumers. Various researchers have studied the tribological behaviour of FRPCs. Studies have been conducted with various shapes, sizes, types and compositions of fibers in a number of matrices [3-8]. In general these materials exhibit lower wear and friction when compared to pure polymers. An understanding of the friction and wear mechanisms of FRPC’s would aid in the development of a new class of materials so as to counter the challenges faced by researchers. Reviews of such works found in articles [9-11] have shown that the friction and wear behaviour of FRPCs exhibits anisotropic characteristics. Use of inorganic fillers dispersed in polymeric composites is increasing. Fillers not only reduce the cost of the composites, but also meet performance requirements, which could not have been achieved by using reinforcement and resin ingredients alone. In order to obtain perfect friction and wear properties many researchers modified polymers using different fillers [12-20]. Briscoe et al. [12] reported that the wear rate of high- density polyethylene (HDPE) was reduced with the addition of inorganic fillers, such as CuO and Pb3O4. Tanaka [13] concluded that the wear rate of polytetrofluroethylene (PTFE) was reduced when filled with ZrO2 and TiO2. Bahadur et al. [14-16] found that the compounds of copper such as CuO and CuS were very effective in reducing the wear rate of PEEK, PTFE, Nylon and HDPE. Kishore et al. [17] studied the influence of sliding velocity and load on the friction and wear behaviour of G-E composite, filled with either rubber or oxide particles, and reported that the wear loss increased with increase in load/speed. Solid lubricants such as graphite and MoS2 [18, 19] when added to polymers proved to be effective in reducing the coefficient of friction and wear rate of composites. Vol.5, No.1 The Role of Fillers on Friction and Slide Wear 89 The use of graphite as a particulate filler has been reported to improve tribological behavior in metal matrix composites (MMCs) [20]. Most of the above findings are based on either randomly oriented or unidirectionally oriented fiber composites. Woven fabric reinforced composites [21] are gaining popularity because of their balanced properties in the fabric plane as well as their ease of handling during fabrication. Mody et al. [22] have shown that the simultaneous existence of parallel and anti-parallel oriented carbon fibers in a woven configuration leads to a synergistic effect on the enhancement of the wear resistance of the composite. The objective of this work is to investigate the friction and wear properties of particulate filled G-E composites sliding against a hardened steel counterface. As a comparison, the friction and wear properties of plain G-E were also evaluated under identical test conditions. This work helps in understanding the function of different fillers in G-E composites. This work is believed to be helpful for understanding the function of different fillers in G-E composites. 2. EXPERIMENTAL 2.1 Materials Woven glass fabrics made of 360 gsm, containing E-glass fibers of diameter 5-10 µm has been employed. The matrix system used is a medium viscosity epoxy resin (LAPOX L-12) and a room temperature curing polyamine hardener (K-6) both supplied by ATUL India Ltd, Gujarat, India. The fillers that have been used are silicon carbide (SiC) and graphite particulates. 2.2 Fabrication All laminates used in this study were manufactured by dry hand lay up technique. E-glass plain weave roving fabric, which is compatible to epoxy resin, is used as the reinforcement. The epoxy resin is mixed with the hardener in the ratio 100:12 by weight. The stacking procedure consists of placing the fabric one above the other with the resin mix well spread between the fabrics. A porous teflon film is placed on the completed stack. To ensure uniform thickness of the sample a spacer of size 3 mm is used. The mold plates have a release agent smeared on it. The whole assembly is pressed in a hydraulic press (0.5 MPa) and allowed to cure for a day at room temperature. After demolding, post curing was done at 120οC for 2 h using an electrical oven. The laminate so prepared has a size 250 mm X 250 mm X 3 mm. To prepare the filled G-E composites, filler (SiC and Graphite) is mixed with a known amount of epoxy resin. The details of the composites are shown in Table 1. The test samples are cut to size 5 mm x 5 mm x 3 mm with the help of a diamond tipped cutter.  90 Suresha, Chandramohan, Prakash, Balusamy, and Sankaranarayanasamy Vol.5, No.1 Table 1. Details of samples prepared 2.3 Test procedure A pin-on-disc test setup was used for slide wear experiments. The surface of the sample (5 mm X 5 mm) glued to a pin of dimensions 6 mm diameter and 22 mm length comes in contact with a hardened disc of hardness 62 HRC. The counter surface disc was made of En 32 steel having dimensions of 165 mm diameter, 8 mm thick and surface roughness (Ra) of 0.84 µm. The test was conducted on a track of 115 mm diameter for a specified test duration, load and velocity [23]. Prior to testing, the test samples were rubbed against a 600-grade SiC paper. The surfaces of both the sample and the disc were cleaned with a soft paper soaked in acetone before the test. The pin assembly was initially weighed using a digital electronic balance (0.1 mg accuracy). The test was carried out by applying normal load (30 N to 70 N) and run for a constant sliding distance (5000 m) at different sliding velocities (3, 4 and 5 m/s). At the end of the test, the pin assembly was again weighed in the same balance. The difference between the initial and final weights was a measure of slide wear loss. A minimum of three trials was conducted to ensure repeatability of test data. The friction force at the sliding interface of the specimen was measured at an interval of 5 minutes using a frictional load cell. The coefficient of friction was obtained by dividing the frictional force by the applied normal force. Selected samples were coated with a thin layer of gold on the worn surface and subjected to microscopic examination using scanning electron microscope. 3. RESULTS AND DISCUSSION Experimental data on the slide wear loss of filled and unfilled G-E composite samples are shown in Figs. 1 to 3 for different loads (30 to 70 N) and sliding velocities (3 to 5 m/s). Table 2 shows the results pertaining to the coefficient of friction of filled and unfilled G-E composite system. It is observed from the figures and Table 2 that there is a strong inter-dependence between the friction coefficient and wear loss irrespective of the loads and sliding velocities employed. The SEM photographs of select combinations of Sample code Matrix Reinforcement Filler wt. % A Epoxy E-glass fabric Graphite 5 B Epoxy E-glass fabric SiCp 5 C Epoxy E-glass fabric ---- ---- 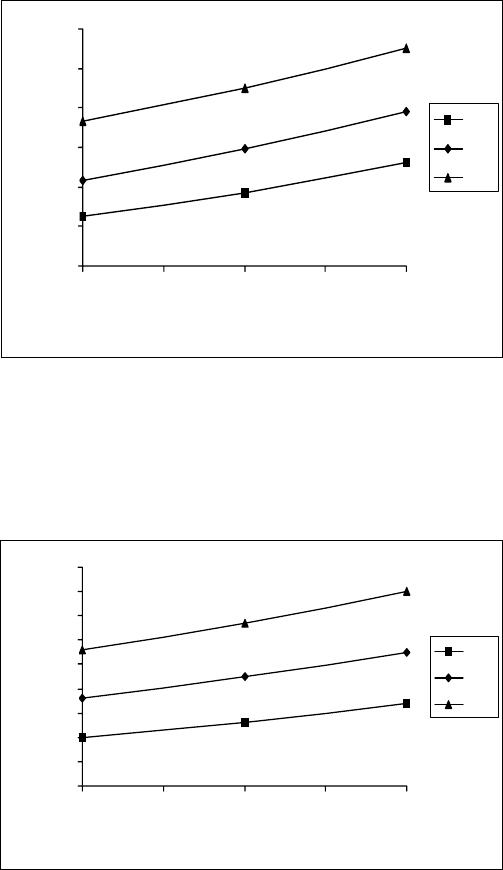 Vol.5, No.1 The Role of Fillers on Friction and Slide Wear 91 filled and unfilled G-E samples subjected to slide wear are shown in Figs. 4, 5 and 6 respectively. 0 0.002 0.004 0.006 0.008 0.01 0.012 33.544.5 5 Sliding ve locit y, m/ s Wear loss, g 30 N 50 N 70 N Figure 1. Wear loss versus sliding velocity of “A” type sample. 0 0.001 0.002 0.003 0.004 0.005 0.006 0.007 0.008 0.009 33.544.55 Sliding velocit y, m/ s Wear l o ss, g 30 N 50 N 70 N Figure 2. Wear loss versus sliding velocity of “B” type sample.  92 Suresha, Chandramohan, Prakash, Balusamy, and Sankaranarayanasamy Vol.5, No.1 0 0.002 0.004 0.006 0.008 0.01 0.012 0.014 0.016 0.018 33.5 44.5 5 Sliding velocit y, m/ s Wear loss, g 30 N 50 N 70 N Figure 3. Wear loss versus sliding velocity of “C” type sample. Table 2. Coefficient of friction of samples tested Coefficient of friction Sliding velocity 3 m/s Sliding velocity 4 m/s Sliding velocity 5 m/s Load, N A B C A B C A B C 30 N 0.30 0.37 0.38 0.31 0.38 0.41 0.33 0.40 0.43 50 N 0.33 0.40 0.42 0.38 0.45 0.47 0.37 0.51 0.52 70 N 0.35 0.50 0.51 0.45 0.52 0.54 0.42 0.55 0.61  Vol.5, No.1 The Role of Fillers on Friction and Slide Wear 93 (a) (b) (b) (c)  94 Suresha, Chandramohan, Prakash, Balusamy, and Sankaranarayanasamy Vol.5, No.1 (d) Figure 4. SEM picture of “A” sample at: (a) 30 N, 3 m/s, (b) 30 N, 5 m/s. (c) 70N, 3 m/s, and (d) 70 N, 5 m/s. (a) (a) (b)  Vol.5, No.1 The Role of Fillers on Friction and Slide Wear 95 (c) (d) Figure 5. SEM picture of “B” sample at: (a) 30 N, 3 m/s, (b) 30 N, 5 m/s. (c) 70N, 3 m/s, and (d) 70 N, 5 m/s. (a)  96 Suresha, Chandramohan, Prakash, Balusamy, and Sankaranarayanasamy Vol.5, No.1 (b) (c) (d) Figure 6. SEM picture of “C” sample at: (a) 30 N, 3 m/s, (b) 30 N, 5 m/s. (c) 70N, 3 m/s, and (d) 70 N, 5 m/s. Vol.5, No.1 The Role of Fillers on Friction and Slide Wear 97 3.1 Coefficient of friction The variation in coefficient of friction with varying sliding velocities/loads of filled and unfilled G-E composites is shown in Table 2. For the filled G-E composites, an increasing trend in the coefficient of friction is seen, with increase in sliding velocity/load. However, comparison of graphite-filled G-E (sample A) with SiC-G-E (sample B) and G-E composites (sample C) indicate that the coefficient of friction of graphite filled G-E composite (sample A) is less. The reduction in coefficient of friction is attributed to the presence of graphite particulates acting as a solid lubricant. On the other hand, the increase in coefficient of friction in SiC-G-E may occur because of the inclusion of hard silicon carbide particles. For the unfilled G-E samples, like in filled G-E samples, an increase in sliding velocity/load results in increase in the coefficient of friction. The increase in coefficient of friction is due to the fact that easy detachment of softened epoxy from the reinforcement and more breakage of reinforced glass fibers. 3.2 Slide wear data The slide wear data of filled and unfilled G-E composites shown in Figs. 1 to 3 are considered for interpretation. The results reveal that the wear loss increases with increase in sliding velocity irrespective of the load employed both for filled and unfilled G-E composite systems. However, the magnitudes of wear loss values are much less in filled G-E samples compared to unfilled G-E samples at all loads. It is seen from Figs. 1 to 3 that the filler in G-E composites appears to influence the friction and wear behaviour. The wear losses of the composites decreases with filler addition and show the maximum wear resistance (least wear loss) for SiC-filled G-E and the least for unfilled G-E). For C-type sample, the fibers are oriented parallel to the sliding surface and also to the sliding direction. In this position the fibers can be easily detached from the matrix; hence it is observed that the increase in wear loss is much greater than that observed in filled G-E composite samples. Further, increased exposure of the reinforcement of fibers to the counter surface results in increased fiber fracture due to the frictional thrust. 98 Suresha, Chandramohan, Prakash, Balusamy, and Sankaranarayanasamy Vol.5, No.1 3.3 Scanning electron microscopy The slide wear data in respect of select samples are discussed based on the scanning electron microscopic features. The SEM pictures of Sample A shown in Figs. 4(a) and 4(b) pertaining to the test conditions of 30 N, 3 m/s and 30 N, 5 m/s respectively are considered for interpretation. Thus Fig. 4(a) shows less wear of the matrix, matrix covering the debris and hardly any breakage of fibers. Fig. 4(b) on the other hand, shows higher degree of fiber breakage, mostly cleavage type of smaller size and smearing of debris on the fibers (marked ‘A’ in Fig. 4(b)). The observations corroborate the wear data reported in Fig. 1. For the same sample at higher load of 70 N, keeping the sliding velocity at 3 m/s and 5 m/s respectively, Fig. 4c and 4d show the corresponding SEM features. Thus, Fig. 4(c) displays increased debris formation, agglomeration of debris, adherence of debris on the fibers and more number of breakage of fibers compared to the condition seen in Fig. 4(a) (30 N, 3 m/s). Figure 4(d) records increased breakage of fibers with cleavage type of fracture, interface separation between the fibers and matrix and debris formation concentrated at specific locations. Further, few fibers along the sliding direction are found to be disoriented. There is one to one correspondence between the SEM observations and wear test results. The SEM picture of B-type sample subjected to a load of 30 N and sliding velocity 3 m/s is shown in Fig. 5(a). The spread of the matrix and fewer wear debris formation are noticed. Both delamination and debonding increased with increasing sliding velocity (5 m/s), which resulted in exposure of reinforced fibers (Fig. 5(b)) along the sliding direction. In Fig. 5(c), it is noticed that the debris begins to cluster around the fibers. When Fig. 5(d) is compared with the Fig. 5(b), it is obvious that with application of higher load and no change in sliding velocity there has been observed increase of more breakage of fibers and further the broken fibers show inclined type of fracture. These observations are in accordance with experimental wear test data presented in Fig. 2. The SEM features of C- type samples (plain G-E composite) subjected to various loads and sliding velocities are displayed in Figs. 6(a) to 6(d). Fig. 6(a) shows the SEM picture of the sample subjected to 30 N load and a sliding velocity of 3 m/s. It is observed that the matrix wear is more and fiber exposure is less (compare Fig. 6(a) with Fig. 4(a) and 5(a)). These features support the wear behaviour as seen in Fig. 3. The SEM features pertaining to 30 N load and 5 m/s sliding velocity is shown in Fig. 6(b), which reveals that the matrix debris is well spread, yielding more number of glass fiber breakages compared to the sample subjected to 30 N load and 3 m/s sliding velocity (Fig. 6(a)). By increasing the load from 30 N to 70 N and keeping the sliding velocity at 3 m/s, the wear surface features of sample C shows higher wear of the matrix, increased fiber-matrix debonding as well as breakage of fibers as shown in Fig. 6(c). Increasing the velocity to 5 m/s for the same sample (Fig. 6(d)) results in higher matrix debris formation and heavy breakage of glass fibers (cleavage type) in large numbers compared to Fig. 6(c) (70 N, 3 Vol.5, No.1 The Role of Fillers on Friction and Slide Wear 99 m/s). Also, the wear debris is getting totally distributed. These SEM photographs corroborate the wear data shown in Fig. 3. 4. CONCLUSIONS The following inferences are drawn from the above study. • Inclusion of Graphite and SiC particulate fillers contributed significantly in reducing friction and exhibited better wear resistant properties. • Silicon carbide filled G-E composite shows higher resistance to slide wear compared to plain G-E composites. • There has been an observed marked improvement in wear resistance as seen in SiC- G-E composite sample compared to plain G-E sample. • Graphite filled G-E composite shows lower coefficient of friction compared to the other two samples. The reduction in coefficient of friction in A-type sample can be attributed to the presence of Graphite which acts as a solid lubricant. • SEM examinations of worn surfaces show that the type of wear changed from adhesive wear to abrasive wear for all the samples tested. • Increased wear resistance and reduced coefficient of friction are positive traits, which make the composite suitable to be used as liners in coal handling equipments. ACKNOWLEDGEMENTS The authors are grateful to the Additional Director Dr. S. Seetharamu of Central Power Research Institute, Materials Testing Division, Bangalore for extending the laboratory facilities for the present study. The authors thank the Central Power Research Institute management for the permission extended to publish this paper. REFERENCES [1] ASM Hand book, 1992, Materials Park, Ohio, USA, ASM International, Volume 18. [2] Pascoe, M.W., 1973, “Plain and filled plastics materials in bearing: a review.” Tribology, Vol. 6 No. 5, pp. 184-190. [3] Sung, N.H., and Suh, N.P., 1979, “Effect of Fiber orientation on friction and wear of fiber reinforced polymeric composites.” Wear, Vol. 53, pp. 129-141. [4] Chang, H.W., 1983, “Wear characteristics of composite: effect of fiber orientation.” Wear, Vol. 85, No. 1, pp. 81-91. [5] Suresha, B., Chandramohan, G., Samapthkumaran, P., Seetharamu, S., and Vynatheya, S., 2006, “Friction and wear characteristics of carbon-epoxy and glass- 100 Suresha, Chandramohan, Prakash, Balusamy, and Sankaranarayanasamy Vol.5, No.1 epoxy woven roving fiber composites.” Journal of Reinforced Polymers and composites, Vol. 25, pp. 771-782. [6] Bijwe, J., Tewari, U.S., and Vasudevan, P., 1989 “Friction and wear studies of short glass fiber reinforced polythermide composite.” Wear, Vol. 132, pp. 247-264. [7] Viswanth, B., Verma, A.P., and Rao, C.V.S.K., 1991, “Effect of fiber geometry on friction and wear of glass fiber-reinforced composites.” Wear, Vol. 145, pp. 315-327. [8] Tripaty, B.S., Furey, M.J., 1993, “Tribological behaviour unidirectional graphite- epoxy and carbon -PEEK composites. Wear, Vol. 162-164, pp. 385-396. [9] EI-Sayed, A.A, EI-Sherbiny, M.J., Abo-EI-Ezz, A.S., Aggag, G.A., 1995, “Friction and wear properties of polymeric composite materials for bearing applications.” Wear, Vol. 184, pp. 45-53. [10] Cirino, M., Friedrich, K., and Pipes, R.B., 1988, “The effect of fiber orientation on the abrasive wear behaviour of polymer composite materials.” Wear, Vol. 121, pp. 127-141. [11] Lancaster, J. K., 1972, “Lubrication of carbon fiber-reinforced polymers : Part II— Organic fluids.” Wear, Vol. 20, No. 3, pp. 335-351. [12] Briscoe, B. J., Pogosion, A. K., and Tabor, D., 1974, “The friction and wear of high Density polyethylene; the action of lead oxide and copper oxide fillers.” Wear, Vol. 27, pp. 19-34. [13] Tanaka, K., 1986, Effect of various fillers on the friction and wear of PTFE-based composites, In: Friction and Wear of Polymer composites, Volume 205, pp. 137-174, (Friedrich K editor), Elsevier, Amsterdam. [14] Bahadur, S., Fu, Q., and Gong, D., 1994, “The effect of reinforcement and the synergism between CuS and carbon fiber on the wear of nylon.” Wear, Vol. 178, pp. 123-130. [15] Bahadur, S., and Tabor, D., 1985, Role of fillers in friction and wear behaviour of HDPE In: Polymer wear and its control, Volume 287-268 (L.H. Lee (ed.) ACM symposium series, Washington DC. [16] Bahadur, S., Gong, D., Anderegg, J. W., 1992 “The role of copper composites as fillers in the transfer film formation and wear of Nylon.” Wear, Vol. 154, pp. 207- 223. [17] Kishore, Sampathkumaran, P., Seetharamu, S., Vynatheya, S., Murali, A., Kumar, R. K., 2000, “SEM observations of the effect of velocity and load on the slide wear characteristics glass-fabric-epoxy composites with different fillers.” Wear, Vol. 237, pp. 20-27. [18] Kishore, Sampathkumaran, P., Seetharamu. S., Thomas, P., Janardhana, M. A., 2005, “Study on the effect of the type and content of filler in epoxy-glass composite system on the friction and wear characteristics.” Wear Vol. 259, pp. 634-641. [19] Wang, J., Gu, M., Songhao, Ge, S., 2003, “The role of the influence of MoS2 on the tribological properties of carbon fiber reinforced Nylon 1010 composites.” Wear, Vol. 255, pp. 774-779. Vol.5, No.1 The Role of Fillers on Friction and Slide Wear 101 [20] Basavarajappa, S., Chandramohan, G. C., 2005, “Wear studies on metal matrix composites: A Taguchi Approach.” J. of Materials Sci. and Tech., Vol. 21, No. 6, pp. 348-350. [21] Viswanath, B., Verma, A. P., and Kameswara Rao, C. V. S., 1992, “Effect of matrix content on strength and wear of woven roving glass polymeric composites.” Comp Sci Tech., Vol. 44 pp. 77-86. [22] Mody, P. B., Chou, T. W., Friedrich, K., 1988, “Effect of testing conditions and microstructure on the sliding wear of graphite fiber/PEEK matrix composites.” J. Mater. Sci., Vol. 23, pp. 4319-4330. [23] Annual hand book of ASTM standards, Section 3,03,02, ASTM G-99 (1995), Phildelphia, USA. |