Paper Menu >>
Journal Menu >>
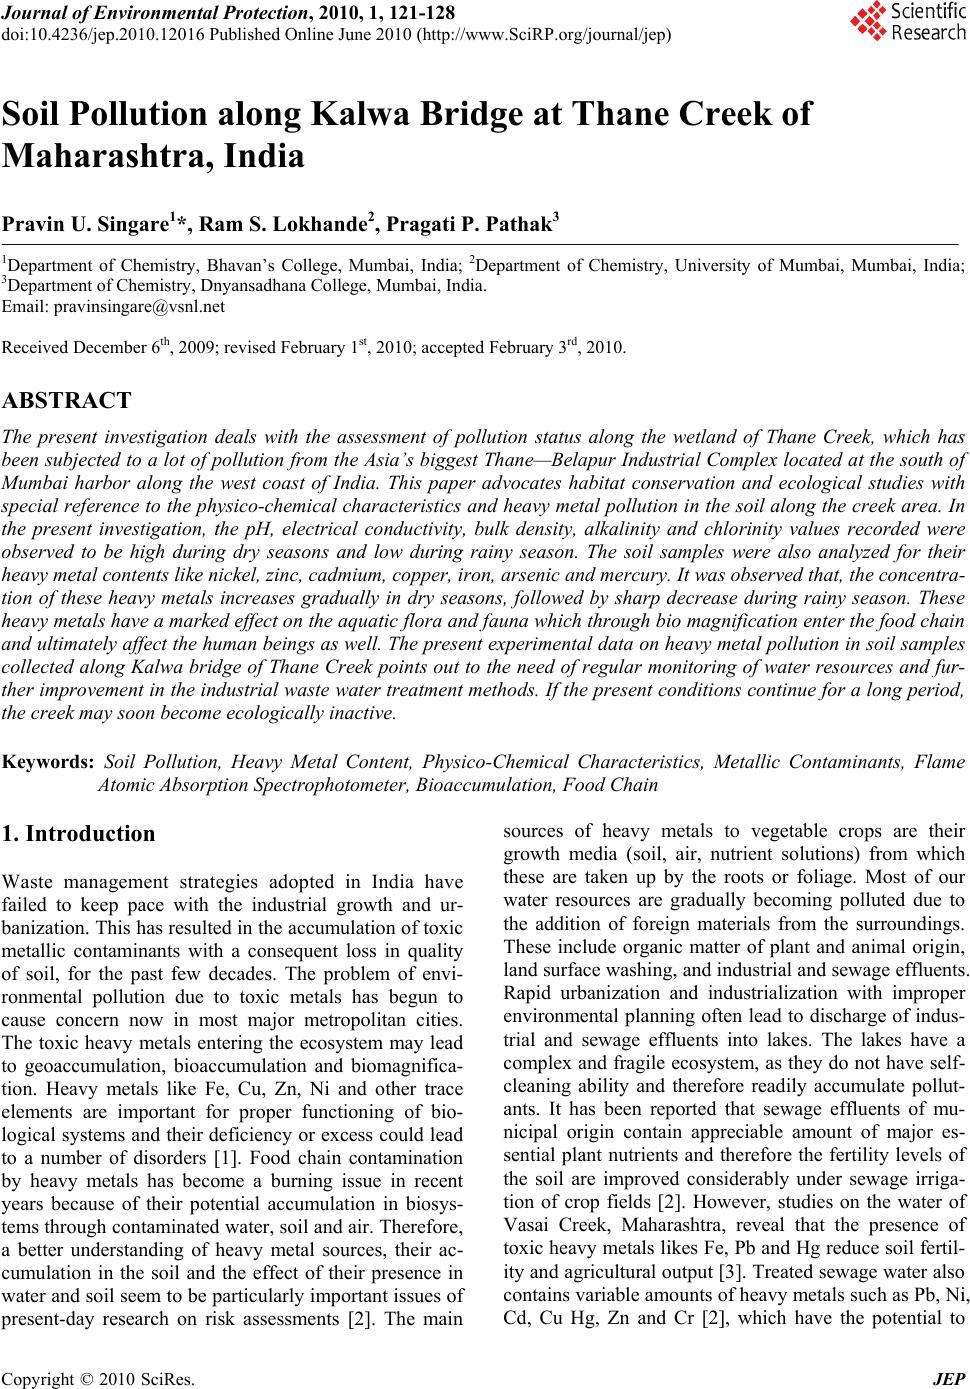 Journal of Environmental Protection, 2010, 1, 121-128 doi:10.4236/jep.2010.12016 Published Online June 2010 (http://www.SciRP.org/journal/jep) Copyright © 2010 SciRes. JEP 1 Soil Pollution along Kalwa Bridge at Thane Creek of Maharashtra, India Pravin U. Singare1*, Ram S. Lokhande2, Pragati P. Pathak3 1Department of Chemistry, Bhavan’s College, Mumbai, India; 2Department of Chemistry, University of Mumbai, Mumbai, India; 3Department of Chemistry, Dnyansadhana College, Mumbai, India. Email: pravinsingare@vsnl.net Received December 6th, 2009; revised February 1st, 2010; accepted February 3rd, 2010. ABSTRACT The present investigation deals with the assessment of pollution status along the wetland of Thane Creek, which has been subjected to a lot of pollution from the Asia’s biggest Thane—Belapur Industrial Complex located at the south of Mumbai harbor along the west coast of India. This paper advocates habitat conservation and ecological studies with special reference to the physico-chemical characteristics and heavy metal pollution in the soil along the creek area. In the present investigation, the pH, electrical conductivity, bulk density, alkalinity and chlorinity values recorded were observed to be high during dry seasons and low during rainy season. The soil samples were also analyzed for their heavy metal contents like nickel, zinc, cadmium, copper, iron, arsenic and mercury. It was observed that, the concentra- tion of these heavy metals increases gradually in dry seasons, followed by sharp decrease during rainy season. These heavy metals have a marked effect on the aquatic flora and fauna which through bio magnification enter the food chain and ultimately affect the human beings as well. The present experimental data on heavy metal pollution in soil samples collected along Kalwa bridge of Thane Creek points out to the need of regular monitoring of water resources and fur- ther improvement in the industrial waste water treatment methods. If the present conditions continue for a long period, the creek may soon become ecologically inactive. Keywords: Soil Pollution, Heavy Metal Content, Physico-Chemical Characteristics, Metallic Contaminants, Flame Atomic Absorption Spectrophotometer, Bioaccumulation, Food Chain 1. Introduction Waste management strategies adopted in India have failed to keep pace with the industrial growth and ur- banization. This has resulted in the accumulation of toxic metallic contaminants with a consequent loss in quality of soil, for the past few decades. The problem of envi- ronmental pollution due to toxic metals has begun to cause concern now in most major metropolitan cities. The toxic heavy metals entering the ecosystem may lead to geoaccumulation, bioaccumulation and biomagnifica- tion. Heavy metals like Fe, Cu, Zn, Ni and other trace elements are important for proper functioning of bio- logical systems and their deficiency or excess could lead to a number of disorders [1]. Food chain contamination by heavy metals has become a burning issue in recent years because of their potential accumulation in biosys- tems through contaminated water, soil and air. Therefore, a better understanding of heavy metal sources, their ac- cumulation in the soil and the effect of their presence in water and soil seem to be particularly important issues of present-day research on risk assessments [2]. The main sources of heavy metals to vegetable crops are their growth media (soil, air, nutrient solutions) from which these are taken up by the roots or foliage. Most of our water resources are gradually becoming polluted due to the addition of foreign materials from the surroundings. These include organic matter of plant and animal origin, land surface washing, and industrial and sewage effluents. Rapid urbanization and industrialization with improper environmental planning often lead to discharge of indus- trial and sewage effluents into lakes. The lakes have a complex and fragile ecosystem, as they do not have self- cleaning ability and therefore readily accumulate pollut- ants. It has been reported that sewage effluents of mu- nicipal origin contain appreciable amount of major es- sential plant nutrients and therefore the fertility levels of the soil are improved considerably under sewage irriga- tion of crop fields [2]. However, studies on the water of Vasai Creek, Maharashtra, reveal that the presence of toxic heavy metals likes Fe, Pb and Hg reduce soil fertil- ity and agricultural output [3]. Treated sewage water also contains variable amounts of heavy metals such as Pb, Ni, Cd, Cu Hg, Zn and Cr [2], which have the potential to 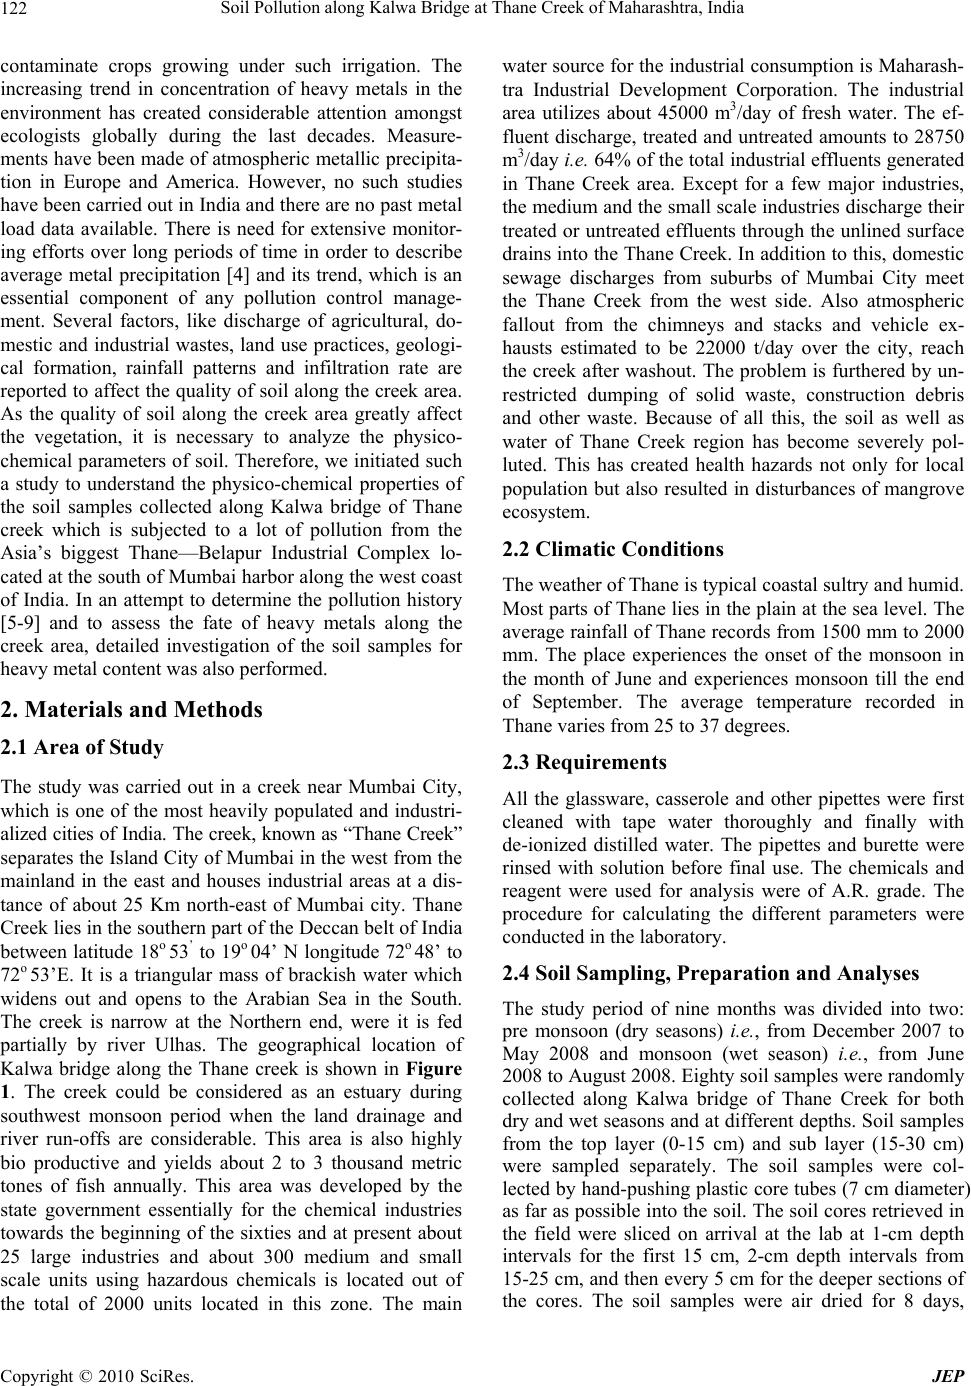 Soil Pollution along Kalwa Bridge at Thane Creek of Maharashtra, India 122 contaminate crops growing under such irrigation. The increasing trend in concentration of heavy metals in the environment has created considerable attention amongst ecologists globally during the last decades. Measure- ments have been made of atmospheric metallic precipita- tion in Europe and America. However, no such studies have been carried out in India and there are no past metal load data available. There is need for extensive monitor- ing efforts over long periods of time in order to describe average metal precipitation [4] and its trend, which is an essential component of any pollution control manage- ment. Several factors, like discharge of agricultural, do- mestic and industrial wastes, land use practices, geologi- cal formation, rainfall patterns and infiltration rate are reported to affect the quality of soil along the creek area. As the quality of soil along the creek area greatly affect the vegetation, it is necessary to analyze the physico- chemical parameters of soil. Therefore, we initiated such a study to understand the physico-chemical properties of the soil samples collected along Kalwa bridge of Thane creek which is subjected to a lot of pollution from the Asia’s biggest Thane—Belapur Industrial Complex lo- cated at the south of Mumbai harbor along the west coast of India. In an attempt to determine the pollution history [5-9] and to assess the fate of heavy metals along the creek area, detailed investigation of the soil samples for heavy metal content was also performed. 2. Materials and Methods 2.1 Area of Study The study was carried out in a creek near Mumbai City, which is one of the most heavily populated and industri- alized cities of India. The creek, known as “Thane Creek” separates the Island City of Mumbai in the west from the mainland in the east and houses industrial areas at a dis- tance of about 25 Km north-east of Mumbai city. Thane Creek lies in the southern part of the Deccan belt of India between latitude 18o 53’ to 19o 04’ N longitude 72o 48’ to 72o 53’E. It is a triangular mass of brackish water which widens out and opens to the Arabian Sea in the South. The creek is narrow at the Northern end, were it is fed partially by river Ulhas. The geographical location of Kalwa bridge along the Thane creek is shown in Figure 1. The creek could be considered as an estuary during southwest monsoon period when the land drainage and river run-offs are considerable. This area is also highly bio productive and yields about 2 to 3 thousand metric tones of fish annually. This area was developed by the state government essentially for the chemical industries towards the beginning of the sixties and at present about 25 large industries and about 300 medium and small scale units using hazardous chemicals is located out of the total of 2000 units located in this zone. The main water source for the industrial consumption is Maharash- tra Industrial Development Corporation. The industrial area utilizes about 45000 m3/day of fresh water. The ef- fluent discharge, treated and untreated amounts to 28750 m3/day i.e. 64% of the total industrial effluents generated in Thane Creek area. Except for a few major industries, the medium and the small scale industries discharge their treated or untreated effluents through the unlined surface drains into the Thane Creek. In addition to this, domestic sewage discharges from suburbs of Mumbai City meet the Thane Creek from the west side. Also atmospheric fallout from the chimneys and stacks and vehicle ex- hausts estimated to be 22000 t/day over the city, reach the creek after washout. The problem is furthered by un- restricted dumping of solid waste, construction debris and other waste. Because of all this, the soil as well as water of Thane Creek region has become severely pol- luted. This has created health hazards not only for local population but also resulted in disturbances of mangrove ecosystem. 2.2 Climatic Conditions The weather of Thane is typical coastal sultry and humid. Most parts of Thane lies in the plain at the sea level. The average rainfall of Thane records from 1500 mm to 2000 mm. The place experiences the onset of the monsoon in the month of June and experiences monsoon till the end of September. The average temperature recorded in Thane varies from 25 to 37 degrees. 2.3 Requirements All the glassware, casserole and other pipettes were first cleaned with tape water thoroughly and finally with de-ionized distilled water. The pipettes and burette were rinsed with solution before final use. The chemicals and reagent were used for analysis were of A.R. grade. The procedure for calculating the different parameters were conducted in the laboratory. 2.4 Soil Sampling, Preparation and Analyses The study period of nine months was divided into two: pre monsoon (dry seasons) i.e., from December 2007 to May 2008 and monsoon (wet season) i.e., from June 2008 to August 2008. Eighty soil samples were randomly collected along Kalwa bridge of Thane Creek for both dry and wet seasons and at different depths. Soil samples from the top layer (0-15 cm) and sub layer (15-30 cm) were sampled separately. The soil samples were col- lected by hand-pushing plastic core tubes (7 cm diameter) as far as possible into the soil. The soil cores retrieved in the field were sliced on arrival at the lab at 1-cm depth intervals for the first 15 cm, 2-cm depth intervals from 15-25 cm, and then every 5 cm for the deeper sections of the cores. The soil samples were air dried for 8 days, Copyright © 2010 SciRes. JEP 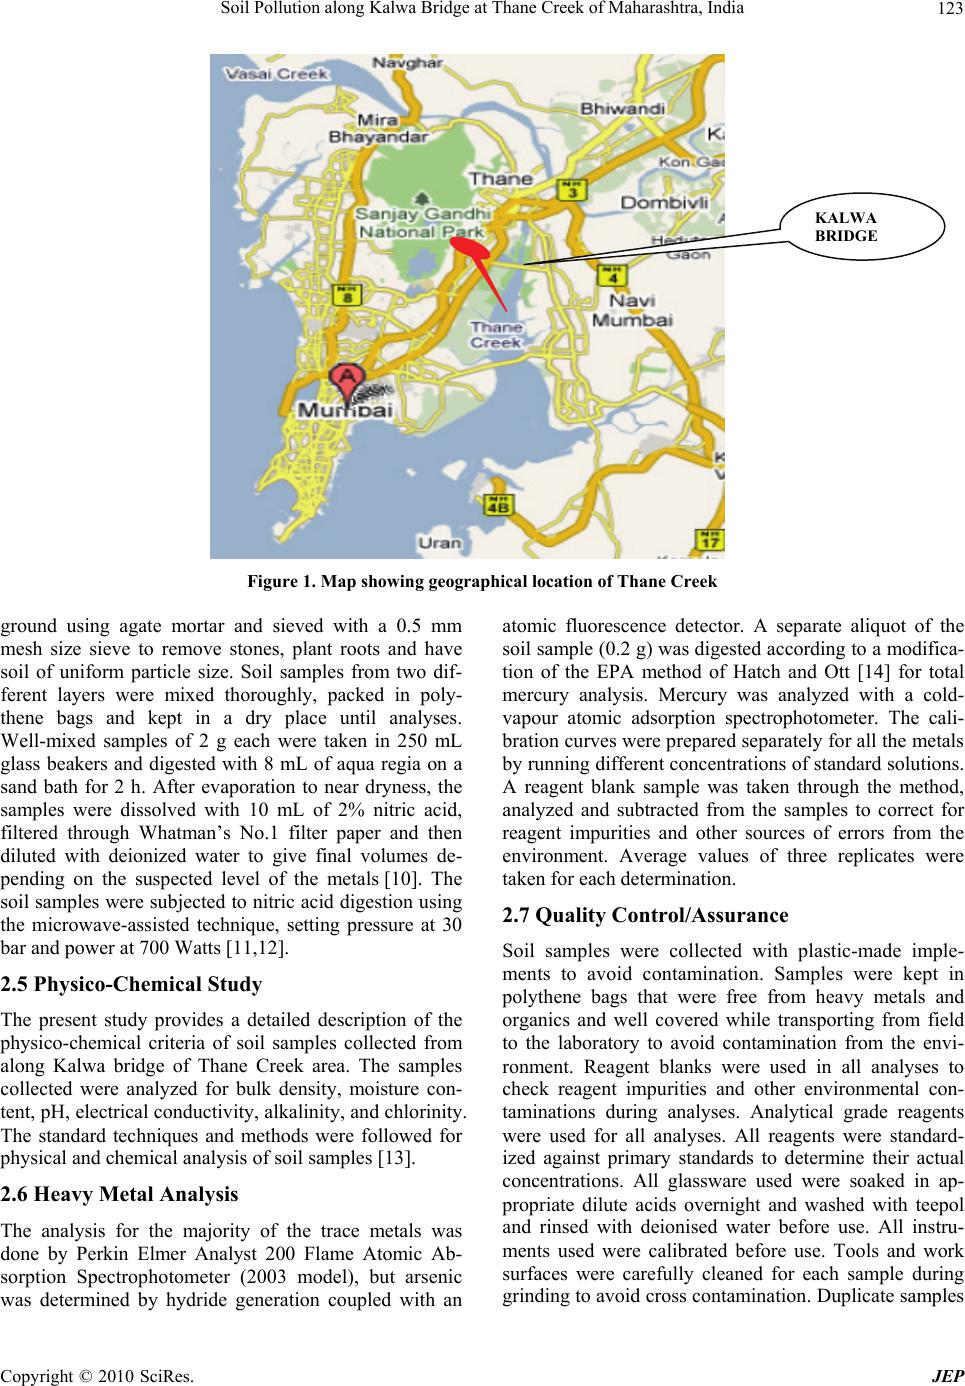 Soil Pollution along Kalwa Bridge at Thane Creek of Maharashtra, India 123 KALWA BRIDGE Figure 1. Map showing geographical location of Thane Creek ground using agate mortar and sieved with a 0.5 mm mesh size sieve to remove stones, plant roots and have soil of uniform particle size. Soil samples from two dif- ferent layers were mixed thoroughly, packed in poly- thene bags and kept in a dry place until analyses. Well-mixed samples of 2 g each were taken in 250 mL glass beakers and digested with 8 mL of aqua regia on a sand bath for 2 h. After evaporation to near dryness, the samples were dissolved with 10 mL of 2% nitric acid, filtered through Whatman’s No.1 filter paper and then diluted with deionized water to give final volumes de- pending on the suspected level of the metals [10]. The soil samples were subjected to nitric acid digestion using the microwave-assisted technique, setting pressure at 30 bar and power at 700 Watts [11,12]. 2.5 Physico-Chemical Study The present study provides a detailed description of the physico-chemical criteria of soil samples collected from along Kalwa bridge of Thane Creek area. The samples collected were analyzed for bulk density, moisture con- tent, pH, electrical conductivity, alkalinity, and chlorinity. The standard techniques and methods were followed for physical and chemical analysis of soil samples [13]. 2.6 Heavy Metal Analysis The analysis for the majority of the trace metals was done by Perkin Elmer Analyst 200 Flame Atomic Ab- sorption Spectrophotometer (2003 model), but arsenic was determined by hydride generation coupled with an atomic fluorescence detector. A separate aliquot of the soil sample (0.2 g) was digested according to a modifica- tion of the EPA method of Hatch and Ott [14] for total mercury analysis. Mercury was analyzed with a cold- vapour atomic adsorption spectrophotometer. The cali- bration curves were prepared separately for all the metals by running different concentrations of standard solutions. A reagent blank sample was taken through the method, analyzed and subtracted from the samples to correct for reagent impurities and other sources of errors from the environment. Average values of three replicates were taken for each determination. 2.7 Quality Control/Assurance Soil samples were collected with plastic-made imple- ments to avoid contamination. Samples were kept in polythene bags that were free from heavy metals and organics and well covered while transporting from field to the laboratory to avoid contamination from the envi- ronment. Reagent blanks were used in all analyses to check reagent impurities and other environmental con- taminations during analyses. Analytical grade reagents were used for all analyses. All reagents were standard- ized against primary standards to determine their actual concentrations. All glassware used were soaked in ap- propriate dilute acids overnight and washed with teepol and rinsed with deionised water before use. All instru- ments used were calibrated before use. Tools and work surfaces were carefully cleaned for each sample during grinding to avoid cross contamination. Duplicate samples Copyright © 2010 SciRes. JEP 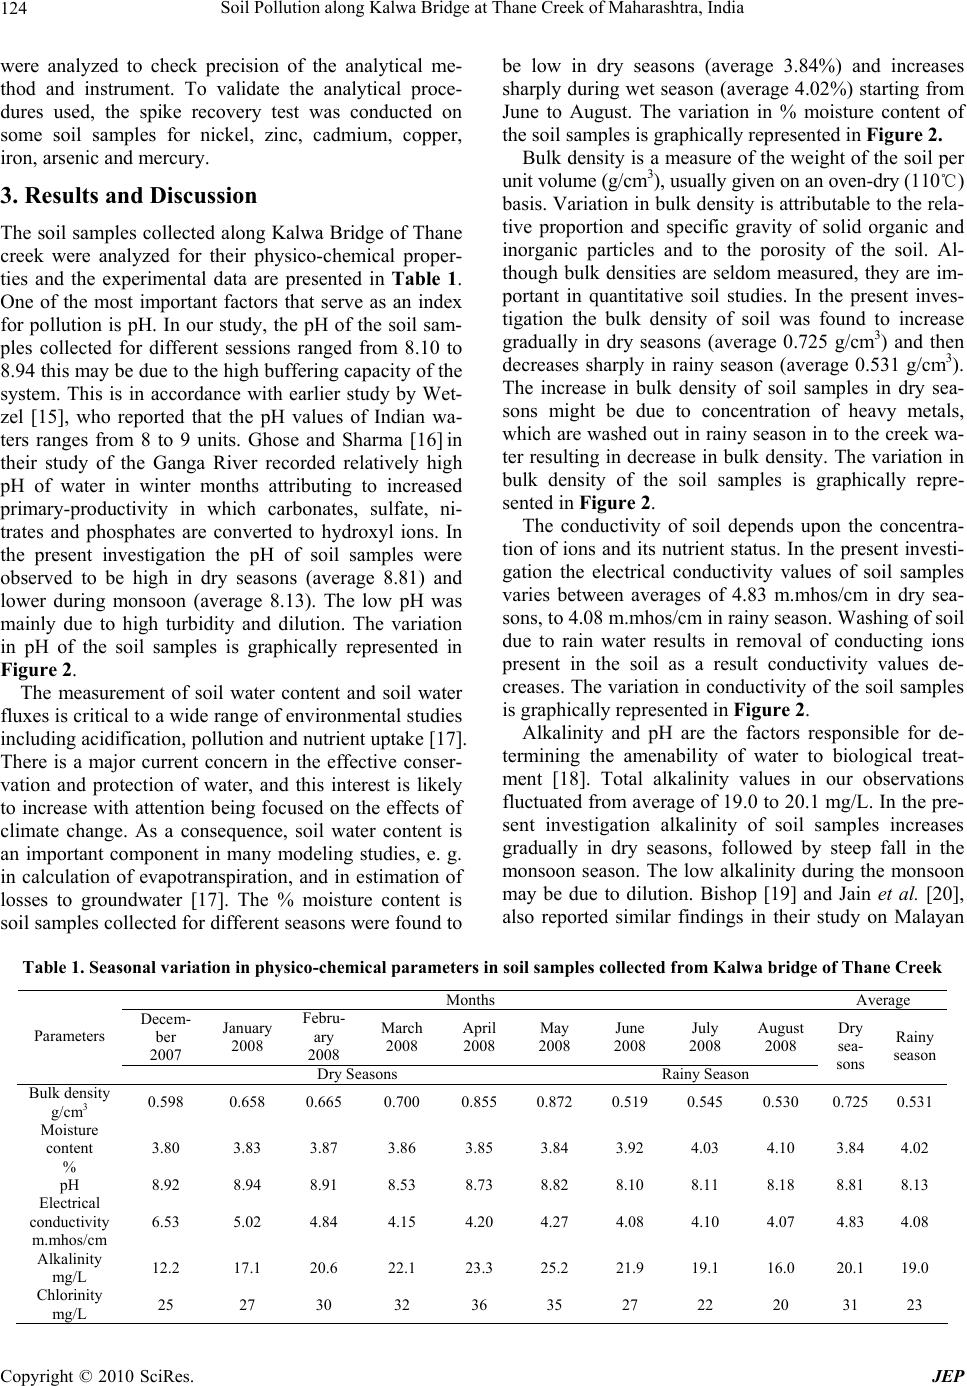 Soil Pollution along Kalwa Bridge at Thane Creek of Maharashtra, India 124 were analyzed to check precision of the analytical me- thod and instrument. To validate the analytical proce- dures used, the spike recovery test was conducted on some soil samples for nickel, zinc, cadmium, copper, iron, arsenic and mercury. 3. Results and Discussion The soil samples collected along Kalwa Bridge of Thane creek were analyzed for their physico-chemical proper- ties and the experimental data are presented in Table 1. One of the most important factors that serve as an index for pollution is pH. In our study, the pH of the soil sam- ples collected for different sessions ranged from 8.10 to 8.94 this may be due to the high buffering capacity of the system. This is in accordance with earlier study by Wet- zel [15], who reported that the pH values of Indian wa- ters ranges from 8 to 9 units. Ghose and Sharma [16] in their study of the Ganga River recorded relatively high pH of water in winter months attributing to increased primary-productivity in which carbonates, sulfate, ni- trates and phosphates are converted to hydroxyl ions. In the present investigation the pH of soil samples were observed to be high in dry seasons (average 8.81) and lower during monsoon (average 8.13). The low pH was mainly due to high turbidity and dilution. The variation in pH of the soil samples is graphically represented in Figure 2. The measurement of soil water content and soil water fluxes is critical to a wide range of environmental studies including acidification, pollution and nutrient uptake [17]. There is a major current concern in the effective conser- vation and protection of water, and this interest is likely to increase with attention being focused on the effects of climate change. As a consequence, soil water content is an important component in many modeling studies, e. g. in calculation of evapotranspiration, and in estimation of losses to groundwater [17]. The % moisture content is soil samples collected for different seasons were found to be low in dry seasons (average 3.84%) and increases sharply during wet season (average 4.02%) starting from June to August. The variation in % moisture content of the soil samples is graphically represented in Figure 2. Bulk density is a measure of the weight of the soil per unit volume (g/cm3), usually given on an oven-dry (110℃) basis. Variation in bulk density is attributable to the rela- tive proportion and specific gravity of solid organic and inorganic particles and to the porosity of the soil. Al- though bulk densities are seldom measured, they are im- portant in quantitative soil studies. In the present inves- tigation the bulk density of soil was found to increase gradually in dry seasons (average 0.725 g/cm3) and then decreases sharply in rainy season (average 0.531 g/cm3). The increase in bulk density of soil samples in dry sea- sons might be due to concentration of heavy metals, which are washed out in rainy season in to the creek wa- ter resulting in decrease in bulk density. The variation in bulk density of the soil samples is graphically repre- sented in Figure 2. The conductivity of soil depends upon the concentra- tion of ions and its nutrient status. In the present investi- gation the electrical conductivity values of soil samples varies between averages of 4.83 m.mhos/cm in dry sea- sons, to 4.08 m.mhos/cm in rainy season. Washing of soil due to rain water results in removal of conducting ions present in the soil as a result conductivity values de- creases. The variation in conductivity of the soil samples is graphically represented in Figure 2. Alkalinity and pH are the factors responsible for de- termining the amenability of water to biological treat- ment [18]. Total alkalinity values in our observations fluctuated from average of 19.0 to 20.1 mg/L. In the pre- sent investigation alkalinity of soil samples increases gradually in dry seasons, followed by steep fall in the monsoon season. The low alkalinity during the monsoon may be due to dilution. Bishop [19] and Jain et al. [20], also reported similar findings in their study on Malayan Table 1. Seasonal variation in physico-chemical parameters in soil samples collected from Kalwa bridge of Thane Creek Months Average Decem- ber 2007 January 2008 Febru- ary 2008 March 2008 April 2008 May 2008 June 2008 July 2008 August 2008 Parameters Dry Seasons Rainy Season Dry sea- sons Rainy season Bulk density g/cm3 0.598 0.658 0.665 0.700 0.855 0.872 0.519 0.545 0.530 0.725 0.531 Moisture content % 3.80 3.83 3.87 3.86 3.85 3.84 3.92 4.03 4.10 3.84 4.02 pH 8.92 8.94 8.91 8.53 8.73 8.82 8.10 8.11 8.18 8.81 8.13 Electrical conductivity m.mh o s/cm 6.53 5.02 4.84 4.15 4.20 4.27 4.08 4.10 4.07 4.83 4.08 Alkalinity mg/ L 12.2 17.1 20.6 22.1 23.3 25.2 21.9 19.1 16.0 20.1 19.0 Chlorinity mg/ L 25 27 30 32 36 35 27 22 20 31 23 Copyright © 2010 SciRes. JEP 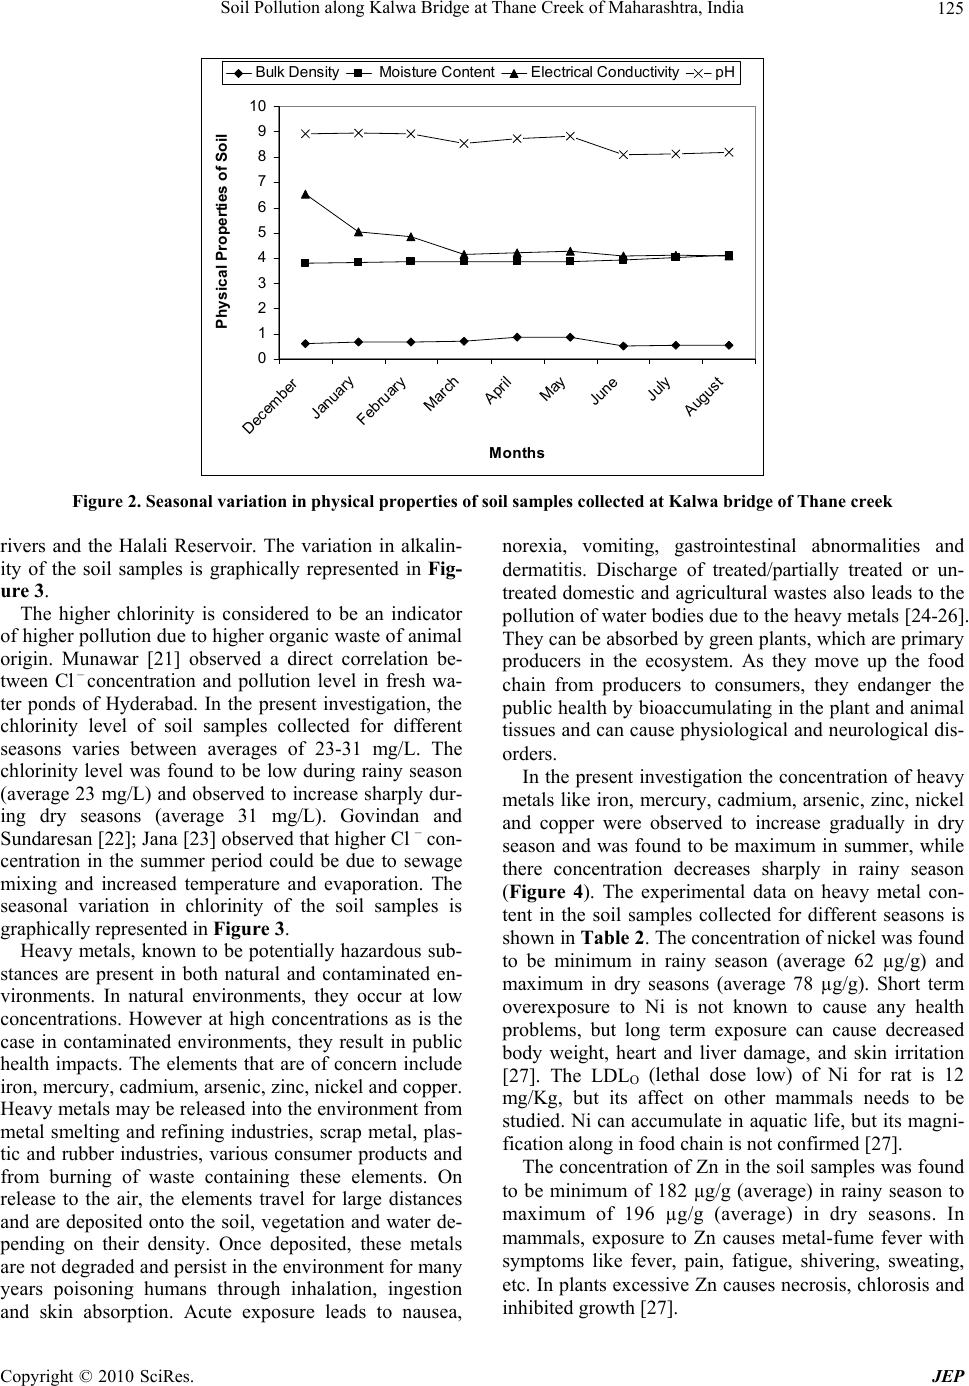 Soil Pollution along Kalwa Bridge at Thane Creek of Maharashtra, India125 0 1 2 3 4 5 6 7 8 9 10 December January February March April May June July August Months Physical Properties of Soil Bulk Density Moisture ContentElectrical ConductivitypH Figure 2. Seasonal variation in physical properties of soil samples collected at Kalwa bridge of Thane creek rivers and the Halali Reservoir. The variation in alkalin- ity of the soil samples is graphically represented in Fig- ure 3. The higher chlorinity is considered to be an indicator of higher pollution due to higher organic waste of animal origin. Munawar [21] observed a direct correlation be- tween Cl – concentration and pollution level in fresh wa- ter ponds of Hyderabad. In the present investigation, the chlorinity level of soil samples collected for different seasons varies between averages of 23-31 mg/L. The chlorinity level was found to be low during rainy season (average 23 mg/L) and observed to increase sharply dur- ing dry seasons (average 31 mg/L). Govindan and Sundaresan [22]; Jana [23] observed that higher Cl – con- centration in the summer period could be due to sewage mixing and increased temperature and evaporation. The seasonal variation in chlorinity of the soil samples is graphically represented in Figure 3. Heavy metals, known to be potentially hazardous sub- stances are present in both natural and contaminated en- vironments. In natural environments, they occur at low concentrations. However at high concentrations as is the case in contaminated environments, they result in public health impacts. The elements that are of concern include iron, mercury, cadmium, arsenic, zinc, nickel and copper. Heavy metals may be released into the environment from metal smelting and refining industries, scrap metal, plas- tic and rubber industries, various consumer products and from burning of waste containing these elements. On release to the air, the elements travel for large distances and are deposited onto the soil, vegetation and water de- pending on their density. Once deposited, these metals are not degraded and persist in the environment for many years poisoning humans through inhalation, ingestion and skin absorption. Acute exposure leads to nausea, norexia, vomiting, gastrointestinal abnormalities and dermatitis. Discharge of treated/partially treated or un- treated domestic and agricultural wastes also leads to the pollution of water bodies due to the heavy metals [24-26]. They can be absorbed by green plants, which are primary producers in the ecosystem. As they move up the food chain from producers to consumers, they endanger the public health by bioaccumulating in the plant and animal tissues and can cause physiological and neurological dis- orders. In the present investigation the concentration of heavy metals like iron, mercury, cadmium, arsenic, zinc, nickel and copper were observed to increase gradually in dry season and was found to be maximum in summer, while there concentration decreases sharply in rainy season (Figure 4). The experimental data on heavy metal con- tent in the soil samples collected for different seasons is shown in Table 2. The concentration of nickel was found to be minimum in rainy season (average 62 µg/g) and maximum in dry seasons (average 78 µg/g). Short term overexposure to Ni is not known to cause any health problems, but long term exposure can cause decreased body weight, heart and liver damage, and skin irritation [27]. The LDLO (lethal dose low) of Ni for rat is 12 mg/Kg, but its affect on other mammals needs to be studied. Ni can accumulate in aquatic life, but its magni- fication along in food chain is not confirmed [27]. The concentration of Zn in the soil samples was found to be minimum of 182 µg/g (average) in rainy season to maximum of 196 µg/g (average) in dry seasons. In mammals, exposure to Zn causes metal-fume fever with symptoms like fever, pain, fatigue, shivering, sweating, etc. In plants excessive Zn causes necrosis, chlorosis and inhibited growth [27]. Copyright © 2010 SciRes. JEP  Soil Pollution along Kalwa Bridge at Thane Creek of Maharashtra, India 126 Table 2. Seasonal variation in heavy metal content in the soil samples collected from Kalwa bridge of Thane Creek Months Average December 2007 January 2008 February 2008 March 2008 April 2008 May 2008 June 2008 July 2008 Au- gust 2008 Metal Dry Seasons Rainy Season Dry Sea- sons Rainy Sea- son Ni µg/g 70 70 75 80 85 90 65 60 60 78 62 Zn µg/g 190 185 190 200 200 210 185 180 180 196 182 Cd µg/g 10 10 15 20 30 38 10 8 5 21 8 Cu µg/g 115 115 117 120 126 130 105 105 110 121 107 Fe % 7.55 7.55 7.60 7.75 7.76 7.82 7.40 7.40 7.42 7.67 7.41 As µg/g 235 232 230 260 280 280 220 228 235 253 228 Hg µg/g 20 24 25 30 30 40 10 10 8 28 9 0 5 10 15 20 25 30 35 40 December January Februar y March April May June July Augus t Months Chemical Properties of Soil (mg/L) Alkalinity Chlorinity Figure 3. Seasonal variation in chemical properties of soil samples collected at Kalwa bridge of Thane creek 0 50 100 150 200 250 300 December January February March Apri l May June July August Months Heavy Metal content 7.1 7.2 7.3 7.4 7.5 7.6 7.7 7.8 7.9 Fe content (%) Ni Zn Cd Cu As Hg Fe (μg/g) Figure 4. Seasonal variation in heavy metal content in the soil samples collected at Kalwa bridge of Thane creek Copyright © 2010 SciRes. JEP  Soil Pollution along Kalwa Bridge at Thane Creek of Maharashtra, India 127 Cadmium is contributed to the surface waters through paints, pigments, glass enamel, deterioration of the gal- vanized pipes etc. The wear of studded tires has been identified as a source of cadmium deposited on road sur- faces. The concentration of Cd was minimum in rainy season (average 8 µg/g) to maximum in dry seasons (av- erage 21 µg/g).There are a few recorded instances of Cd poisoning in human beings following consumption of contaminated fishes. It is less toxic to plants than Cu, similar in toxicity to Pb and Cr. It is equally toxic to in- vertebrates and fishes [28]. anemia, liver damage, portal cirrhosis, hematopoietic depression, anhydremia, sensory disturbance and weight loss. In addition to acute toxicity, long-term exposure to inorganic arsenic is associated with certain forms of can- cer of the skin, lung, colon, bladder, liver and breast [32]. A few years back, high concentrations of this element was found in drinking water in six districts in West Ben- gal. A majority of people in the area was found suffering from arsenic skin lesions. Arsenic poisoning through wa- ter can cause liver and nervous system damage, vascular diseases and also skin cancer. Arsenic poisoning has be- come a worldwide public health concern. The skin is quite sensitive to arsenic and skin lesions are the most common and earliest nonmalignant effects associated to chronic arsenic exposure [33]. In the present case study, the concentration of arsenic was observed to vary from minimum of 228 µg/g in rainy season to maximum of 253 µg/g in dry seasons. Copper salts are used in water supply systems to con- trol biological growth in reservoirs and distribution pipes. The municipal waste and sewage, corrosion of Cu con- taining pipelines or fittings are the principal anthropo- genic source of Cu. Highly toxic to most fishes, inverte- brates and aquatic plants than any other heavy metal ex- cept mercury. It reduces growth and rate of reproduction in plants and animals [28]. Copper becomes toxic for organisms when the rate of absorption is greater than the rate of excretion. Further since the copper is readily ac- cumulated by plants and animals, and the aquatic plants absorb three times more Cu than plants on dry land [29], it is very important to minimize the levels of copper in the waterway. The concentration of Cu was observed to be minimum in rainy season (average 107 µg/g) to maximum in dry seasons (average 121 µg/g). In the present investigation it was observed that the concentration of Fe was very high in dry seasons (aver- age 7.67%) and decreases sharply in rainy season (aver- age 7.41%). It is important here to note that the high concentration of Fe may increase the hazard of pathogenic organisms, since most of these organisms need iron for their growth [27]. The seasonal variations in % Fe content of the soil samples collected along the Kalwa bridge of Thane Creek is graphically represented in Figure 4. The acute lethal dose for most inorganic mercury compounds for an adult is 1-4 g (or 14 to 57 mg/Kg) for a 70 Kg person [34]. Exposure to mercury and its com- pounds therefore can have acute adverse health problems. It may permanently damage the brain, kidneys and de- veloping foetus. Effects on brain functioning may results in irritability, tremors, changes in vision or hearing, and memory problems. In aquatic plants mercury compounds inhibit cell growth and impair permeability. In the present investigation the concentration of Hg was observed to be very high. It increases gradually in dry seasons (average 28 µg/g), and falls sharply during rainy season (average 9 µg/g). 4. Conclusions The experimental data on the soil pollution status along the Kalwa bridge of Thane creek suggest a need to im- plement common objectives, compatitable policies and programmes for improvement in the industrial waste wa- ter treatment methods. The high level of pollution along the creek area also suggest a need of consistent, interna- tionally recognized data driven strategy to assess the quality of aquatic body and generation of international standards for evaluation of contamination levels. If the present conditions continue for a long period, the Thane creek area may soon become ecologically inactive. Arsenic occurs naturally or is possibly aggravated by over powering aquifers and by phosphorus from fertiliz- ers. Human activities have also intensified arsenic accu- mulation in the environment. Arsenic usually accumu- lates in soil, water and airborne particles, from which it is taken up by various organisms. The concentrations of the dangerous inorganic arsenics that are currently present in surface waters enhance the chances of alteration of ge- netic materials of fish. This is mainly caused by accumu- lation of arsenic in the bodies of plant-eating freshwater organisms. Plants absorb arsenic fairly easily, so that high-ranking concentrations may be present in food. High concentrations of arsenic in water can have an adverse effect on health [30,31]. Organs most susceptible to arse- nic toxicity are those involved with absorption, accumu- lation or excretion, including the skin, circulatory system, gastrointestinal tract, liver and kidney. Arsenic is associ- ated with multiple health effects, including Blackfoot diseases, diabetes, hypertension, peripheral neuropathy and multiple vascular diseases. Other effects include REFERENCES [1] N. I. Ward, “Environmental Analytical Chemistry,” In: F. W. Fifield and P. Haines, Eds., Journal of Trace Elements, Blackie Academic and Professional, UK, 1995, pp. 320-328. [2] R. K. Sharma, M. Agrawal and F. M. Marshall, “Effects of Waste Water Irrigation on Heavy Metal Accumulation in Soil and Plants,” Paper presented at a National Seminar, Bangalore University, Bangalore, 2004, No. 7, p. 8. [3] R. S. Lokhande and N. Kelkar, “Studies on Heavy Metals in Water of Vasai Creek, Maharashtra,” Indian Journal of Environmental Protection, Vol. 19, No. 9, 1999, pp. 664-668. Copyright © 2010 SciRes. JEP  Soil Pollution along Kalwa Bridge at Thane Creek of Maharashtra, India Copyright © 2010 SciRes. JEP 128 [4] J. Johansson and L. Rasmussen, “Retrospective Study (1944-1976) of Heavy Metals in the Epiphyte Pterogo- nium Gracile Collected from One Phorophyte,” Bryolo- gist, Vol. 80, No. 4, 1977, pp. 625-629. [5] D. Patil, “A Lot's Fishy about our Creek and Lake Fish,” Daily Times of India, 22 March 2009. [6] A. Aghor, “Chemicals Make Thane Creek the Worst Polluted Waterbody,” Daily DNA, 14 August 2007. [7] S. K. Jha, T. M. Krishnamoorthy, G. G. Pandit and K. S. V. Nambi, “History of Accumulation of Mercury and Nickel in Thane Creek, Mumbai, Using 210Pb Dating Technique,” Science of the Total Environment, Vol. 236, No. 1-3, 1999, pp. 91-99. [8] S. K. Jha, S. B. Chavan, G. G. Pandit, B. S. Negi and S. Sadasivan, “Behaviour and Fluxes of Trace and Toxic Elements in Creek Sediment Near Mumbai, India,” Envi- ronmental Monitoring and Assessment, Vol. 76, No. 2, 2002, pp. 249-262. [9] S. K. Sahu, P. Y. Ajmal, G. G. Pandit and V. D. Puranik, “Vertical Distribution of Polychlorinated Biphenyl Con- geners in Sediment Core from Thane Creek Area of Mumbai, India,” Journal of Hazardous Materials, Vol. 164, No. 2-3, 2009, pp. 1573-1579. [10] M. Chen and L. Q. Ma, “Comparison of Three Aqua Regia Digestion Methods for Twenty Florida Soils,” Soil Science Society of America Journal, Vol. 65, 2001, pp. 491-499. [11] L. S. Clesceri, “Standard Methods for the Examination of Water and Waste Water,” In: A. E. Greenbergy and A. D. Eaton, Eds., Collection and Preservation of Samples and Metals, APHA, AWWA, WEF, Washington, D.C., pp. 1-27–1-35; 3-1–3-21, 1998. [12] A. Paar, “Microwave Sample Preparation System—Instruction Handbook,” Anton Paar GmbH, Austria, 1998, p. 128. [13] M. L. Jackson, “Soil Chemical Analysis,” Prentice-Hall of India Private Limited, New Delhi, 1973. [14] W. R. Hatch and W. L. Ott, “Determination of Submicro- gram Quantities of Mercury by Atomic Absorption Spec- trophotometry,” Analytical Chemistry, Vol. 40, 1968, pp. 2085-2087. [15] R. G. Wetzel, Limnology, W. B. Saunders Company, Philadelphia, U.S.A., 1975, p. 743. [16] N. C. Ghose and C. D. Sharma, “Effect of Drain Water on the Physico-Chemical and Bacteriological Characteristic of River Ganga at Patna, Bihar,” In: R. K. Trivedy, Ed., Ecology and Pollution of Indian Rivers, Asian Publishing House, New Delhi, 1988, pp. 255-269. [17] G. J. Gaskin and J. D. Miller, “Measurement of Soil Wa- ter Content Using a Simplified Impedanc Measuring Technique,” Journal of Agricultural Engineering Research, Vol. 63, 1996, pp. 153-160. [18] N. Manivasakam, “Physico-Chemical Examination of Water, Sewage and Industrial Effluents,” Pragati Praka- shan, Meerut, 1980. [19] J. E. Bishop, “Limnology of Small Malayan River, Sungai Gomback,” Dr. W. Junk Publishers, The Hague, 1973. [20] S. M. Jain, M. Sharma and R. Thakur, “Seasonal Varia- tions in Physico-Chemical Parameters of Halai Reservoir of Vidisha District, India,” Indian Journal of Ecobiology, Vol. 8, No. 3, 1996, pp. 181-188. [21] M. Munawar, “Limnological Studies of Fresh Water Ponds of Hyderabad, India 1. The Biotype,” Hydrobiolo- gia, Vol. 35, No. 1, 1970, pp. 127-162. [22] V. S. Govindan and B. B. Sundaresan, “Seasonal Succe- ssion of Algal Flora in Polluted Region of Adyar River,” Indian Journal of Environment and Health, Vol. 21, No. 2, 1979, pp. 131-142. [23] B. B. Jana, “Seasonal Periodicity of Plankton in Fresh Water Ponds, West Bengal, India,” Internationale Revue der Gesamten Hydrobiologie, Vol. 58, 1973, pp. 127-143. [24] S. Pophali, S. Siddiqui and L. H. Khan, “Sources and Distri- bution of Heavy Metals in the Abiotic Components of a Pol- luted Urban Stream in Bhopal,” Indian Journal of Environ- mental Protection, Vol. 10, No. 8, 1990, pp. 600-603. [25] G. Dayal and R. P. Singh, “Heavy Metal Content of Mu- nicipal Solid Waste in Agra, India,” Pollution Research, Vol. 13, No. 1, 1994, pp. 83-87. [26] S. Jain and S. Salman, “Heavy Metal Concentration in Highly Eutrophic Lake Sediments and Overlying Water,” Pollution Research, Vol. 14, No. 4, 1995, pp. 471-476. [27] Environmental Information System, Heavy Metal Pollu- tion in Punjab Rivers, Vol. 3, No. 1, April-June 2005. [28] J. W. Moore and S. Ramamoorthy, “Heavy Metals in Natural Waters: Applied Monitoring and Impact Assess- ment,” Springer-Verlag, New York, 1984, pp. 28-246. [29] Centre for Ecological Sciences, IISc, “Compendium of Environmental Standards,” Documentation on Monitoring and Evaluating Environmental Impacts, Indian Institute of Science, Bangalore, Vol. 3, 2001. http://wgbis.ces.iisc. ernet.in/ energy/HC270799/HDL/ENV/START.HTM [30] L. Cai, G. Liu, C. Rensing and G. Wang, “Genes Involved in Arsenic Transformation and Resistance Associated with Different Levels of Arsenic-Contaminated Soils,” BMC Microbiology, Vol. 9, No. 4, 2009. [31] D. Pokhrel, B. S. Bhandari and T. Viraraghavan, “Arsenic Contamination of Groundwater in the Terai Region of Nepal: An Overview of Health Concerns and Treatment Options,” Environment International, Vol. 35, No. 1, 2009, pp. 157-161. [32] T. G. Kazi, M. B. Arain and J. A. Baig, “The Correlation of Arsenic Levels in Drinking Water with the Biological Samples of Skin Disorders,” The Science of the total en- vironment, Vol. 407, No. 3, 2009, pp.1019-1026. [33] B. C. Gbaruko, G. R. E. E. Ana and J. K. Nwachukwu, “Ecotoxicology of Arsenic in the Hydrosphere: Implica- tions for Public Health,” African Journal of Biotechnol- ogy, Vol. 7, No. 25, 2008, pp. 4737-4742. [34] Agency for Toxic Substances and Disease Registry (ATSDR): Case Studies in Environmental Medicine. Mercury Toxicity. US Public Health Service, U.S. De- partment of Health and Human Services, Atlanta, GA, 1992. |