 Open Journal of Applied Sciences, 2012, 2, 70-77 doi:10.4236/ojapps.2012.22009 Published Online June 2012 (http://www.SciRP.org/journal/ojapps) Synthesis and Characterisations of TiO2 Coated Multiwalled Carbon Nanotubes/Graphene/Polyaniline Nanocomposite for Supercapacitor Applications Debasis Ghosh1, Soumen Giri1, Swinderjeetsingh Kalra2, Chapal Kumar Das1* 1Materials Science Centre, Indian Institute of Technology Kharagpur, Kharagpur, India 2Department of Chemistry, Dayanand Anglo-Vedic (D.A.-V.) College, Kanpur, India Email: *chapal12@yahoo.co.in Received March 27, 2012; revised April 26, 2012; accepted May 5, 2012 ABSTRACT Nowadays with ever increasing demand of energy, developing of alternative power sources is an important issue all over the world. In this respect we have prepared nanocomposites based on metal oxide (titanium oxide) coated multi- walled carbon nanotubes (MWCNTs)/polyaniline (PANI) with graphene and without graphene and studied their elec- trochemical performance. The formation of the polymer in the nanocomposites was confirmed by the Fourier Transform Infrared Spectroscopy (FTIR) study. The morphological characterisations were carried out by the Field Emission Scan- ning Electron Microscopy (FESEM) and Transmission Electron Microscopy (TEM). To characterize the prepared nanocomposites electrode, a cyclic voltammetry test for measuring specific capacitance, and an impedance test were conducted. The highest value of specific capacitance obtained for the TiO2 coated MWCNTs/PANI nanocomposite was 443.57 F/g at 2 mV/s scan rate. Upon addition of graphene nanosheet to the TiO2 coated MWCNTs in a weight ratio of (9:1) the specific capacitance value increased to 666.3 F/g at the same scan rate, also resulting in an increase in energy density and power density. Keywords: Supercapacitors; Polyaniline; Nanocomposites; Graphene Nanosheet 1. Introduction Supercapacitors, also known as electrochemical capaci- tors or ultracapacitors are of interest in terms of their high energy density and high power density as well as pollution free long term energy supply source. Conven- tional capacitor has the property of high power density but suffers from low energy density, whereas, conven- tional battery has got the property of high energy density but low power density. Supercapacitors form a bridge between the two by combining the high energy density and high power delivery status. Supercapacitors store energy either by the formation of electrical double layer at the electrode electrolyte interface, typically known as Electric Double Layer Capacitor (EDLC) or by the pseudocapacitance mechanism or by both. The charge storage mechanism in EDLC is non-faradaic i.e. no elec- tron transfer reaction occurs and the process is directly electrostatic [1]. EDLC increases the rate of response but suffers from comparatively less amount of charge storage. In case of redox supercapacitor, the active species un- dergoes fast and reversible oxidation and reduction. The pseudocapacitance, which ar due to electron transfer ises redox process, causes typically 10 times greater charge storage comparable to that of EDLC. Typically, designing of a supercapacitor requires three essential components, the electrodes, the electrolyte and the separator. The su- percapacitor electrode plays the role of charge stor- age/delivery and determines energy density and power density [2]. For the supercapacitor electrode materials, carbon materials, conducting polymer and metal oxides are mostly used [3]. Carbon materials such as activated carbon, nano porous carbon materials were used previ- ously but now these are replaced mostly by CNT and graphene. The charge storage mechanism in pristine CNT is due to electrical double layer formation and it has got very good absorption characteristic due to the acces- sible mesopores formed by the entangled individual CNTs [4]. However the specific capacitance of pristine CNT is low and due to their bundle structure, their effect- tive surface area decreases. This results in their restricted use in many devices. Graphene is an outstanding material for supercapacitor electrode owing to its very high sur- face area (2675 m2/g), high thermal conductivity, ex- treme electrical conductivity and very high mechanical strength. Use of metal oxide as electrode materials such *Corresponding author. Copyright © 2012 SciRes. OJAppS  D. GHOSH ET AL. 71 as RuO2, MnO2, SnO2, NiO [5-8] have been studied in detail. The combination of CNT or graphene with the metal oxide also has been investigated in the recent years. A. L. M. Reddy and S Ramaprabhu obtained specific ca- pacitance of 138 and 93 F/g for RuO2/MWNT and SnO2/ MWNT nanocomposite electrodes respectively [9]. For the graphene metal oxide nanocomposites, Cheng et al. obtained a specific capacitance of 328 F/g for MnO2/ graphene at 1mA charging current [10], whereas, Wang et al reported high specific capacitance of 855 F/g for Ni(OH)2/graphene nanocomposites at 5mV/s scan rate and 367 F/g for RuO2/graphene at 2 mV/s scan rate [11]. Conducting polymers such as, polypyrrole, polyaniline (PANI), polythiophene are used as another part of elec- trode material. Among the various conducting polymers, PANI has been studied extensively due to its low cost, easy synthesis procedure, redox reversibility as well as good environmental stability and moderated electrical conductivity [1,12]. Graphene or CNT combines with the conducting polymer and stores energy by the electronic and ionic charge separation as well as by the faradaic charge transfer across the electrode electrolyte interface [1,13-16]. CNT and graphene have free surface pi-elec- trons. The surface pi-electrons can interact strongly with PANI through the quinoid ring and thereby facilitate the functionalization of CNT and graphene. LI. Fang et al. found a specific capacitance of 305.3 F/g for CNT/PANI composite with a 50 nm thick coating of PANI over CNT. Similarly, L. B. Kong et al. obtained the highest specific capacitance value of 224 F/g for the MWCNTs/PANI nanocomposite materials containing MWCNTs of 0.8 wt% [17]. In case of graphene based PANI composites A. V. Murugan reported highest specific capacitance of 408 F/g for (1:1) weight of PANI and graphene [18]. TiO2 is a non-toxic, low cost transition metal oxide and available in abundance. Various composite materials for superca- pacitor applications containing TiO2 have been investi- gated in detail. Reddy et al. obtained a specific capaci- tance of 166 F/g for TiO2/MWCNTs nanocrystalline com- posite by chemical reduction method [9]. C. Bian et al. studied the fibriform polyaniline/nano-TiO2 composite containing 80% conducting polyaniline by mass which showed maximum specific capacitance of 330 F/g at a constant current density of 1.5 A/g [19]. Further, A. K. Mishra and S. Ramaphrabu found a maximum specific capacitance of 265 F/g for TiO2 decorated functionalised graphene [20]. However in our present work, we have prepared three nanocomposites based on MWCNTs/PANI, TiO2-MWCNTs/PANI and graphene/TiO2-MWCNTs/PANI, where the composition of graphene: TiO2-MWCNTs is 9:1 by weight. The samples have been prepared by in situ oxidative polymerisation method and their efficiency as supercapacitor electrode material has been studied exten- sively. 2. Experimental 2.1. Apparatus and Reagents MWCNTs were obtained from Iljin Nano Technology, Korea, (95% purity and 20 - 40nm diameter). Graphene was obtained from Sinocarbon Materials Technology Co. Ltd. China. Ammonium persulphate (APS), Cetyltrime- thylammoniumbromide (CTAB) were supplied by Loba- Chemie Pvt. Ltd. Mumbai (India). Aniline was obtained from E. Merck Ltd. (India). Titanium(IV) n-butoxide and iso-propanol were purchased from Sigma Aldrich. All the chemicals were used without any further purification. 2.2. Preparation of Nanocomposites Titanium oxide (TiO2) coated MWCNTs have been syn- thesised by following a sol-gel process, already reported by Siu-Ming Yuen et al. [21]. In brief, MWCNTs were dispersed in iso-propanol and it was followed by addition of Titanium(IV) n-butoxide and distilled water in a weight ratio of MWCNT:titanium(IV) n-butoxide:iso-propanol: water (1:0.3:50:25). The whole reaction mixture was kept at room temperature for 48 hours and then the isopropa- nol was evaporated by heat treatment to obtain TiO2 coated MWCNTs. Nanocomposites based on unmodified MWCNTs/PANI and TiO2 modified MWCNTs/PANI were prepared by insitu oxidative polymerisation of ani- line, reported elsewhere. 60 mg MWCNTs were dispersed in water by using cetyltrimethyl ammonium bromide (CTAB) as dispersing agent by ultrasonication for 30 minutes using ultrasonic processor, Sonapros PR-250. To that suspension, 0.6 ml aniline monomer was added and sonicated for further 10 minutes. Subsequently, ammo- nium persulphate (APS) solution containing 2.04 gm APS was added and the sonication was continued for another 20 minutes. Then the whole suspension was kept at 0˚C - 5˚C for 12 hours, filtered and washed with water ethanol solution to remove the unreacted monomer and the residue was dried to get MWCNTs/PANI nanocom- posites. The same procedure was followed for the TiO2- MWCNTs/PANI and graphene/TiO2-MWCNT/PANI com- posites preparation. For preparation of the graphene/TiO2- MWCNTs/PANI nanocomposites, the weight ratio ini- tially taken for the graphene to TiO2-MWCNTs was (9:1). 2.3. Fabrication of Electrode For fabrication of the electrode for electrochemical char- acterisations the nanocomposites were dispersed in 1% nafion solution via sonication. The nafion solution was prepared by mixing 10 µl nafion in 1ml dehydrated ethanol. The well dispersed samples were casted onto the glassy carbon (GC) electrode surface (diameter –3 mm) and completely dried in air. Here the GC electrode acted as working electrode. Copyright © 2012 SciRes. OJAppS  D. GHOSH ET AL. 72 3. Results and Discussion 3.1. Fourier Transform Infrared Spectroscopy (FTIR) Study FTIR of the MWCNTs and graphene based nanocompo- sites was performed using a NEXUS 870 FTIR (Thermo Nicolet) to investigate the formation of PANI in presence of TiO2 coated MWCNTs and TiO2 coated CNT/graphene nanocomposites and the plot is shown in Figure 1. The peak at 1575 cm–1 indicates the C=C stretching fre- quency of the quinoid ring of the PANI unit, whereas the peak at 1464 cm–1 indicates the C=C stretching of the benzenoid ring [22] that shifts to 1485 cm–1 for the gra- phene/TiO2-MWCNTs/PANI. The peaks at 1299 cm–1 and 801 cm–1 denote the C-N stretching and C-C or C-H stretching of benzenoid unit. The peak at 3433 cm–1 can be attributed to the N-H stretching frequency [23]. For the TiO2 coated MWCNTs/graphene/PANI composite the peak gets broadened near 3435 cm–1 probably due to some moisture absorption thereby O-H stretching fre- quency contributing to some extent. The peaks at 2855 cm–1 and 2923 cm–1 are associated with the symmetric and asymmetric vibrations of C-H bond [23,24]. All these FTIR data indicate the formation of PANI for both the composites. The peak at 608 cm–1 indicates the Ti-O stretching frequency of the TiO2 unit thus confirming the formation of TiO2 over MWCNT [25]. 3.2. XRD Analysis The modification of MWCNTs surface by TiO2 was con- firmed by the XRD analysis using a Rigaku difractome- ter with a Cu Kα radiation (λ = 1.54056 cm–1). Figure 2 shows the XRD pattern of pure MWCNTs, TiO2 coated MWCNTs and graphene/TiO2-MWCNTs/PANI nano- composite. For pure MWCNTs, the strong and sharp Figure 1. FTIR of TiO2-MWCNTs/PANI and graphene/TiO2- MWCNTs/PANI. diffraction peak at 26˚ corresponds to (022) reflections of MWCNTs. In case of TiO2 coated MWCNTs, additional peaks appear at scattering angles 25.36˚, 37.95˚, 48.12˚, 53.98˚, 55.12˚ and 62.75˚ corresponding to the reflec- tions from (101), (004), (200), (105), (211), (204) crys- talline plane respectively [26]. This indicates the crystal- line nature of the TiO2 coated MWCNTs. However in case of the composite, the corresponding peak at 25.24˚, which is a characteristic peak of pure PANI is absent which means that most of the PANI is deposited on the surface of the TiO2 coated MWCNTs [19]. This is an advantage as it shortens the diffusion path of the electro- lyte and provides a larger electrochemical surface. 3.3. Morphological Characterizations The surface morphologies of the as prepared nanocom- posites were analysed by FESEM using Carl Zeiss-SU- PRATM 40 with an accelerating voltage of 5 kV. The samples were first gold coated to make the surface well conducting. Figures 3(a)-(c) represent the FESEM im- ages of pristine MWCNTs, graphene and neat PANI. The FESEM image gives the evidence of smooth surface of the pristine MWCNTs and graphene. The FESEM im- ages of the TiO2-MWCNTs/PANI and graphene/TiO2- MWCNTs/PANI nanocomposites are shown in Figures 3(d) and (e) which show a uniform coating of the PANI over the as prepared TiO2 modified MWCNTs surface which makes the surface rough. For further analysis, transmission electron microscopy (TEM) was carried out by using TECNAI G2-20S-TWIN inorder to inspect the extent of dispersion of the in situ formed PANI in the nanocomposites. For the TEM analysis the samples were well dispersed in acetone and a drop was placed on a copper grid and dried in air. Samples subjected to both FESEM and TEM analyses were prepared at room tem- Figure 2. XRD pattern of MWCNTS, TiO2 coated MWCNTs and graphene/TiO2-MWCNTs/PANI. Copyright © 2012 SciRes. OJAppS  D. GHOSH ET AL. Copyright © 2012 SciRes. OJAppS 73 3.4. Electrochemical Characterizations perature. Figures 4(a)-(c) represent the TEM images of neat MWCNTs, neat graphene and neat PANI. The TEM image of TiO2 coated MWCNTs is shown in Figure 4(d). The presence of TiO2 makes the MWCNTs surface rough. Figure 4(e) represents the TEM image of graphene/TiO2- MWCNTs/PANI. From the picture, it is clear that PANI is uniformly coated onto the TiO2-MWCNTs and Graphene surface and forms a sandwiched structure in the nano- composite. Electrochemical characterisations such as Cyclic Volt- ammetry (CV) and Electrochemical Impedance Spec- troscopy (EIS) of the prepared nanocomposites were car- ried out by GAMRY Ref 3000 instrument by using a three electrode system where platinum and saturated calomel electrode (SCE) were used as counter and refer- ence electrodes respectively. For the electrochemical characterizations potential window was chosen from Figure 3. FESEM image of (a) neat MWCNTs; (b) Graphene; (c) Neat PANI; (d) TiO2-MWCNTs/PANI and (e) Graphene/ TiO2-MWCNTs/PANI. Figure 4. TEM image of (a) MWCNTs; (b) Graphene; (c) Pure PANI; (d) TiO2 coated MWCNTs and (e) Graphene/ TiO2- MWCNTs/PANI (SAED image is shown in inset).  D. GHOSH ET AL. 74 –0.7 V to +0.7 V) under which the nanocom(posites Specific capacitance: showed excellent electrochemical behaviour and the elec- trolyte used was 1 M KCl. The specific capacitance (Cs in F/g) of the nanocomposites from the CV measurement are calculated by using the following equation [27]. 2 d V IVV 1 21 V s Cm VV (1) where, I(V) is the instantaneous current in CV, under the I-V curve, ν is the scan rate (V/s), (V2 – V1) is the potential window and m is However, the better activity of the TiO2-MWCNTs/PANI 2 V 1 d V IVV is the area the mass of the electroactive material. Figure 5(a) repre- sents the CV plots of MWCNTs/PANI, TiO2-MWCNTs/ PANI and graphene/TiO2-MWCNTs/PANI composites at 10 mV/s scan rate which showed specific capacitance respectively, 114 F/g, 158.09 F/g, and 269.46 F/g. The highest specific capacitance value obtained for the TiO2-MWCNTs/PANI composite was 443.57 F/g at 2 mV/s scan rate. Upon addition of graphene at a weight percentage of (9:1) to that of TiO2 coated MWCNTs, the specific capacitance value increases tremendously. The highest specific capacitance obtained for the nanocom- posite, graphene/TiO2-MWCNTs/PANI was 666.3 F/g at 2 mV/s scan rate. For MWCNTs/PANI composite the combination of MWCNTs and PANI shows superior performance than the individual component (already re- ported) possibly due to the combination of easy electro- lyte accessibility and a reduction in diffusion distance. is due to the better synergism between the PANI and the TiO2modified MWCNTs surface. TiO2 is an n-type semi- conductor and the surface charge is more than the other region due to the effective contribution of the positively charged depletion region [28]. Incorporation of graphene causes an increase in the surface area on which PANI can grow. This improves the area of contact with the electro- lyte and an improved conductivity in the redox pseudo- capacitive composite structure results in an increased su- percapacitance. The CV plot of graphene/TiO2-MWCNTs/ PANI at various scan rates are given in Figure 5(b). The non-rectangular nature of the CV curve and presence of peaks at low scan rate indicate deviation from ideal be- haviour and the considerable contribution of pseudoca- pacitance to the total specific capacitance. The pseudo- capacitance can arise due to both TiO2 and PANI. Figure 5(c) represents the variation of specific capacitance with scan rate for the two composites. The energy density and power density of the composites are calculated by using the following equations [29] Energy density 2 12 s ECV (2) Power density PET where Cs (3) is the specific capacitance in F/g, V is the oper- ating voltage range in Volt and T is the discharge time. The highest value of energy density for TiO2-MWCNTs/ PANI and graphene/TiO2-MWCNTs/PANI was respect- tively 120.75 Wh/kg and 181.3 Wh/kg at 2 mV/s scan rate whereas highest power density was respectively 3152 W/kg and 5142.85 W/kg at 200 mV/s scan rate. Figure 5. Comparison of CV plot of MWCNTs/PANI, TiO2-MWCNTs/PANI and graphene/TiO2-MWCNTs/PANI at 10 mV/s scan rate (a), CV plot of graphene/TiO2-MWCNTs/PANI nanocomposites at 2 mV/s, 10 mV/s, 50 mV/s, 100 mV/s and 200 mV/s scan rate (b), and Variation of specific capacitance of TiO2-MWCNTs/PANI and graphene/TiO2-MWCNTs/PANI with scan rate (c). Copyright © 2012 SciRes. OJAppS 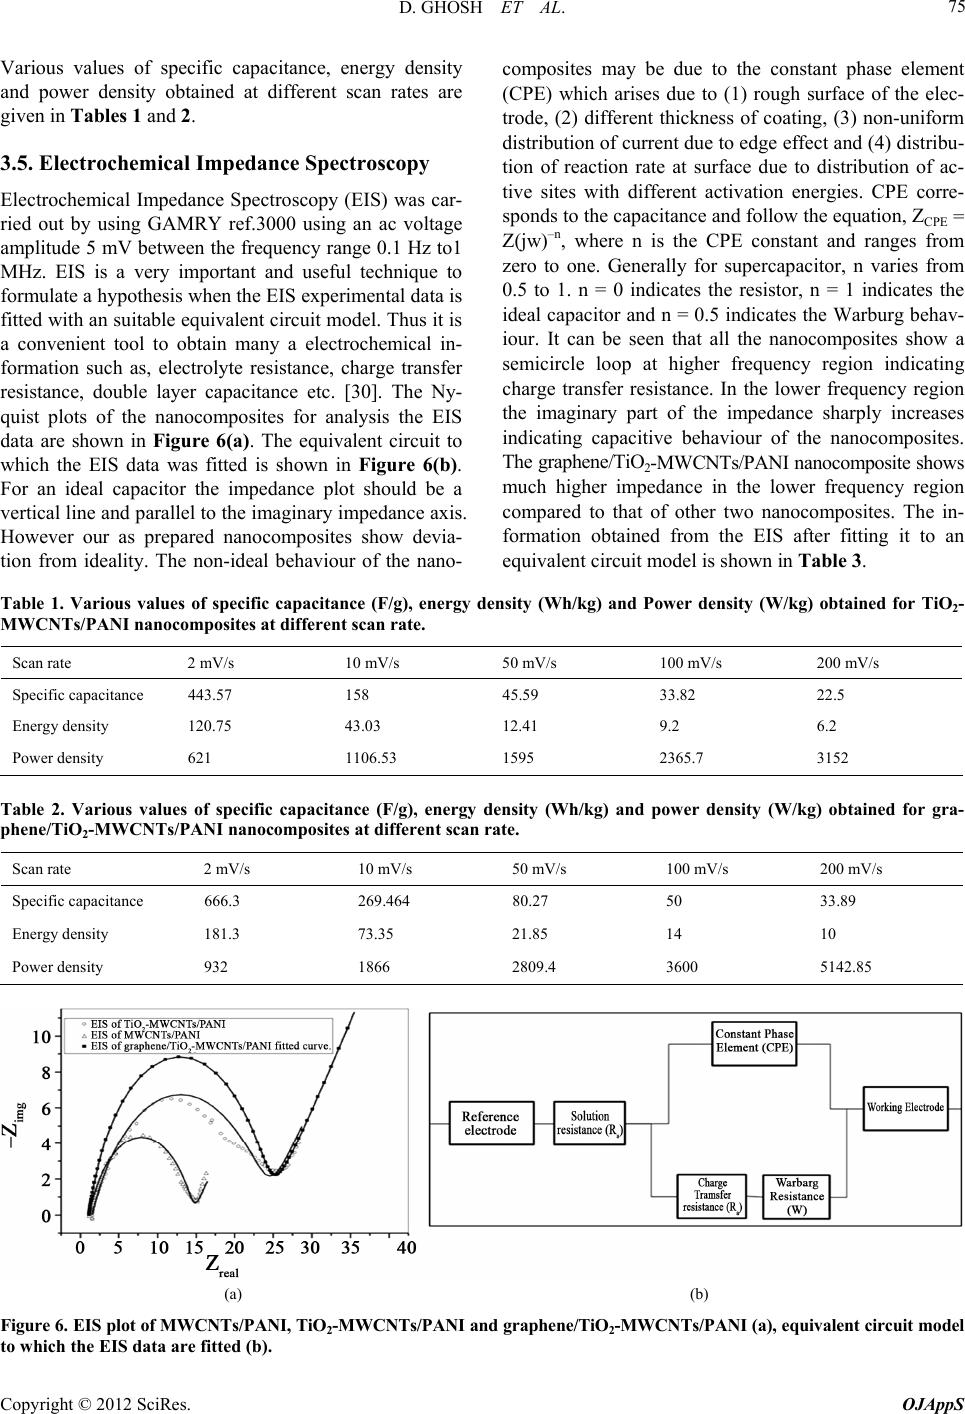 D. GHOSH ET AL. 75 Various values of specific capacitance, energy density nd power d composites may be due to the constant phase element a ensity obtained at different scan rates are pedance Spectroscopy ar- ge (CPE) which arises due to (1) rough surface of the elec- end for TiO2- given in Tables 1 and 2. 3.5. Electrochemical Im Electrochemical Impedance Spectroscopy (EIS) was c ried out by using GAMRY ref.3000 using an ac volta amplitude 5 mV between the frequency range 0.1 Hz to1 MHz. EIS is a very important and useful technique to formulate a hypothesis when the EIS experimental data is fitted with an suitable equivalent circuit model. Thus it is a convenient tool to obtain many a electrochemical in- formation such as, electrolyte resistance, charge transfer resistance, double layer capacitance etc. [30]. The Ny- quist plots of the nanocomposites for analysis the EIS data are shown in Figure 6(a). The equivalent circuit to which the EIS data was fitted is shown in Figure 6(b). For an ideal capacitor the impedance plot should be a vertical line and parallel to the imaginary impedance axis. However our as prepared nanocomposites show devia- tion from ideality. The non-ideal behaviour of the nano- Table 1. Various values of specific capacitance (F/g), energy d WCNTs/PANI nanocomposites at different scan rate. trode, (2) different thickness of coating, (3) non-uniform distribution of current due to edge effect and (4) distribu- tion of reaction rate at surface due to distribution of ac- tive sites with different activation energies. CPE corre- sponds to the capacitance and follow the equation, ZCPE = Z(jw)–n, where n is the CPE constant and ranges from zero to one. Generally for supercapacitor, n varies from 0.5 to 1. n = 0 indicates the resistor, n = 1 indicates the ideal capacitor and n = 0.5 indicates the Warburg behav- iour. It can be seen that all the nanocomposites show a semicircle loop at higher frequency region indicating charge transfer resistance. In the lower frequency region the imaginary part of the impedance sharply increases indicating capacitive behaviour of the nanocomposites. The graphene/TiO2-MWCNTs/PANI nanocomposite shows much higher impedance in the lower frequency region compared to that of other two nanocomposites. The in- formation obtained from the EIS after fitting it to an equivalent circuit model is shown in Table 3. sity (Wh/kg) and Power density (W/kg) obtaine M Scan rate 2 mV/s 10 mV/s 50 mV/s 100 mV/s 200 mV/s Specific capacitance 443.57 158 45.59 33.82 22.5 Energy density 120.75 43.03 12.41 9.2 6.2 Power density 621 1106.53 7 1595 2365.3152 Tus valuespecific capacita), energy de(Wh/kg) and pnsity (W/kgined for gra- hene/TiO2-MWCNTs/PANI nanocomposites at different scan rate. able 2. Vario of snce (F/gnsity ower de) obta p Scan rate 2 mV/s 10 mV/s 50 mV/s 100 mV/s 200 mV/s Specific capacitance 666.3 269.464 80.27 50 33.89 Energy density 181.3 73.35 21.85 14 10 Power density 932 1866 2809.4 3600 5142.85 (a) (b) Figure 6. EIS plot of M WCNTa), equivalent circ uit mode to which the EIS data are fits/PANI, TiO2-MWCNTs/PANI and graphe ne/TiO2-MWCNTs/PANI ( ted (b). l Copyright © 2012 SciRes. OJAppS  D. GHOSH ET AL. 76 Table 3. Fitting data for equivalent electrical circuit elements of MWCNTs/PANI, TiO2-MWCNTs/PANI and graphene/ TiO2-MWCNTs/PANI nanocomposites. lution s) CPE, Y0, (S × sn)Freq. power (0 < n ≤ 1) Chargen transfer resistance(Rct) Warburg (W) resistance (S × s1/2) So resistance (R ohms) (ohms) (ohms) MWCNT/PANI 1.538 456.6e–6 0.681 24.60 185.5e–3 TiO2-MWCNT/PANI 1.–6 NT/PANI 159 248.1e –6 0.729 13.47 486.9e –3 –-3 graphene/ TiO2-MWC1.123 78.12e0.857 23.64 79.13e 4 TiO2-MWCNTs/PANI and grap REFERENCES [1] B. E. Conwayrcapacitors: S tific Fundamepplications,” Klu- o. 11, 2008, pp. . Conclusion In this study, the hene/ TiO2-MWCNTs/PANI nanocomposites were successfully prepared by in situ oxidative polymerisation method. The two nanocomposites showed maximum specific capaci- tances of 443.57 F/g and 666.3 F/g respectively at 2 mV/s scan rate in 1M KCl. The TiO2-MWCNTs acted as current collector as well as conducting wire intercon- nected among the graphene and PANI. The graphene/ TiO2-MWCNTs/PANI composite showed high energy density of 181.3 Wh/kg and very high power density of 5142.85 W/kg which were higher than that of TiO2- MWCNTs/PANI. The reasonably high value of energy density and power density ensure the nanocomposite functions as an efficient supercapacitor electrode mate- rial. , “Electrochemical Supe ntals and Technological A cien- wer Academic/Plenum, New York, 1999 [2] P. Simon and Y. Gogotsi, “Materials for Electrochemical Capacitors,” Nature Materials, Vol. 7, N 845-854. doi:10.1038/nmat2297 [3] S. Sarangpani, B. V. Tilak and C. P. Chen, “Materials for Electrochemical Capacitors,” Journal of the Electrochemi- cal Society, Vol. 143, No. 11, 1996, pp. 3791-3799. doi:10.1149/1.1837291 [4] K. H. An, K. K. Jeon, J. K. Heo, S. C. Lim, D. J. Bae Y. H. Lee, “High-Capaci and tance Supercapacitor Using a Na- nocomposite Electrode of Single-Walled Carbon Nano- tube and Polypyrrole,” The Electrochemical Society, Vol. 149, No. 6, 2002, pp. A1058-A1062. doi:10.1149/1.1491235 [5] Z. A. Hu, Y. L. Xie, Y. X. Wang, L. P. Mo, Y. and Z. Y. Zhang, “Poly Y. Yang, aniline/SnO Nanocomposite for 2 Su percapacitor Applications,” Materials Chemistry and Physics, Vol. 114, No. 2-3, 2009, pp. 990-995. doi:10.1016/j.matchemphys.2008.11.005 [6] R. N. Reddy and R. G. Reddy, “Sol-Gel MnO2 as trode Material for Electrochemical Capaci an Elec- tors,” Journal of Power Sources, Vol. 124, No. 1, 2003, pp. 330-337. doi:10.1016/S0378-7753(03)00600-1 [7] W. Sugimoto, T. Kizaki, K. Yokoshima, Y. Murakami an Y. Takasu, “Evaluation of the Pseudoc d apacitance in RuO2 with O2/GC thinlectrode,” Acta, Vol. 49, No. 2, 2004, pp. 313-320. a Ru Film EElectrochimica doi:10.1016/j.electacta.2003.08.013 [8] F. B. Zhang, Y. K.Zhou and H. L. Li, “Nanocrystalline NiO as an Electrode Material for Electrochemical Ca- pacitor,” Materials Chemistry and Physic 2-3, 2004, pp. 260-264. s, Vol. 83, No. doi:10.1016/j.matchemphys.2003.09.046 [9] A. L. M. Reddy and S. Ramaprabhu, “Nanocrystalline Metal Oxides Dispersed Multiwalled Carbon Nanotubes as Su- percapacitor Electrodes,” Journal of Physical C C, Vol. 111, No. 21, 2007, pp. 7727-7734. hemistry doi:10.1021/jp069006m [10] Q. Cheng, J. Tang, J. Ma, H. Zhang, N. Shinya and L. C. Qin, “Graphene and Nanostructured MnO2 Composite Elec- trodes for Supercapacitors,” Carbon, Vol. 49 pp. 2917-2925. , No. 9, 2011, 16/j.carbon.2011.02.068doi:10.10 [11] H. Wang, Y. Liang, T. Mirfakhrai, Z. Chen, H. S. Casa- longue and H. Dai, “Advanced Asymmetrical Superca- pacitors Based on Graphene Hybrid Materials,” Nano Research, Vol. 4, No. 8, 2011, pp. 729-736. doi:10.1007/s12274-011-0129-6 [12] A. Burke, “Ultracapacitors: Why, How, and Where Is the Technology,” Journal of Power Sources, Vol. 91, No. 1, 2000, pp. 37-50. doi:10.1016/S0378-7753(00)00485-7 [13] J. Chmiola, G. Yushin,Y. Gogotsi, C. Portet, P. Simon and P. L. Taberna, “Anomalous Increase in Carbon Ca- pacitance at Pore Sizes Less than 1 Nanometer,” Science, Vol. 313 No. 5794, 2006, pp. 1760-1763. doi:10.1126/science.1132195 [14] H. L. Wang, Q. L. Hao, X. J. Yang, L. D. Lu and X. Wang, “Graphene Oxide Doped Polyaniline for Superca- pacitors,” Electrochemistry Communication 6, 2009, pp. 1158-1161. s, Vol. 11, No. doi:10.1016/j.elecom.2009.03.036 [15] G. Lota, T. A. Centeno, E. Frackowiak and F. Stoeckli, “Improvement of the Structural and Chemical Properties of a Commercial Activated Carbon Electrochemical Capacitors,” Elec for Its Application in trochimica Acta, Vol. 53, No. 5, 2008, pp. 2210-2216. doi:10.1016/j.electacta.2007.09.028 [16] J. D. Madden, A. I. Najafabadi and D. T. H. Tan, “To- wards High Power Polypyrrole/Carbon Capacitors,” Syn- thetic Metals, Vol. 152, No. 1-3, 2005, pp. 129-132. doi:10.1016/j.synthmet.2005.07.094 [17] L. B. Kong, J. Zhang, J. J. An, Y. C. Luo and L. Kang, “MWNTs/PANI composite Materials Prepared by In-Situ Chemical Oxidative Polymerization for Supercapacitor Copyright © 2012 SciRes. OJAppS  D. GHOSH ET AL. 77 Electrode,” Journal of Materials Science, Vol. 43, No. 10, 2008, pp. 3664-3669. doi:10.1007/s10853-008-2586-1 [18] A. V. Murugan, T. Muraliganth and A. Manthiram, “Rapid, Facile Microwave-Solvothermal Synthesis of Graphene Nanosheets and Their Polyaniline Nanocomposites for En- ergy Strorage,” Chemistry of Materials, Vol. 21, No. 21, 2009, pp. 5004-5006. doi:10.1021/cm902413c [19] C. Bian, A. Yu and H. Wu, “Fibriformpolyaniline/Nano-TiO2 Composite as an Electrode Material for Aqueous Redox Supercapacitors,” Electrochemistry Communications, Vol. 11, No. 2, 2009, pp. 266-269. doi:10.1016/j.elecom.2008.11.026 [20] A. K. Mishra and S. Ramaphrabu, “Functionalized Gra- phene-Based Nanocomposites for Supercapacitor Appli- cation,” The Journal of Physica No. 29, 2011, pp. 14006-14013. l Chemistry C, Vol. 115, 0.1021/jp201673edoi:1 - [21] S. M. Yuen, C. C. M. Ma, C. Y. Chuang, Y. H. Hsiao, C. L. Chiang and A. D. Yu, “Preparation, Morphology, Me- chanical and Electrical Properties of TiO2 Coated Multi- walled Carbon Nanotube/Epoxy Composites,” Compos ites: Part A, Vol. 39, No. 1, 2008, pp. 119-125. doi:10.1016/j.compositesa.2007.08.021 [22] S. K. Pillalamarri, F. D. Blum, A.T. Tokuhiro, J. G. Story, and M. F. Bertino, “Radiolytic Synthesis of Polyaniline Nanofibers: A New Templateless Pathway,” Chem Materials, Vol. 17, No. 2, 2005, pp. 227- istry o 229. f doi:10.1021/cm0488478 [23] T. C. Girija and M. V. Sangaranarayanan, “Polyaniline- Based Nickel Electrodes for Electrochemical Superca- pacitors—Influence of Triton X-100,” Journal Sources, Vol. 159, No. 2, of Power 2006, pp. 1519-1526. doi:10.1016/j.jpowsour.2005.11.078 [24] Y. Qiao, C. M. Li, S. J. Bao and Q. L. Bao, “Carbon Nanotube/Polyaniline Composite as Anode Material for Microbial Fuel Cells,” Journal of Power Sources, Vol. 170, No. 1, pp. 79-84. doi:10.1016/j.jpowsour.2007.03.048 [25] P. M. Kumar, S. Badrinarayanan and crystalline TiO2 Studied by Optical M. Sastry, “Nano- , FTIR and X-Ray Photoelectron Spectroscopy: Correlation to Presence of Surface States,” Thin Solid Films, Vol. 358, No. 1-2, 2000, pp. 122-130. doi:10.1016/S0040-6090(99)00722-1 [26] Y. Zhao, Y. Hu, Y. Li, H. Zhang, S. Zhang, L. Qu, G. Shi and L. Dai “Super-Long Aligned TiO/Carbon Nanotube Ar- 2 rays,” Nanotechnology, Vol. 21, No. 50, 2010, p. 505702. doi:10.1088/0957-4484/21/50/505702 [27] Z. Fan, M. Xie, Xi Jin, J. Yan and T. Wei, “Characteris- tics and Electrochemical Performances of Supercapacitors Using Double-Walled Carbon Nanotube/δ-MnO2 Hybrid Material Electrodes,” Journal of Electroanalytical Chem- istry, Vol. 659, No. 2, 2011, pp. 191-195. doi:10.1016/j.jelechem.2011.05.025 [28] F. Fabregat-Santiago, I. Mora-Seró, G. Ga and J. Bisquert, “Cyclic Voltammet rcia-Belmonte ry Studies of Nano- porous Semiconductors. Capacitive and Reactive Proper- ties of Nanocrystalline TiO2 Electrodes in Aqueous Elec- trolyte,” The Journal of Physical Chemistry B, Vol. 107, No. 3, 2003, pp. 758-768. doi:10.1021/jp0265182 [29] J. Yan, T. Wei, B. Shao, Z. Fan, W. Qian, M. Zhang and F. Wei, “Preparation of a Graphene Nanosheet/Polyani- line Composite with High Specific Capacitance,” Carbon, Vol. 48, No. 2, 2010, pp. 487-493. doi:10.1016/j.carbon.2009.09.066 [30] M. Ates and A. S. Sarac, “Electro Spectroscopic Study of Polythioph chemical Impedance enes on Carbon Mate- rials,” Polymer Plastics Technol ogy and Engineering, Vol. 50, No. 11, 2011, pp. 1130-1148. doi:10.1080/03602559.2011.56630 Copyright © 2012 SciRes. OJAppS
|