Paper Menu >>
Journal Menu >>
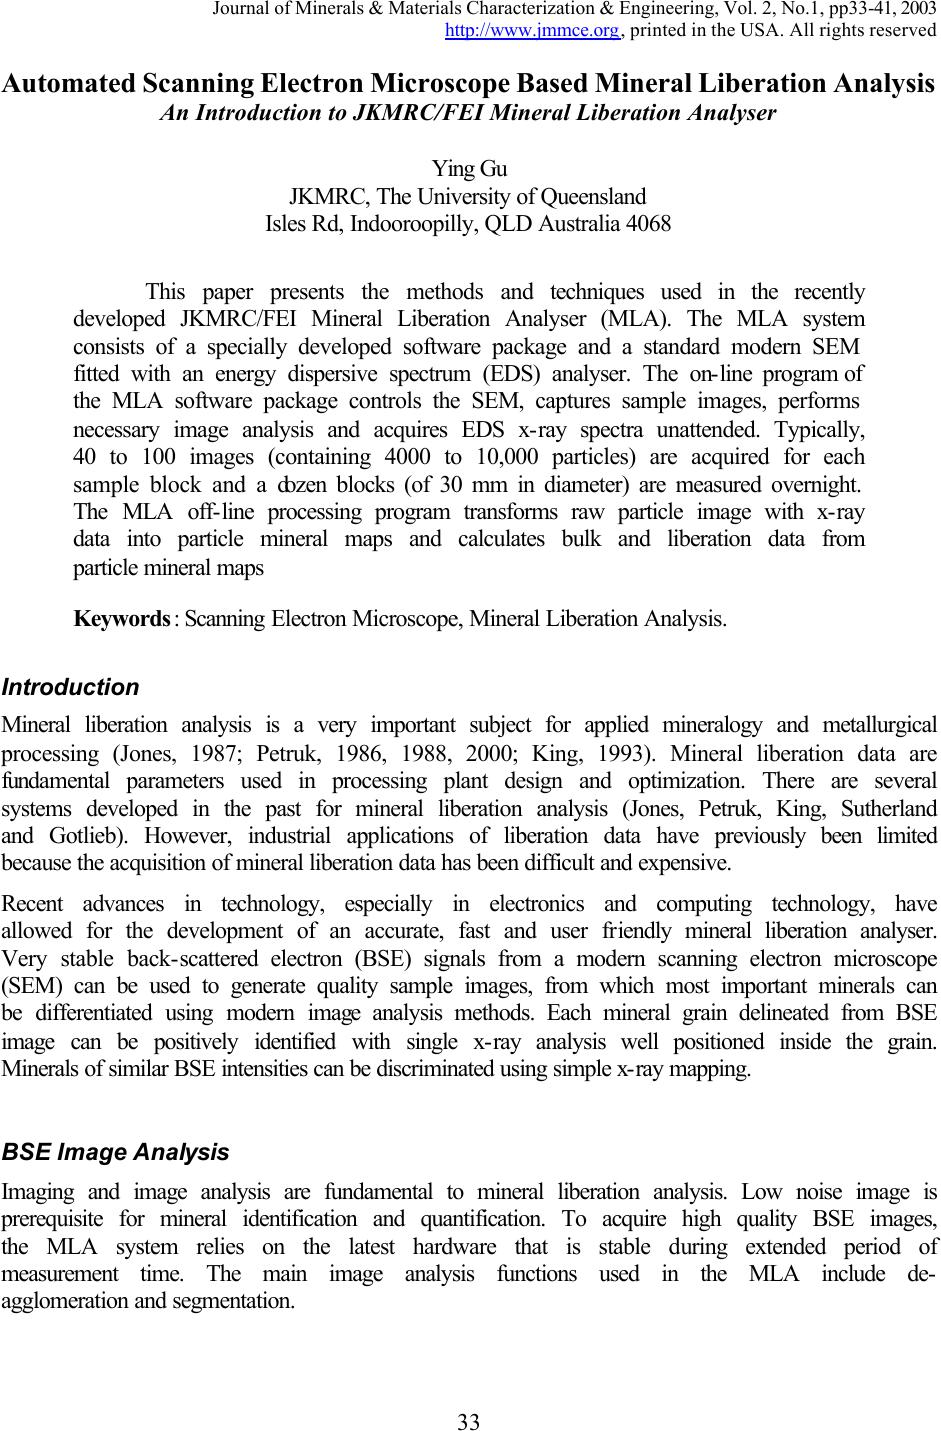 Journal of Minerals & Materials Characterization & Engineering, Vol. 2, No.1, pp33-41, 2003 http://www.jmmce.org, printed in the USA. All rights reserved 33 Automated Scanning Electron Microscope Based Mineral Liberation Analysis An Introduction to JKMRC/FEI Mineral Liberation Analyser Ying Gu JKMRC, The University of Queensland Isles Rd, Indooroopilly, QLD Australia 4068 This paper presents the methods and techniques used in the recently developed JKMRC/FEI Mineral Liberation Analyser (MLA). The MLA system consists of a specially developed software package and a standard modern SEM fitted with an energy dispersive spectrum (EDS) analyser. The on-line program of the MLA software package controls the SEM, captures sample images, performs necessary image analysis and acquires EDS x-ray spectra unattended. Typically, 40 to 100 images (containing 4000 to 10,000 particles) are acquired for each sample block and a dozen blocks (of 30 mm in diameter) are measured overnight. The MLA off-line processing program transforms raw particle image with x-ray data into particle mineral maps and calculates bulk and liberation data from particle mineral maps Keywords: Scanning Electron Microscope, Mineral Liberation Analysis. Introduction Mineral liberation analysis is a very important subject for applied mineralogy and metallurgical processing (Jones, 1987; Petruk, 1986, 1988, 2000; King, 1993). Mineral liberation data are fundamental parameters used in processing plant design and optimization. There are several systems developed in the past for mineral liberation analysis (Jones, Petruk, King, Sutherland and Gotlieb). However, industrial applications of liberation data have previously been limited because the acquisition of mineral liberation data has been difficult and expensive. Recent advances in technology, especially in electronics and computing technology, have allowed for the development of an accurate, fast and user friendly mineral liberation analyser. Very stable back-scattered electron (BSE) signals from a modern scanning electron microscope (SEM) can be used to generate quality sample images, from which most important minerals can be differentiated using modern image analysis methods. Each mineral grain delineated from BSE image can be positively identified with single x-ray analysis well positioned inside the grain. Minerals of similar BSE intensities can be discriminated using simple x-ray mapping. BSE Image Analysis Imaging and image analysis are fundamental to mineral liberation analysis. Low noise image is prerequisite for mineral identification and quantification. To acquire high quality BSE images, the MLA system relies on the latest hardware that is stable during extended period of measurement time. The main image analysis functions used in the MLA include de- agglomeration and segmentation. 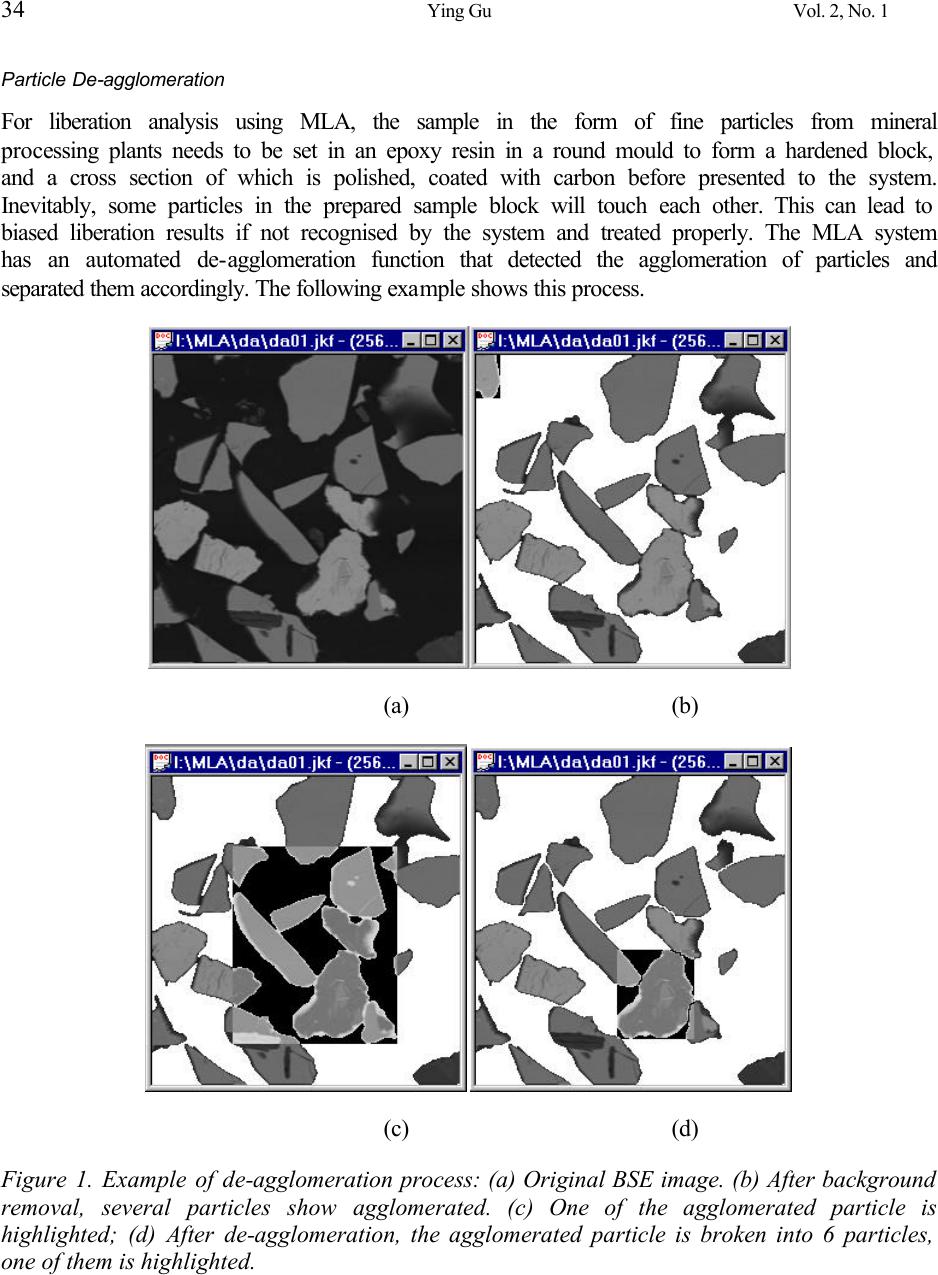 34 Ying Gu Vol. 2, No. 1 Particle De-agglomeration For liberation analysis using MLA, the sample in the form of fine particles from mineral processing plants needs to be set in an epoxy resin in a round mould to form a hardened block, and a cross section of which is polished, coated with carbon before presented to the system. Inevitably, some particles in the prepared sample block will touch each other. This can lead to biased liberation results if not recognised by the system and treated properly. The MLA system has an automated de-agglomeration function that detected the agglomeration of particles and separated them accordingly. The following example shows this process. (a) (b) (c) (d) Figure 1. Example of de-agglomeration process: (a) Original BSE image. (b) After background removal, several particles show agglomerated. (c) One of the agglomerated particle is highlighted; (d) After de-agglomeration, the agglomerated particle is broken into 6 particles, one of them is highlighted. 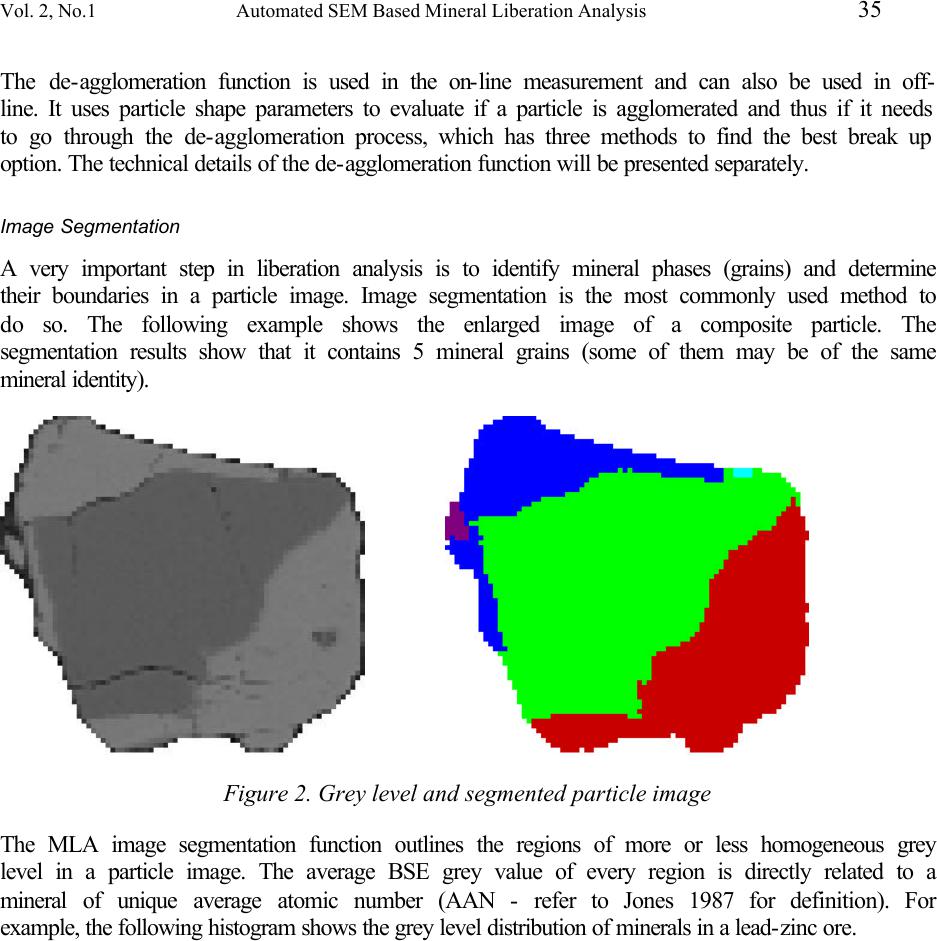 Vol. 2, No.1 Automated SEM Based Mineral Liberation Analysis 35 The de-agglomeration function is used in the on-line measurement and can also be used in off- line. It uses particle shape parameters to evaluate if a particle is agglomerated and thus if it needs to go through the de-agglomeration process, which has three methods to find the best break up option. The technical details of the de-agglomeration function will be presented separately. Image Segmentation A very important step in liberation analysis is to identify mineral phases (grains) and determine their boundaries in a particle image. Image segmentation is the most commonly used method to do so. The following example shows the enlarged image of a composite particle. The segmentation results show that it contains 5 mineral grains (some of them may be of the same mineral identity). Figure 2. Grey level and segmented particle image The MLA image segmentation function outlines the regions of more or less homogeneous grey level in a particle image. The average BSE grey value of every region is directly related to a mineral of unique average atomic number (AAN - refer to Jones 1987 for definition). For example, the following histogram shows the grey level distribution of minerals in a lead-zinc ore. 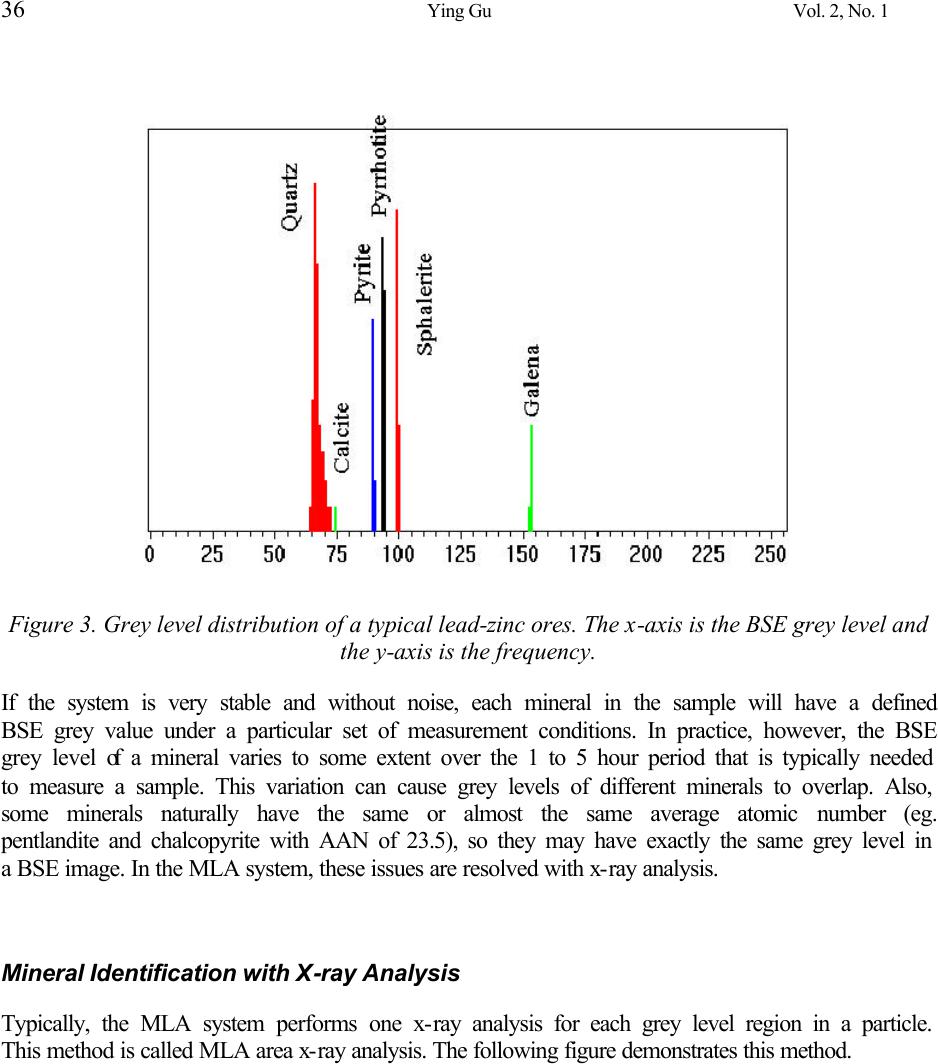 36 Ying Gu Vol. 2, No. 1 Figure 3. Grey level distribution of a typical lead-zinc ores. The x-axis is the BSE grey level and the y-axis is the frequency. If the system is very stable and without noise, each mineral in the sample will have a defined BSE grey value under a particular set of measurement conditions. In practice, however, the BSE grey level of a mineral varies to some extent over the 1 to 5 hour period that is typically needed to measure a sample. This variation can cause grey levels of different minerals to overlap. Also, some minerals naturally have the same or almost the same average atomic number (eg. pentlandite and chalcopyrite with AAN of 23.5), so they may have exactly the same grey level in a BSE image. In the MLA system, these issues are resolved with x-ray analysis. Mineral Identification with X-ray Analysis Typically, the MLA system performs one x-ray analysis for each grey level region in a particle. This method is called MLA area x-ray analysis. The following figure demonstrates this method.  Vol. 2, No.1 Automated SEM Based Mineral Liberation Analysis 37 Figure 4. MLA area x-ray analysis of a composite particle; after segmentation, 5 grains are delineated and one x-ray spectrum is collected to provide their mineral identity. This method only requires a small number of x-ray analyses to define the mineral composition of a particle. It is very effective and can be applied to most samples. However, this method cannot be used to analyse samples in which two or more minerals have the same AAN and are associated (in contact with each other). For example, if a particle contains pentlandite and chalcopyrite, the segmentation will not be able to detect the boundaries between these two minerals, so there will be only one x-ray collected for this particle. The x-ray spectrum will not match that of pentlandite nor that of chalcopyrite. The MLA system uses the particle x-ray mapping method to handle this type of sample. In particle x-ray mapping, a regular grid is imposed on a particle image and x-ray data is collected at each grid point to determine the mineral identity. The following is an example.  38 Ying Gu Vol. 2, No. 1 Figure 5. Particle x-ray mapping, The brighter phase of the particle is identified as chalcopyrite and the darker phase is pyrite. Particle x-ray mapping can resolve minerals that have the same AAN. However, the process requires more time, as many more x-ray analyses are required to generate a particle mineral map. Measurement Modes There are seven basic MLA measurement modes to handle different sample types and to meet different mineralogical information requirements. They are: 1.) standard BSE liberation analysis (BSE), 2.) extended BSE liberation analysis (XBSE), 3.) sparse phase liberation (SPL) analysis, 4.) particle X-ray mapping (PXMAP) analysis, 5.) selected particle X-ray mapping (SXMAP) analysis, 6.) X-ray modal (XMOD) analysis and 7.) rare phase search (RPS) methods. Standard BSE Liberation Analysis (BSE) The standard BSE liberation analysis, or BSE, is the most basic liberation analysis method, in which a series of images are collected on-line and then processed off-line to produce liberation data. Mineral discrimination is based on BSE grey level distribution. Thus, the BSE method is a purely image analysis based method. It is suitable for samples containing minerals that have sufficient BSE grey level contrast, such as lead-zinc ores and some copper sulphide ores. The BSE method is the base for all the other methods.  Vol. 2, No.1 Automated SEM Based Mineral Liberation Analysis 39 Extended BSE Liberation Analysis (XBSE) The extended liberation analysis, or XBSE, method is a more advanced method, in which each BSE image is collected and segmented to delineate mineral grain boundaries in each particle, then each mineral grain is analysed with one x-ray, i.e. with the area x-ray analysis. The off-line processing generates particle mineral maps from particle segmentation data and x-ray spectra. This method can be used to handle various complex ore types. Sparse Phase Liberation Analysis (SPL) The sparse phase liberation, or SPL, method searches the BSE image for particles of interest and then performs an XBSE analysis on them. The off-line processing is the same as XBSE method and generates the same mineral liberation and association data. However, it does not provide bulk mineralogy information, as only certain types of particles in the sample are analysed. It is designed to handle tailings and low grade feed ores, such as platinum group mineral (PGM) ores. Particle X-ray Mapping (PXMAP) The particle X-ray mapping, or PXMAP, method uses x-ray dot mapping technique to generate particle mineral maps. It only uses limited BSE information to discriminate particles from background (epoxy resin). Each particle is subjected to x-ray mapping and both x-ray spectra and particle images are stored into the raw data file. The off-line classification procedure then turns the X-ray points into mineral identity. This method is suitable for ores containing minerals of very similar grey level, such as ores with pentlandite and chalcopyrite, or ores with certain type of sphalerite and chalcopyrite. It can also be used for ores with textually complex particles, such as nickel ores that contain pentlandite as fine flames in pyrrhotite. However, the PXMAP method is relatively time consuming due to the large numbers of x-ray analysis to be acquired. Selected Particle X-ray Mapping (SXMAP) The selected particle X-ray mapping, or SXMAP, method performs PXMAP type of mapping on certain selected particles and XBSE type analysis on the rest of the particles. This method is designed to combine the benefits of both PXMAP (accurate for more complex particles) and XBSE (fast and accurate for less complex particles) methods. The operator can select the particles for PXMAP mapping with a BSE threshold or with x-ray standards. X-ray Modal Analysis (XMOD) The X-ray modal analysis, or XMOD, method is a typical point counting method, in which the mineral identification is determined by one x-ray analysis at each counting point. This method only uses BSE to discriminate particle matter from background. For each grid point on particle, one x-ray spectrum is collected and saved for off-line classification. This method only produces modal mineralogy information, i.e. percentages of the mineral components of the sample. Rare Phase Search (RPS) The rare phase search, or RPS, method searches the BSE image for phases of interest and collects x-ray spectra on them. For each object found, the system saves the particle image that  40 Ying Gu Vol. 2, No. 1 contains the object, its stage location and its x-ray spectrum. The subsequent manual classification can bring out the phases of interest and allow the operator to move SEM to the stage location where a phase of interest is recorded. The RPS method is designed to efficiently locate very minor and fine (sub-micron) components, such as gold in tailings. The ability to classify off-line allows the operator to automatically eliminate interfering minerals, such as galena, from phases of interest, such as gold. Discussion Prudent use of both BSE and x-ray signals from SEM is the key to an automated SEM based mineral liberation analysis system. BSE image acquisition is very fast compared with x-ray spectrum analysis. A standard BSE image of 1024 X 800, containing 819,200 bits of independent information, can be acquired in about 100 seconds. In comparison, only 10,000 x-ray points can be acquired during the same period of time (assuming 10 millisecond per analysis as some EDS systems can now do). This is a difference of almost two orders of magnitude. BSE signal also has very high spatial resolution (0.1 – 0.2 microns) compared with that of x-ray of 2 to 5 microns. This means BSE image can provide fine details of mineral intergrowth and fine grains of inclusions, such as PGM and gold etc. However, x-ray analysis can provide elemental information, which can be used to uniquely identify almost all the minerals in a sample. The seven MLA measurement modes vary from purely BSE based technique (BSE method) to a mostly x-ray analysis based technique (PXMAP method). Considerable speed, resolution and accuracy have been achieved in the current MLA system. Further improvements in flexible combination of BSE and x-ray analysis can potentially raise the capability of the system substantially. References Hall, J S (1977) Composite mineral particles – analysis by automated scanning electron microscopy, PhD thesis, JKMRC, The University of Queensland, Brisbane. Gu, Y and Sugden, T (1995) A highly integrated SEM-EDS-IP system automated quantitative mineral analysis, Proceedings of the third biennial symposium on SEM imaging and analysis: applications and techniques, University of Melbourne. (Australian Society of Electron Microscopy) King, R P (1993) Basic image analysis for mineralogy, in ICAM’93 Demonstration Workshop Manual, pp 119 – 139. Jones, M. P. (1987). Applied mineralogy : a quantitative approach. London ; Norwell, MA., Graham & Trotman. Petruk, W. (2000). Applied mineralogy in the mining industry. Amsterdam ; New York, Elsevier Science BV.  Vol. 2, No.1 Automated SEM Based Mineral Liberation Analysis 41 Petruk, W (1988) Automatic image analysis for mineral beneficiation, J. Metals, 40:29 – 31. Petruk, W (1986) The MP-SEM-IPS image analysis system. CANMET Report 87-1E (CANMET, Dept Energy, Mines, And Resources, Canada) Sutherland, D N (1998) Application of quantitative process mineralogy through the mining cycle, Proceedings of the AusIMM Annual Conference ’98, Mount Isa, pp 333 – 337 (The Australasian Institute of Mining and Metallurgy: Melbourne) |