Paper Menu >>
Journal Menu >>
 Journal of Minerals & Materials Characterization & Engineering, Vol. 2, No.1, pp11-31, 2003 http://www.jmmce.org, printed in the USA. All rights reserved 11 Processed Low NO x Fly Ash as a Filler in Plastics X. Huang, J.Y. Hwang, and J.M. Gillis Institute of Materials Processing Michigan Technological University 1400 Townsend Drive Houghton, Michigan 49931-1295 Fly ash generated from low NO x burners at American Electric Power's Glen Lyn facility was beneficiated to remove residual carbon, magnetic particles, and cenospheres. The clean fly ash had a mean particle size of about 30 microns, which is coarser than typical commercial fillers used in plastics. To obtain a finer sized fly ash, air classification was used to separate the clean fly ash into its coarse and fine fractions. The resulting fine fraction had a mean particle size of 4.13 microns and accounted for 16.7 wt% of the total clean ash. The brightness of the clean ash was also less than that of typical commercial fillers and efforts to improve the brightness proved unsuccessful. The resulting fine ash was then coated with a silane coupling agent and then added to polypropylene, low density polyethylene, and high density polyethylene at various levels. These mixtures were in turn used to make tensile test specimens by injection molding. For comparison, a commercial CaCO 3 filler was also tested under the same conditions. The mechanical properties of these specimens were determined and the results show that the polymers containing fly ash as a filler have equivalent properties to those same polymers when commercial fillers are used in most cases. Keywords: Fly ash, filler, plastics, injection molding. Introduction The 1990 Clean Air Act Amendments has forced many utilities to retrofit with low NO x burners to meet the new standards. One side effect of low NO x burners is that a fly ash with higher carbon content is created, which prohibits its use in cement and concrete products and its potential penetration into a number of other markets. The Institute of Materials Processing at Michigan Technological University (IMP/MTU) has used its patented beneficiation process to remove the residual carbon, magnetic particles, and cenospheres from low NO x fly ash at pilot plant scale. As a result the loss on ignition (LOI) of the fly ash received from American Electric Power Company (AEP) has been reduced from 23.3% to 1.2%. A potential application for fly ash, other than as a substitute for cement, is to use the resulting clean ash as a plastic filler. Mineral fillers are widely used in plastic products to improve  12 X. Huang, J. Y. Hwang, and J. M. Gillis Vol.2, No.1 performance and reduce the costs. The minerals commonly used for plastic fillers include calcium carbonate, kaolin, aluminum trihydrate, talc and titanium dioxide. Yet calcium carbonate accounts for about 70% of the fillers used. Fly ash can also be classified as a mineral based on its chemistry and physical properties. The characteristics of fly ash are very close to a number of commercial fillers. Previous studies have indicted that the use of fly ash as a plastic filler has shown promising results [1-3] . However, the particle size and brightness of fly ash are still less desirable than those of a typical commercial filler. The objective of this research is to further process the clean fly ash by separating the finest fraction and improving its brightness while evaluating its performance as a plastic filler. Most commercial plastic fillers have a mean diameter of only a few microns. The average particle size of the clean AEP ash is about 30 microns with about 15% having a mean diameter of less than 5 microns. Based on the clean ash size distribution and commercial filler specification, clean ash with a maximum particle size of 5 microns seems an appropriate choice to satisfy the basic plastic filler requirements. Both a hydrocyclone and an air classification system offer a potential means for the separation of fly ash into two fractions using 5 microns as the cut. In this study an air classifier was used for the separation. The approach adopted in this study to improve brightness was to control the precipitation of TiO 2 , CaCO 3 or ZnO onto the clean ash surface. The evaluation of the fine clean ash coated with a coupling agent as a plastic filler was conducted by comparing it to three polymers, polypropylene, low density polyethylene and high density polyethylene, compounded with a commercial CaCO 3 filler under the same conditions. At the end of the study, a plastic company was invited to try the resulting polymers, compounded with the clean ash, to produce two commercial auto parts. Experimental Beneficiation Ash beneficiation on a pilot plant level was conducted at the IMP with a feed rate of about 90 kg/hr. The as-received fly ash was mixed with water to form a slurry and pumped into a magnetic separator. After the magnetic fraction had been removed, the slurry was fed into a settling tank to capture the cenospheres and provide a uniform feed to a flotation circuit. The cenospheres that floated were in turn recovered by skimming the surface of the water. The under flow material was then pumped into a conditioning tank, where reagents were added into the slurry and then routed to the first tank, or rougher stage, of the flotation phase of the process. A more detailed description on the beneficiation can be found in reference [4] . Classification An Acucut air classifier was used for the air classification task. The classification tests initiated with the runs being conducted under different operating parameters to determine the optimum conditions for the cut desired. After each test, the resulting coarse and fine fractions had their  Vol. 2. No. 1 Processed Low NO x Fly Ash as a Filler in Plastics 13 particle size distributions and yields established using a Leeds & Northrup Microtrac. After 12 tests, it was found that Test #10 offered the most favorable results. These parameters were then used to produce more than 3 kg of clean AEP ash with a particle size of less than 5 microns. Characterization The most important characteristics for a plastic filler are mean particle size, size distribution, shape, oil absorption, loose density, tap density, brightness, pH, and composition. After air classification had been used to make a cut at 5 microns with the clean AEP ash the resulting fine fraction was characterized according to these properties. The particle size and size distribution was analyzed using a Leeds & Northrup Microtrac analyzer. The particle shape was established using a JEOL JSM 820 scanning electron microscope (SEM). The loose density was measured by charging the ash into a 100 ml graduated cylinder weighing the 100 ml ash, and simply dividing the weight by the 100 ml. The tap density was measured by charging ash into a 100 ml graduated cylinder, taping the cylinder 100 times on a Stave 2003 stamp volumeter, measuring the weight and volume, and again simply dividing the weight by the volume. The oil absorption was determined by following the ASTM standard D281. Brightness was determined using a ZEISS photoelectric reflectance photometer with a swing-in brightness standard at brightness of 95.9%. The pH was measured following the ASTM standard D4972. Brightness Improvement Test It was intended to produce TiO 2 , CaCO 3 or ZnO coating on fly ash surfaces by controlling their precipitations. The principle involved is to control the reaction between two materials so that the resulting product will only nucleate and grow on fly ash surface. The TiO 2 , CaCO 3 and ZnO precipitations were produced according to the following reactions: TiCl 4 + 4NaOH = TiO 2 + 2H 2 O + 4NaCl (1) CaCl 2 H 2 O + Na 2 CO 3 = 2NaCl + CaCO 3 + 2H 2 O (2) ZnCl 2 + 2NaOH = Zn(OH) 2 + 2NaCl (3) Zn(OH) 2 150EC ZnO + H 2 O (4) A slurry with 5% clean ash and two reactant solutions with low concentration but proper ratios based on the above reactions were prepared. The two reactant solutions were charged into 250 ml burets and very slowly fed into a beaker containing the fly ash slurry while being stirred. Polymers In order to promote industrial application, Soo Plastics in Sault Ste. Marie, Michigan was been contacted. This company donated polypropylene, low density polyethylene, and high density  14 X. Huang, J. Y. Hwang, and J. M. Gillis Vol.2, No.1 polyethylene, which are currently being used by Soo Plastics, to IMP/MTU for this research. These polymers are polypropylene homopolymer T-3922 nat., Escorene LL 6407.67 nat. linear low density polyethylene, and HXM 50100 nat. high density polyethylene. These polymers were produced by Fina Oil & Chemical Company, Exxon Chemical Americas, and Phillips Petroleum, respectively. Filler Surface Treatment A Silane coupling agent was coated on the filler surface to improve bonding between the filler surface and the matrix of the polymer. Silane is a series of products formulated for different filler and polymer systems and is one of the most commonly used coupling agents. After consulting with the Dow Corning Corporation, a silane manufacturer, Dow Corning Z-6032 was selected for testing. This silane is suitable for fly ash and compatible with the three polymer systems selected, with properties as outlined in Table 1. Dow Corning donated the Z-6032 for this project. The fine ash was in turn coated with the silane, using the procedure given in Table 2. Table 1. Typical Properties of Dow Corning Z-6032 Silane Functionality vinylbenzyl-amine-methoxy Percent Solids 40 Solvent Methanol Specific Gravity at 25°C 0.900 Flash Point, closed cup, °C 13 Viscosity, at 25°C, cSt 2 Suitable diluents alcohols, water Shelf life (from date of shipment), months 6 Table 2. Silane Coating Procedure Step Activity Silane amount = 0.5 weight percent of ash Silane dilution: add 100 times by weight distilled water Mix the silane solution with ash for 10 minutes Oven dry the slurry Crush the coated ash powder through a 100 mesh screen Commercial Calcium Carbonate Filler A commercial CaCO 3 filler commonly used with polymers, Gama-Sperse CS-11, was acquired from the Georgia Marble Company. This filler has been precoated with 1% stearate by the manufacturer and no additional coupling agents were added to the calcium carbonate in this study. Polymer and Filler Mixing Polypropylene, low density polyethylene, and high density polyethylene were each compounded with the fine ash fraction and the commercial calcium carbonate filler. Each polymer was compounded with ash and then compounded with calcium carbonate at concentrations of 0, 10,  Vol. 2. No. 1 Processed Low NO x Fly Ash as a Filler in Plastics 15 20, 40 and 80 parts per hundred parts of resin (phr). Each of the batches were mixed for 30 minutes in a Brabender Plasti-Corder torque-rheometer at 50 RPM. The mixing temperatures were 250°C, 190°C and 200°C for polypropylene, low density polyethylene, and high density polyethylene respectively. Injection Molding Test Injection molding is one of the primary forming processes used by the plastic industry to produce various products. In this research, an Arburg 221-75-350 injection molding machine with a four- cavity standard tensile specimen mold was used for the forming of the test specimens. This machine is capable of providing 35 tons of clamping force and 7.5 tons of injection force. The multi-cavity mold is jacketed with water being used for the heating or cooling of the mold. The water temperature was in turn controlled by a Model TDW-INX conditioner, manufactured by Application Engineering Corporation. If a polymer and filler mixture proved to be injection moldable, ten tensile specimens were produced from each batch for mechanical testing. Mechanical Testing The modules of elasticity, elongation, yield and ultimate strengths of the specimens produced by injection molding were determined using an Instron testing system following the ASTM standard D638. If the elongation of a specimen was less than 40%, the elongation was measured by an extensometer automatically. If the elongation of a specimen was greater than 40%, the elongation was measured manually. Fracture Surface Examinations Observations were made with the assistance of SEM on the fracture surfaces of the broken tensile specimens to examine the bonding between the polymers and the fillers. Demonstration of Commercial Manufacturing Arrangements were made with a local plastics firm that would allow for the injection molding of various commercial products using the compounds produced. These compounds were in-turn granulated down to a size that would flow freely from the feed hopper through the feed chute and into the barrel of a commercial injection molding machine. The three polymers used in this project were compounded with the fine fraction of the clean AEP ash. The resulting three compounds were used to produce two different automotive parts, a trim clip being used by Chrysler and a component to support an under the hood wiring harness used by General Motors. The trim clip was chosen as a result of the symmetrical cavity layout and because the major surfaces were parallel and perpendicular to the runner. In addition the GM part contained large radii and smooth surfaces that would provide a good indication of the surface quality that could be expected from compounds containing fly ash.  16 X. Huang, J. Y. Hwang, and J. M. Gillis Vol.2, No.1 Results and Discussion Beneficiation The chemical compositions and LOIs of the AEP fly ash before and after the beneficiation are compared in Table 3. This table shows that the LOI of the AEP fly ash has been reduced from 23.3% to 1.2%, an indication of the effectiveness of the MTU's beneficiation process in removal of residual carbon. As indicated in the table concentrations of the components other than carbon have increased considerably as a result of the large amount carbon removed using the MTU process. However, it should be noted that Fe 2 O 3 had not increased as much, which is due to the removal of magnetic particles during the magnetic separation phase of the process. Table 3. Chemical compositions of as-received and clean AEP fly ash Components As - Received AEP Fly Ash, % Clean AEP Fly Ash, % SiO 2 44 58.25 Al 2 O 3 22.35 28.57 Fe 2 O 3 5.29 5.32 MgO 0.86 1.06 CaO 0.76 0.9 Na 2 O 0.32 0.43 K 2 O 2 .35 2.98 TiO 2 1.11 1.21 P 2 O 5 0.03 0.28 MnO 0.01 0.02 Cr 2 O 3 0.017 0.015 Ba, ppm 1223 1511 Sr, ppm 978 1129 Zr, ppm 194 278 Y, ppm 63 82 LOI, % 23.3 1.2 Sum, % 100.75 100.67 Classification Table 4 presents the air classification results of a few tests. As indicated test #10 resulted in the most favorable separation with a 16.7% yield and a mean particle size of 4.13 microns. In turn the operating parameters associated with this test were used to produce more than 3 kg of fine ash. Table 5 shows two particle size distribution analyses of the samples taken from the bottom and top of the 3 kg batch. The two analyses results are very close and show a relatively narrower 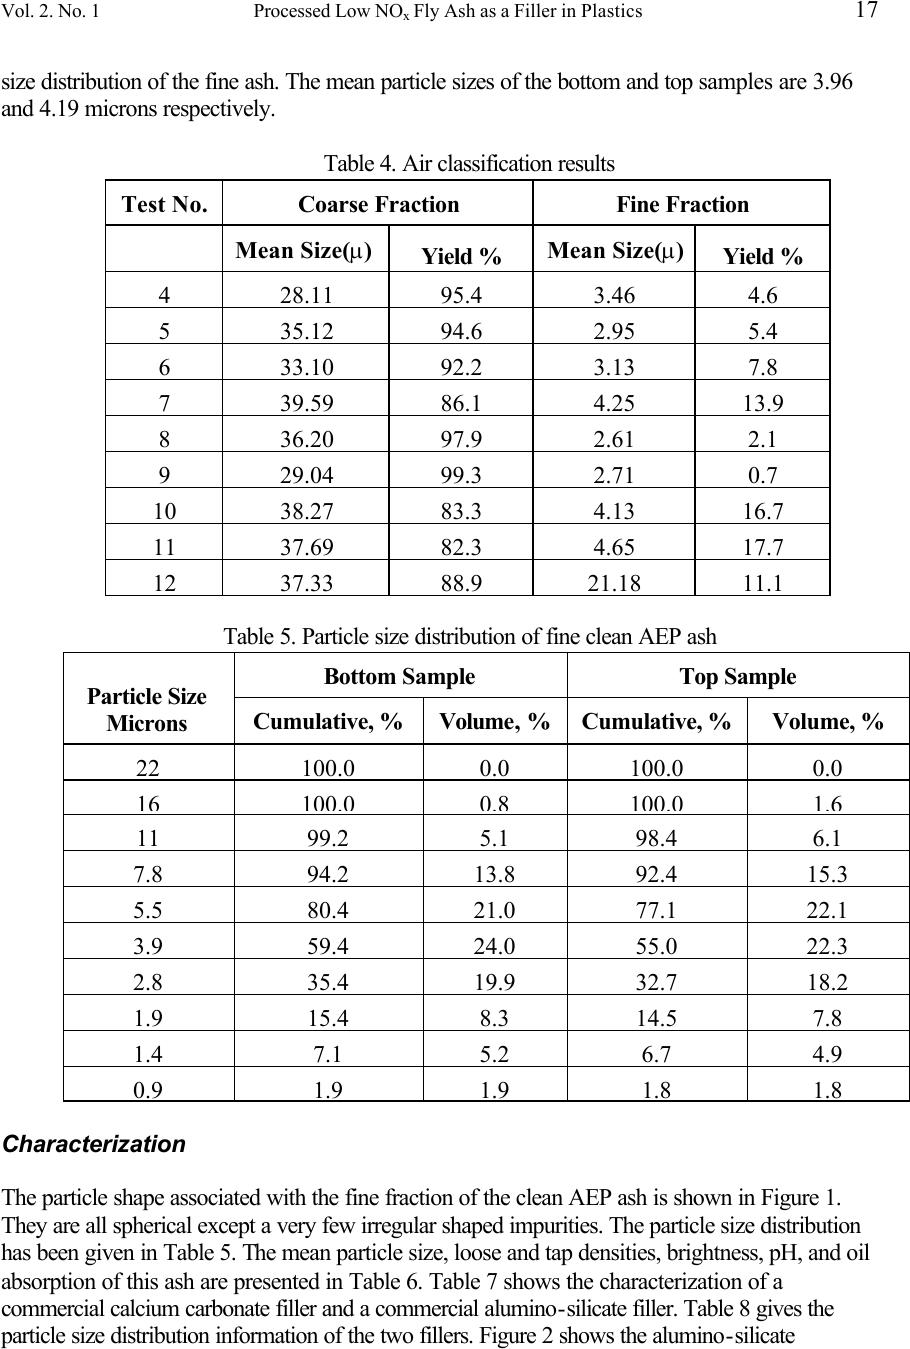 Vol. 2. No. 1 Processed Low NO x Fly Ash as a Filler in Plastics 17 size distribution of the fine ash. The mean particle sizes of the bottom and top samples are 3.96 and 4.19 microns respectively. Table 4. Air classification results Test No. Coarse Fraction Fine Fraction Mean Size(µ) Yield % Mean Size(µ) Yield % 4 28.11 95.4 3.46 4.6 5 35.12 94.6 2.95 5.4 6 33.10 92.2 3.13 7.8 7 39.59 86.1 4.25 13.9 8 36.20 97.9 2.61 2.1 9 29.04 99.3 2.71 0.7 10 38.27 83.3 4.13 16.7 11 37.69 82.3 4.65 17.7 12 37.33 88.9 21.18 11.1 Table 5. Particle size distribution of fine clean AEP ash Bottom Sample Top Sample Particle Size Microns Cumulative, % Volume, % Cumulative, % Volume, % 22 100.0 0.0 100.0 0.0 16 100.0 0.8 100.0 1.6 11 99.2 5.1 98.4 6.1 7.8 94.2 13.8 92.4 15.3 5.5 80.4 21.0 77.1 22.1 3.9 59.4 24.0 55.0 22.3 2.8 35.4 19.9 32.7 18.2 1.9 15.4 8.3 14.5 7.8 1.4 7.1 5.2 6.7 4.9 0.9 1.9 1 .9 1.8 1.8 Characterization The particle shape associated with the fine fraction of the clean AEP ash is shown in Figure 1. They are all spherical except a very few irregular shaped impurities. The particle size distribution has been given in Table 5. The mean particle size, loose and tap densities, brightness, pH, and oil absorption of this ash are presented in Table 6. Table 7 shows the characterization of a commercial calcium carbonate filler and a commercial alumino-silicate filler. Table 8 gives the particle size distribution information of the two fillers. Figure 2 shows the alumino-silicate  18 X. Huang, J. Y. Hwang, and J. M. Gillis Vol.2, No.1 filler's shape. In comparison with the commercial fillers, the fly ash filler has similar mean particle size, narrower size distribution, a reduced variation in the loose and tap densities, and similar oil absorption to that of alumino-silicate filler. The pH of the fly ash filler also falls between the two commercial fillers. The major differences are the lower brightness and spherical shape of the fly ash filler. While the lower brightness of the ash may slightly reduce the potential spectrum of applications the spherical shape of the ash particle could improve the structural characteristics of polymers compounded with ash resulting in a very broad spectrum of industrial or "under the hood" applications where brightness is not a factor. Figure 1. SEM micrograph of the fine fraction of the clean AEP ash Figure 2. Alumino-silicate filler’s shape Table 6. Characteristics of fine clean AEP ash as a plastic filler 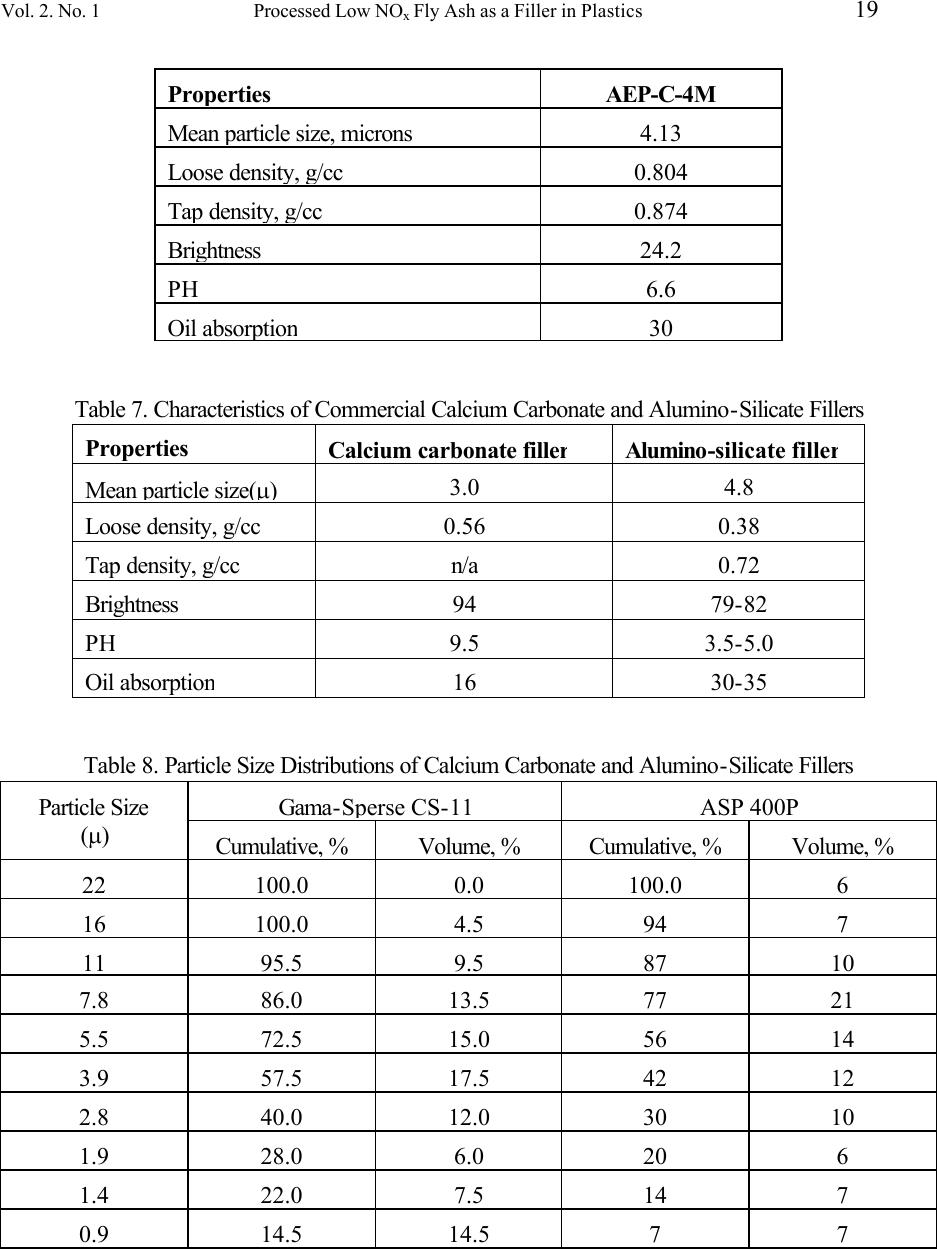 Vol. 2. No. 1 Processed Low NO x Fly Ash as a Filler in Plastics 19 Properties AEP - C - 4M Mean particle size, microns 4.13 Loose density, g/cc 0.804 Tap density, g/cc 0.874 Brightness 24.2 PH 6.6 Oil absorption 30 Table 7. Characteristics of Commercial Calcium Carbonate and Alumino-Silicate Fillers Properties Calcium carbonate filler Alumino - silicate filler Mean particle size( µ ) 3.0 4.8 Loose density, g/cc 0.56 0.38 Tap density, g/cc n/a 0.72 Brightness 94 79 - 82 PH 9.5 3.5 - 5.0 Oil absorption 16 30 - 35 Table 8. Particle Size Distributions of Calcium Carbonate and Alumino-Silicate Fillers Gama - Sperse CS - 11 ASP 400P Particle Size (µ) Cumulative, % Volume, % Cumulative, % Volume, % 22 100.0 0.0 100.0 6 16 100.0 4.5 94 7 11 95.5 9.5 87 10 7.8 86.0 13.5 77 21 5 .5 72.5 15.0 56 14 3.9 57.5 17.5 42 12 2.8 40.0 12.0 30 10 1.9 28.0 6.0 20 6 1.4 22.0 7.5 14 7 0.9 14.5 14.5 7 7 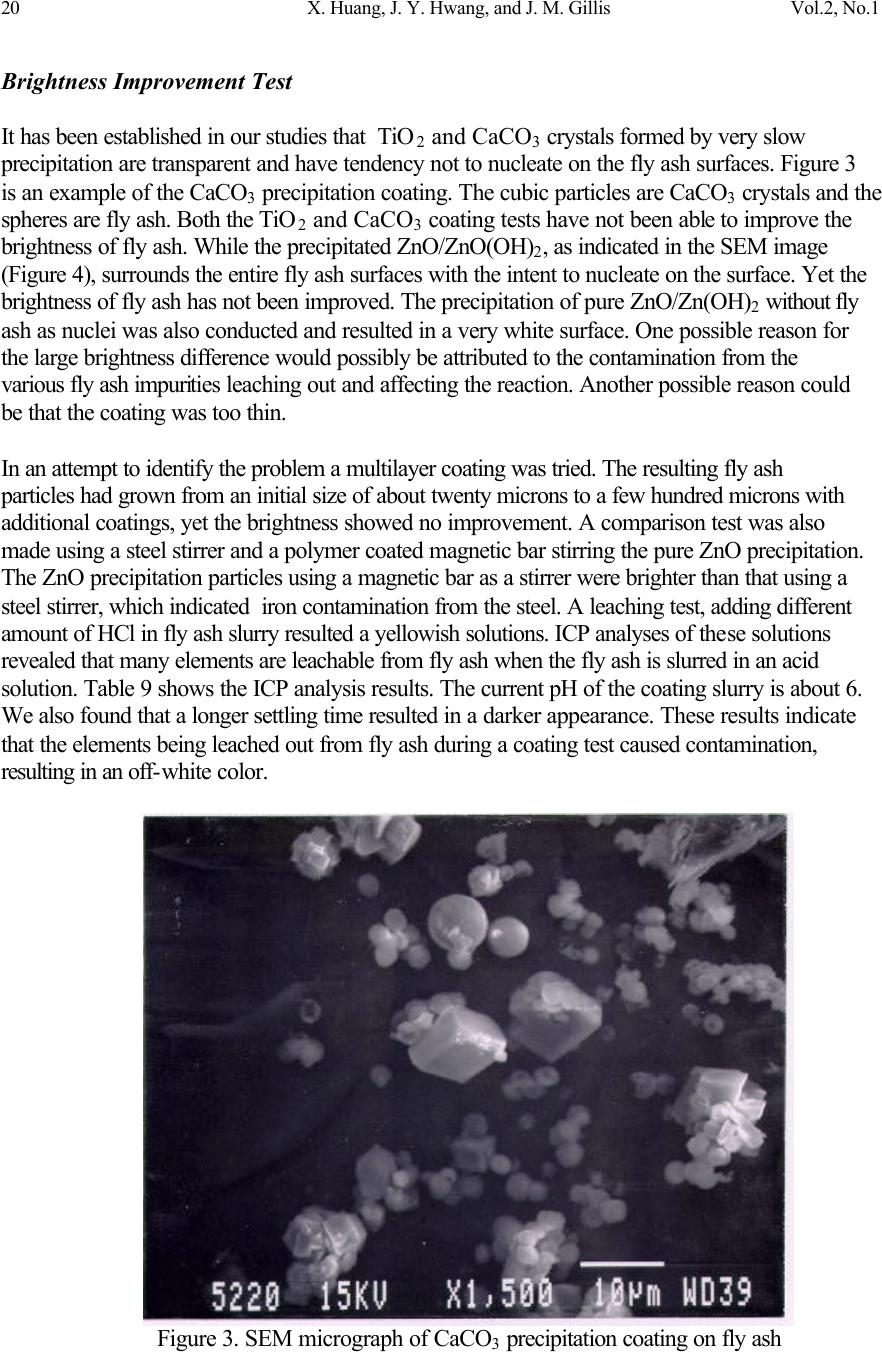 20 X. Huang, J. Y. Hwang, and J. M. Gillis Vol.2, No.1 Brightness Improvement Test It has been established in our studies that TiO 2 and CaCO 3 crystals formed by very slow precipitation are transparent and have tendency not to nucleate on the fly ash surfaces. Figure 3 is an example of the CaCO 3 precipitation coating. The cubic particles are CaCO 3 crystals and the spheres are fly ash. Both the TiO 2 and CaCO 3 coating tests have not been able to improve the brightness of fly ash. While the precipitated ZnO/ZnO(OH) 2 , as indicated in the SEM image (Figure 4), surrounds the entire fly ash surfaces with the intent to nucleate on the surface. Yet the brightness of fly ash has not been improved. The precipitation of pure ZnO/Zn(OH) 2 without fly ash as nuclei was also conducted and resulted in a very white surface. One possible reason for the large brightness difference would possibly be attributed to the contamination from the various fly ash impurities leaching out and affecting the reaction. Another possible reason could be that the coating was too thin. In an attempt to identify the problem a multilayer coating was tried. The resulting fly ash particles had grown from an initial size of about twenty microns to a few hundred microns with additional coatings, yet the brightness showed no improvement. A comparison test was also made using a steel stirrer and a polymer coated magnetic bar stirring the pure ZnO precipitation. The ZnO precipitation particles using a magnetic bar as a stirrer were brighter than that using a steel stirrer, which indicated iron contamination from the steel. A leaching test, adding different amount of HCl in fly ash slurry resulted a yellowish solutions. ICP analyses of these solutions revealed that many elements are leachable from fly ash when the fly ash is slurred in an acid solution. Table 9 shows the ICP analysis results. The current pH of the coating slurry is about 6. We also found that a longer settling time resulted in a darker appearance. These results indicate that the elements being leached out from fly ash during a coating test caused contamination, resulting in an off-white color. Figure 3. SEM micrograph of CaCO 3 precipitation coating on fly ash 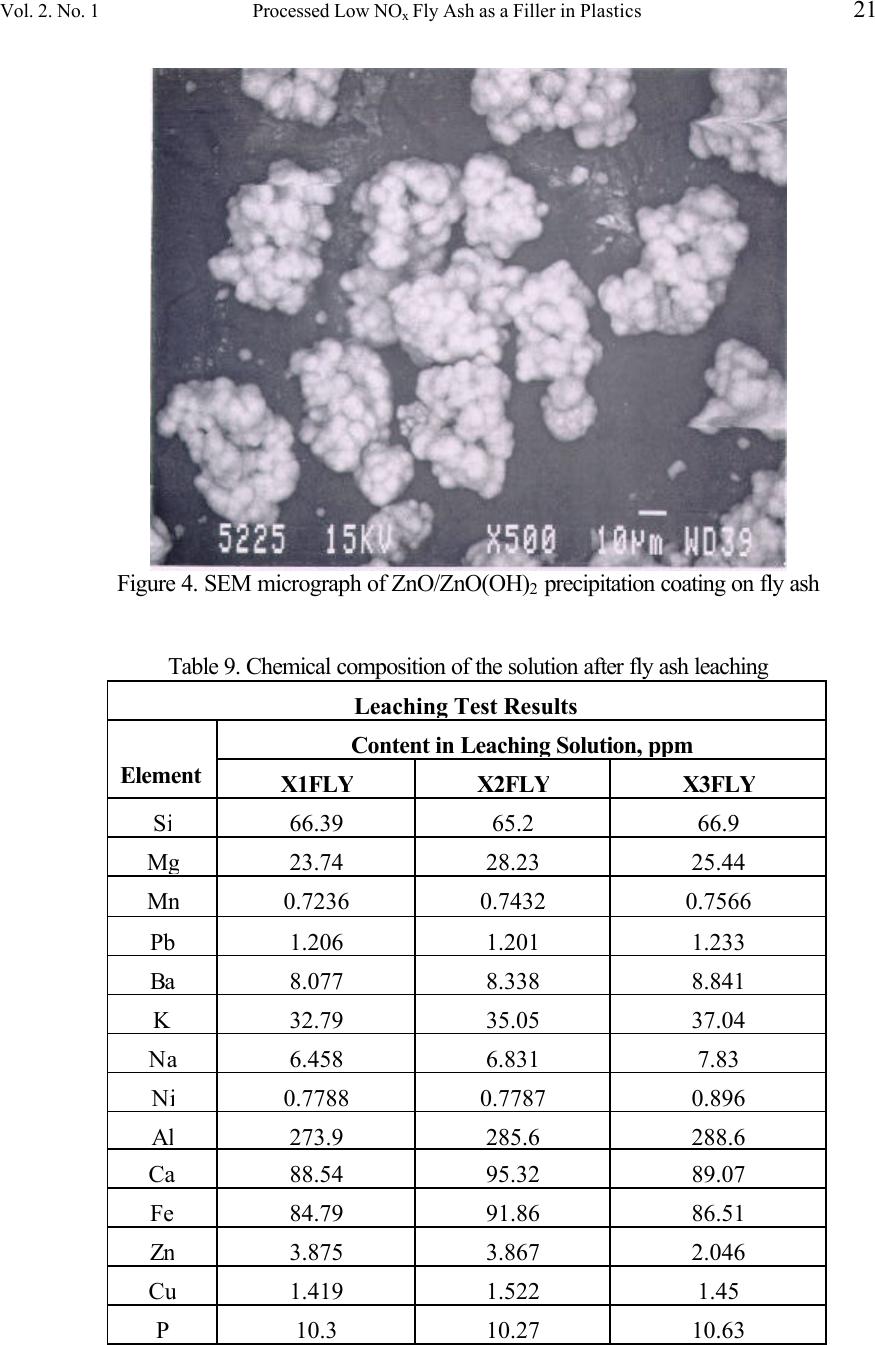 Vol. 2. No. 1 Processed Low NO x Fly Ash as a Filler in Plastics 21 Figure 4. SEM micrograph of ZnO/ZnO(OH) 2 precipitation coating on fly ash Table 9. Chemical composition of the solution after fly ash leaching Leaching Test Results Content in Leaching Solution, ppm Element X1FLY X2FLY X3FLY Si 66.39 65.2 66.9 Mg 23.74 28.23 25.44 Mn 0.7236 0.7432 0.7566 Pb 1.206 1.201 1.233 Ba 8.077 8.338 8.841 K 32.79 35.05 37.04 Na 6.458 6.831 7.83 Ni 0.7788 0.7787 0.896 Al 273.9 285.6 288.6 Ca 88.54 95.32 89.07 Fe 84.79 91.86 86.51 Zn 3.875 3.867 2.046 Cu 1.419 1.522 1.45 P 10 .3 10.27 10.63 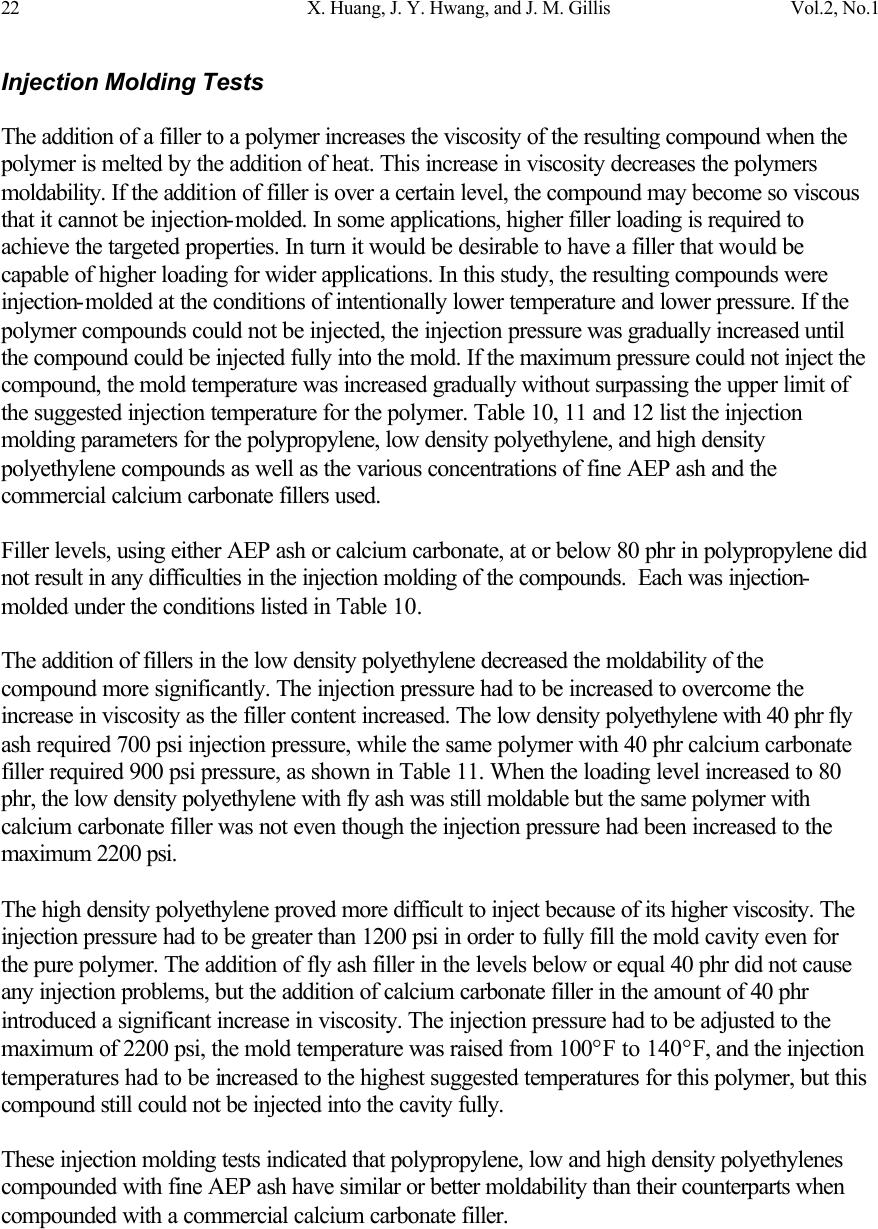 22 X. Huang, J. Y. Hwang, and J. M. Gillis Vol.2, No.1 Injection Molding Tests The addition of a filler to a polymer increases the viscosity of the resulting compound when the polymer is melted by the addition of heat. This increase in viscosity decreases the polymers moldability. If the addition of filler is over a certain level, the compound may become so viscous that it cannot be injection-molded. In some applications, higher filler loading is required to achieve the targeted properties. In turn it would be desirable to have a filler that would be capable of higher loading for wider applications. In this study, the resulting compounds were injection-molded at the conditions of intentionally lower temperature and lower pressure. If the polymer compounds could not be injected, the injection pressure was gradually increased until the compound could be injected fully into the mold. If the maximum pressure could not inject the compound, the mold temperature was increased gradually without surpassing the upper limit of the suggested injection temperature for the polymer. Table 10, 11 and 12 list the injection molding parameters for the polypropylene, low density polyethylene, and high density polyethylene compounds as well as the various concentrations of fine AEP ash and the commercial calcium carbonate fillers used. Filler levels, using either AEP ash or calcium carbonate, at or below 80 phr in polypropylene did not result in any difficulties in the injection molding of the compounds. Each was injection- molded under the conditions listed in Table 10. The addition of fillers in the low density polyethylene decreased the moldability of the compound more significantly. The injection pressure had to be increased to overcome the increase in viscosity as the filler content increased. The low density polyethylene with 40 phr fly ash required 700 psi injection pressure, while the same polymer with 40 phr calcium carbonate filler required 900 psi pressure, as shown in Table 11. When the loading level increased to 80 phr, the low density polyethylene with fly ash was still moldable but the same polymer with calcium carbonate filler was not even though the injection pressure had been increased to the maximum 2200 psi. The high density polyethylene proved more difficult to inject because of its higher viscosity. The injection pressure had to be greater than 1200 psi in order to fully fill the mold cavity even for the pure polymer. The addition of fly ash filler in the levels below or equal 40 phr did not cause any injection problems, but the addition of calcium carbonate filler in the amount of 40 phr introduced a significant increase in viscosity. The injection pressure had to be adjusted to the maximum of 2200 psi, the mold temperature was raised from 100°F to 140°F, and the injection temperatures had to be increased to the highest suggested temperatures for this polymer, but this compound still could not be injected into the cavity fully. These injection molding tests indicated that polypropylene, low and high density polyethylenes compounded with fine AEP ash have similar or better moldability than their counterparts when compounded with a commercial calcium carbonate filler.  Vol. 2. No. 1 Processed Low NO x Fly Ash as a Filler in Plastics 23 Table 10. Injection Molding Test of Polypropylene with Fillers Fillers Filler Content phr Zone I Temp. °C Zone II Temp. °C Zone III Temp. °C Zone IV Temp. °C Injection Velocity Dial* Injection Pressure Psi Holding Pressure psi Mold Temp. EF None 0 210 220 210 200 5.0 400 100 100 Fly Ash CaCO 3 10 10 210 210 220 220 210 210 200 200 5.0 5.0 400 400 100 100 100 100 Fly Ash CaCO 3 20 20 210 210 220 220 210 210 200 200 5.0 5.0 400 400 100 100 100 100 Fly Ash CaCO 3 40 40 210 210 220 220 210 210 200 200 5.0 5.0 400 400 100 100 100 100 Fly Ash CaCO 3 80 80 210 210 220 220 210 210 200 200 5.0 5.0 400 400 100 100 100 100 * Dial 5.0 is the maximum injection velocity of the machine. Table 11.Injection molding test of low density polyethylene with fillers Fillers Filler Content phr Zone I Temp. °C Zone II Temp. °C Zone III Temp. °C Zone IV Temp. °C Injection Velocity Dial* Injection Pressure psi Holding Pressure psi Mold Temp. EF None 0 210 220 210 200 5.0 500 100 100 Fly Ash CaCO 3 10 10 210 210 220 220 210 210 200 200 5.0 5.0 500 500 100 100 100 100 Fly Ash CaCO 3 20 20 220 220 230 230 220 220 210 210 5.0 5.0 700 700 100 100 100 100 Fly Ash CaCO 3 40 40 220 220 230 230 220 220 210 210 5.0 5.0 700 900 100 100 100 100 Fly Ash CaCO 3 * 80 80 220 240 230 250 220 240 210 230 5.0 5.0 900 2200 150 150 100 120 * This material can't be injected even at the maximum pressure 2200 psi. Table 12. Injection molding test of high density polyethylene with fillers Fillers Filler Content phr Zone I Temp. °C Zone II Temp. °C Zone III Temp. °C Zone IV Temp. °C Injection Velocity Dial* Injection Pressure psi Holding Pressure psi Mold Temp. EF None 0 260 260 250 250 5.0 1200 100 100 Fly Ash CaCO 3 10 10 260 260 260 260 250 250 250 250 5.0 5.0 1200 1200 100 100 100 100 Fly Ash CaCO 3 20 20 260 260 260 260 250 250 250 250 5.0 5.0 1200 1200 100 100 100 100 Fly Ash CaCO 3 * 40 40 260 290 260 290 250 270 250 270 5.0 5.0 1200 2200 100 100 100 140 * This material can't be injected even at the maximum pressure 2200 psi. 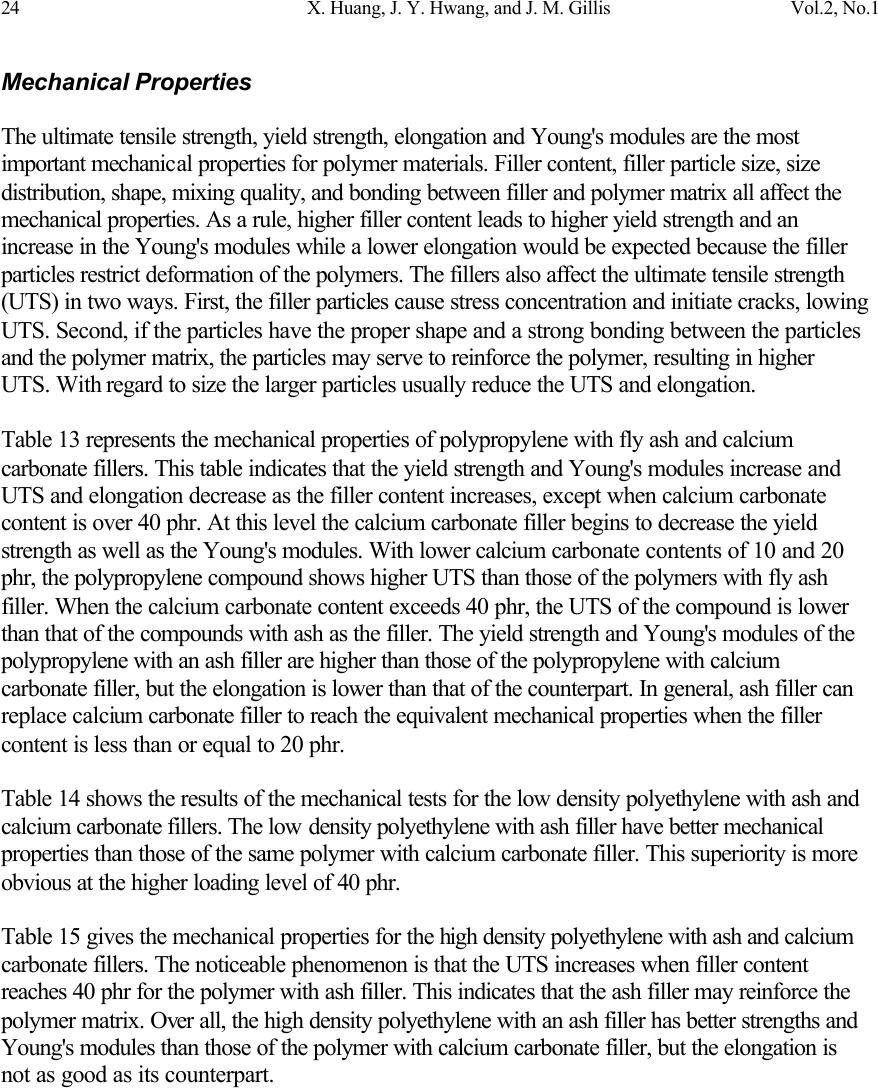 24 X. Huang, J. Y. Hwang, and J. M. Gillis Vol.2, No.1 Mechanical Properties The ultimate tensile strength, yield strength, elongation and Young's modules are the most important mechanical properties for polymer materials. Filler content, filler particle size, size distribution, shape, mixing quality, and bonding between filler and polymer matrix all affect the mechanical properties. As a rule, higher filler content leads to higher yield strength and an increase in the Young's modules while a lower elongation would be expected because the filler particles restrict deformation of the polymers. The fillers also affect the ultimate tensile strength (UTS) in two ways. First, the filler particles cause stress concentration and initiate cracks, lowing UTS. Second, if the particles have the proper shape and a strong bonding between the particles and the polymer matrix, the particles may serve to reinforce the polymer, resulting in higher UTS. With regard to size the larger particles usually reduce the UTS and elongation. Table 13 represents the mechanical properties of polypropylene with fly ash and calcium carbonate fillers. This table indicates that the yield strength and Young's modules increase and UTS and elongation decrease as the filler content increases, except when calcium carbonate content is over 40 phr. At this level the calcium carbonate filler begins to decrease the yield strength as well as the Young's modules. With lower calcium carbonate contents of 10 and 20 phr, the polypropylene compound shows higher UTS than those of the polymers with fly ash filler. When the calcium carbonate content exceeds 40 phr, the UTS of the compound is lower than that of the compounds with ash as the filler. The yield strength and Young's modules of the polypropylene with an ash filler are higher than those of the polypropylene with calcium carbonate filler, but the elongation is lower than that of the counterpart. In general, ash filler can replace calcium carbonate filler to reach the equivalent mechanical properties when the filler content is less than or equal to 20 phr. Table 14 shows the results of the mechanical tests for the low density polyethylene with ash and calcium carbonate fillers. The low density polyethylene with ash filler have better mechanical properties than those of the same polymer with calcium carbonate filler. This superiority is more obvious at the higher loading level of 40 phr. Table 15 gives the mechanical properties for the high density polyethylene with ash and calcium carbonate fillers. The noticeable phenomenon is that the UTS increases when filler content reaches 40 phr for the polymer with ash filler. This indicates that the ash filler may reinforce the polymer matrix. Over all, the high density polyethylene with an ash filler has better strengths and Young's modules than those of the polymer with calcium carbonate filler, but the elongation is not as good as its counterpart. 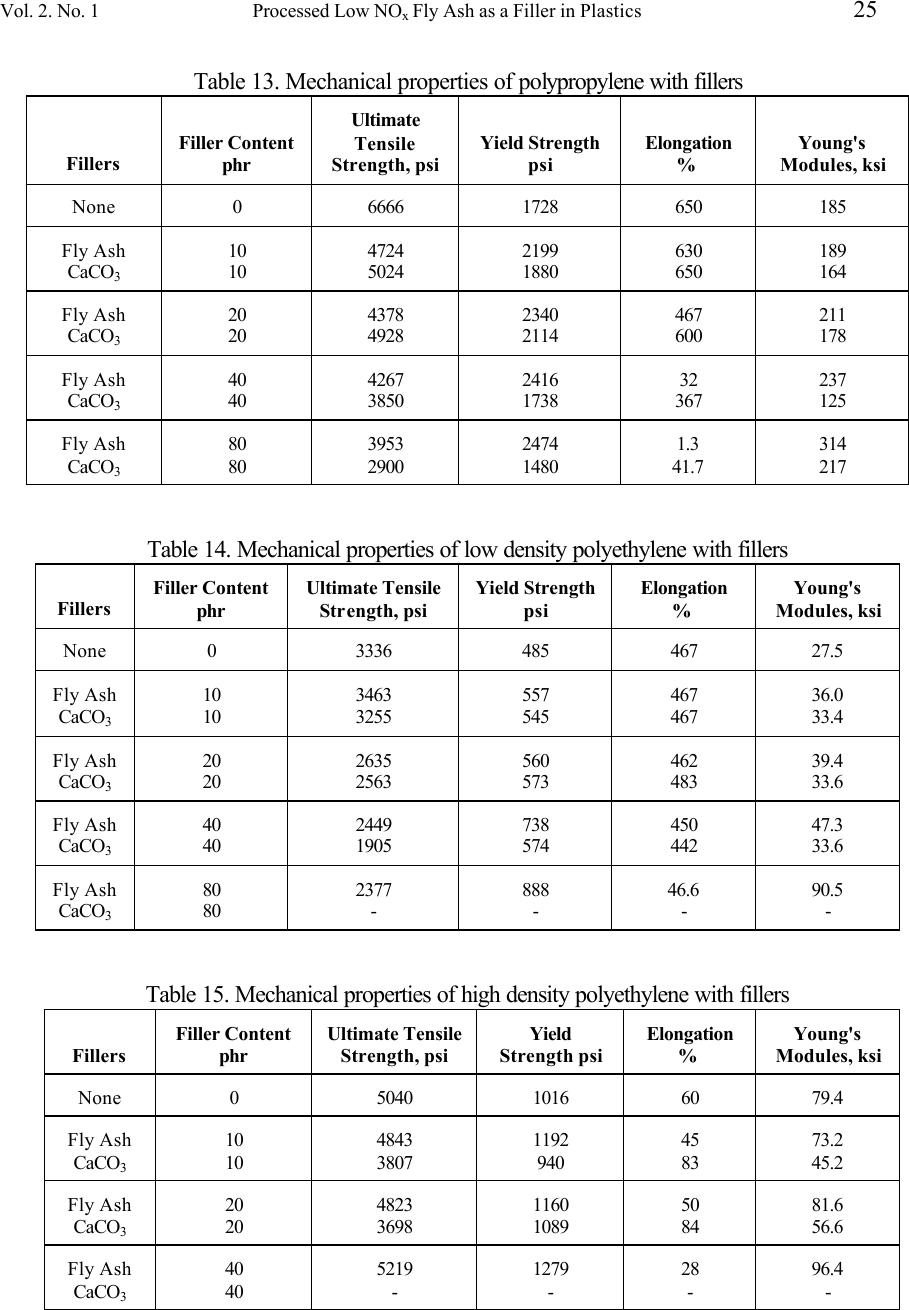 Vol. 2. No. 1 Processed Low NO x Fly Ash as a Filler in Plastics 25 Table 13. Mechanical properties of polypropylene with fillers Fillers Filler Content phr Ultimate Tensile Strength, psi Yield Strength psi Elongation % Young's Modules, ksi None 0 6666 1728 650 185 Fly Ash CaCO 3 10 10 4724 5024 2199 1880 630 650 189 164 Fly Ash CaCO 3 20 20 4378 4928 2340 2114 467 600 211 178 Fly Ash CaCO 3 40 40 4267 3850 2416 1738 32 367 237 125 Fly Ash CaCO 3 80 80 3953 2900 2474 1480 1.3 41.7 314 217 Table 14. Mechanical properties of low density polyethylene with fillers Fillers Filler Content phr Ultimate Tensile Strength, psi Yield Strength psi Elongation % Young's Modules, ksi None 0 3336 485 467 27.5 Fly Ash CaCO 3 10 10 3463 3255 557 545 467 467 36.0 33.4 Fly Ash CaCO 3 20 20 2635 2563 560 573 462 483 39.4 33.6 Fly Ash CaCO 3 40 40 2449 1905 738 574 450 442 47.3 33.6 Fly Ash CaCO 3 80 80 2377 - 888 - 46.6 - 90.5 - Table 15. Mechanical properties of high density polyethylene with fillers Fillers Filler Content phr Ultimate Tensile Strength, psi Yield Strength psi Elongation % Young's Modules, ksi None 0 5040 1016 60 79.4 Fly Ash CaCO 3 10 10 4843 3807 1192 940 45 83 73.2 45.2 Fly Ash CaCO 3 20 20 4823 3698 1160 1089 50 84 81.6 56.6 Fly Ash CaCO 3 40 40 5219 - 1279 - 28 - 96.4 - 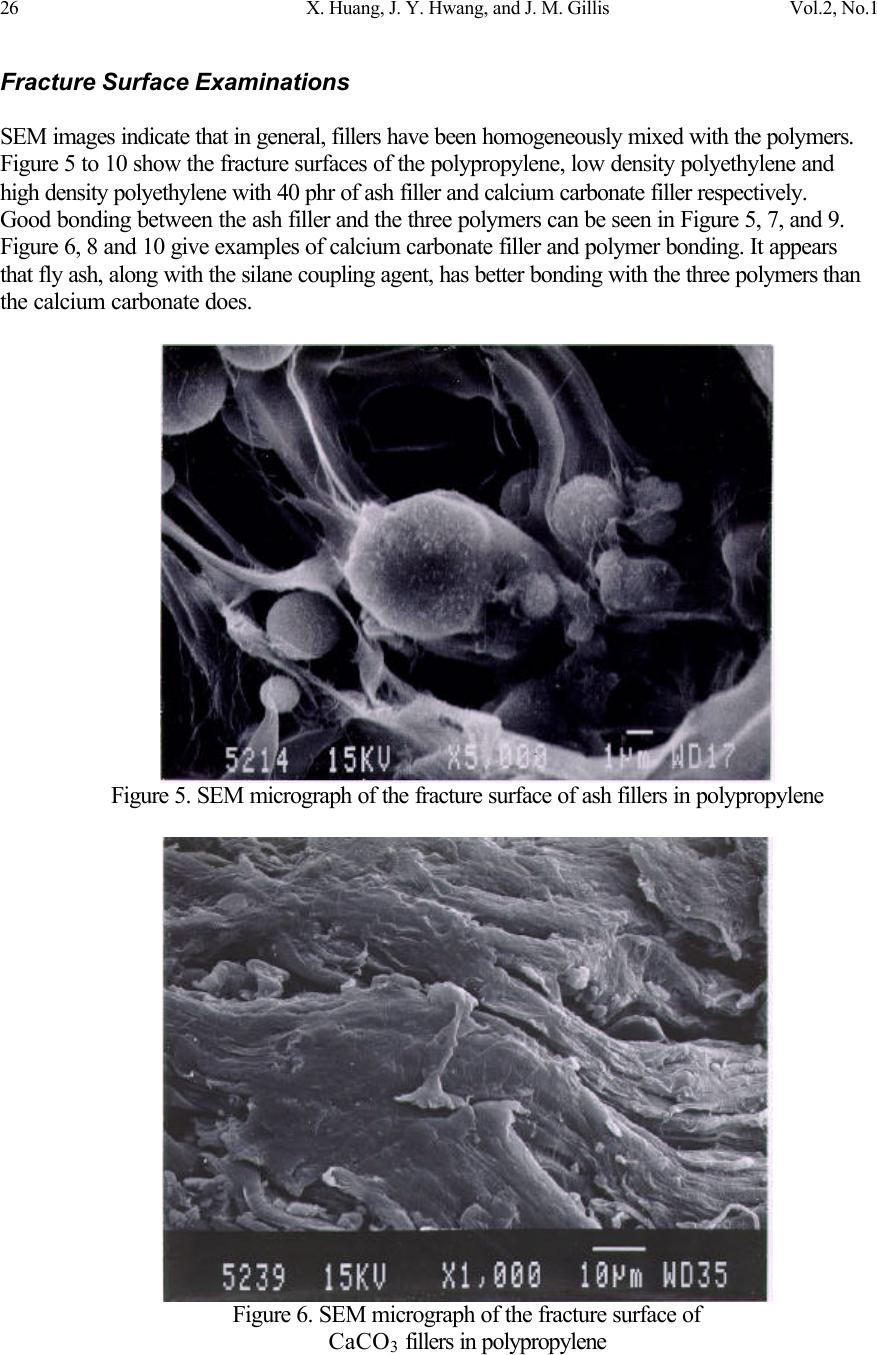 26 X. Huang, J. Y. Hwang, and J. M. Gillis Vol.2, No.1 Fracture Surface Examinations SEM images indicate that in general, fillers have been homogeneously mixed with the polymers. Figure 5 to 10 show the fracture surfaces of the polypropylene, low density polyethylene and high density polyethylene with 40 phr of ash filler and calcium carbonate filler respectively. Good bonding between the ash filler and the three polymers can be seen in Figure 5, 7, and 9. Figure 6, 8 and 10 give examples of calcium carbonate filler and polymer bonding. It appears that fly ash, along with the silane coupling agent, has better bonding with the three polymers than the calcium carbonate does. Figure 5. SEM micrograph of the fracture surface of ash fillers in polypropylene Figure 6. SEM micrograph of the fracture surface of CaCO 3 fillers in polypropylene  Vol. 2. No. 1 Processed Low NO x Fly Ash as a Filler in Plastics 27 Figure 7. SEM micrograph of the fracture surface of ash fillers in low density polyethylene Figure 8. SEM micrograph of the fracture surface of CaCO 3 fillers in low density polyethylene  28 X. Huang, J. Y. Hwang, and J. M. Gillis Vol.2, No.1 Figure 9. SEM micrograph of the fracture surface of ash fillers in high density polyethylene Figure 10. SEM micrograph of the fracture surface of CaCO 3 fillers in high density polyethylene  Vol. 2. No. 1 Processed Low NO x Fly Ash as a Filler in Plastics 29 Demonstration of Commercial Manufacturing A VanDorn, Model #75-RS-4F, injection machine was used to process the ash filled compounds. With VanDorn being a large and well established producer of injection molding machines, the use of this machine would provide a very good representation of the typical injection molding machine used today. Injection of the trim clip was carried out first because it was a much smaller component and in-turn would not be as difficult as to clean up should the experimental materials prove difficult to inject. Yet all went smoothly, material flowed well, cavities were filled uniformly, lines were well defined and parting of the product was realized without the addition of a mold release. The operators, as well as the owner of the business went on to say that they could not distinguish between the operation of the machine using the experimental compounds and the commercial materials typically used to produce the trim clips. Figure 11 shows the parts produced from one of the polymers with ash filler. The injection of the GM wiring harness support proceeded just as smoothly. Though the shape was of a nature that considerably more resistance would be encountered, the material readily filled the cavities. Adjustments were made to the injection pressure, holding pressure and back pressure yet the new settings were typical of what would be expected given the nature of the die and not a result of the variation in the compound being injected. Figure 12 presents the GM wiring harness supports produced from one of the ash filled polymers. Figure 11. Parts produced from the polymer with ash filler  30 X. Huang, J. Y. Hwang, and J. M. Gillis Vol.2, No.1 Figure 12. GM wiring harness supports produced from one of ash filled polymers With the mechanical testing of the tests specimens, produced in the lab, serving to establish the physical properties of the compounds, the primary concern with regard to quality of the products produced was the resulting surface finish. Those materials containing 10 phr displayed very smooth somewhat glossy surfaces. Injection of those compounds containing 20 phr produced parts that had a somewhat opaque finish, yet it was still a very smooth surface. The parts coming out of the mold as the compounds containing 40 phr were feed to the barrel displayed an uneven surface that was dull in nature and revealed flow patterns in many cases. An operator was quick to point out that this was not at all uncommon with compounds containing a considerable amount of filler. He even produced parts that they regularly manufacture for comparison, which, from the surface, displayed the same characteristics with regard to the surface quality. Overall the injection of the ash filled compounds went very smoothly. There were no major problems encountered and the resulting products indicated that a quality finish could be expected when using these materials in the injection molding of commercial products. Which polymers would be best suited for compounding with ash would still need additional study, yet as indicated by this preliminary study, their use as a filler in both high and low density polyethylene as well as polypropylene would certainly be expected to yield considerable benefit. Conclusions AEP as-received low NO x ash can be processed to produce fine clean powders with the characters suitable for plastic filler application. The particle size distribution is narrower than that of two comparable commercial fillers. However, the brightness is about 24, much lower than that of commercial calcium carbonate filler and alumino-silicate filler, which limits its uses to darker color applications. The unique spherical shape can be an advantage over most existing commercial fillers.  Vol. 2. No. 1 Processed Low NO x Fly Ash as a Filler in Plastics 31 The polypropylene, low density and high density polyethylene compounds with fine clean ash filler have equivalent or better moldability for producing articles in comparison with the commercial calcium carbonate filler, Gama-Sperse CS-11. In general, the polypropylene and high density polyethylene with fine clean ash filler show equivalent or better strengths and Young's modules, but the elongation is not as good as those of the same polymers with the commercial calcium carbonate filler, Gama-Sperse CS-11. The low density polyethylene with the fine clean ash filler shows superiority over the same polymer with calcium carbonate filler in all measured mechanical properties at various loading levels. The ash filler coated with Dow Corning Z-6032 silane appear to offer very good bonding with the polypropylene as well as the low density and high density polyethylene matrixes. The polymers with ash filler can be used to produce commercial automotive parts with no difference in injection moldability, dimension accuracy and surface quality in comparison with the commercially filled polymer compounds. Acknowledgement Funding for this project has been provided by a grant from the U.S. Department of Energy under contract PRDA No. DE-RA21-93MC30056. References 1. C. Plowman and N.B. Shaw, "Use of Pulverized Fuel Ash as a Filler in Plastics," AshTech'84 - Conference Proceedings, London, England: Central Electricity Generating Board, 1984, pp.663-670; Conference: 2. International Conference on Ash Technology and Marketing, London, UK, 17 Sept. 1984. 2. G. J. Jablonshi, "Fly Ash Utilization as an Extender in Plastics and Paints," Proceedings: Eighth International Ash Utilization Symposium: Volume 2; Oct. 1987, pp. 38.1-38.15; Availability: NTIS, PC A20-Research Reports Center, Box 50490, Palo Alto, CA. 3. X. Huang, J.Y. Hwang and R. Tieder, "Clean Fly Ash as Fillers in Plastics," Proceedings: 11th International Symposium on Use and Management of Coal Combustion By-Products (CCBs), Volume 1, January 1995, pp33-1. 4. Final Report - Utilization of Low NO x Coal Combustion By-Products. Houghton, Mich.: Institute of Materials Processing at Michigan Technological University, funded by U.S. Department of Energy, PRDA No. DE-RA21-93MC30056, 1996. |