Paper Menu >>
Journal Menu >>
 Journal of Minerals & Materials Characterization & Engineering, Vol. 1, No.1, pp39-60, 2002 Printed in the USA. All rights reserved 39 Unburned Carbon from Fly Ash for Mercury Adsorption: I. Separation and Characterization of Unburned Carbon J. Y. Hwang, X. Sun, Z. Li Institute of Materials Processing, Michigan Technological University, Houghton, Michigan 49931 Abstract In searching for a low cost adsorbent for mercury removal from flue gas, this study focuses on the utilization of unburned carbons from fly ash as the substitute material for the costly activated carbons. In this first paper of the series, various separation technologies are introduced for the extraction of unburned carbon from different sources of fly ash. The unburned carbons have been efficiently separated from clean ash, which is a value-added product for the concrete industry, with the separation technologies such as gravity separation, electrostatic separation, and froth flotation. Carbon concentrate with a LOI (Loss On Ignition) value of 67~80% has been generated from the processes. Characterization of the carbon products has been performed to determine the physical and chemical properties of the material. It has been found that the unburned carbon particles had a porous structure, which is similar to the activated carbon. The BET surface area of these materials was in a range of 25~58m 2 /g. The majority of the pores are in the range of macropore, and some parts of the surface were embedded with glass spheres. There is a linear relationship between the LOI value and the carbon and sulfur content in the carbon concentrate. Chemical analysis indicated that the mercury content in unburned carbon was much higher than the other separation products, which suggests that the carbon has certain ability to capture mercury from flue gas. Introduction Mercury has long been known as a potential health and environmental hazard. It is identified as one of the 189 toxic air pollutants by the Clean Air Act Amendments of 1990. Mercury emissions are of particular concern because mercury accumulates in the biosystem, is very difficult to monitor and capture, and is high in the public consciousness. Coal combustion accounts for 80% of the total energy consumption by the utility industry and all coals contain some level of mercury. Since mercury is a highly volatile element, when the coal is burned, most of the naturally occurring mercury will be released as a vapor phase into the atmosphere. According to the EPA Mercury Study Report, [1] the annual mercury emission rate during years of 1994-1995 is estimated to be 158 tons, of which 33% is from coal-fired utility boilers, the largest among the four major mercury emission sources. (The other three are municipal waste combustion (19%), commercial/industrial boilers (18%) and medical waste incinerators (10%).)  40 J. Y. Hwang, X. Sun and Z. Li Vol. 1, No. 1 To cope with the mercury emission problem, efforts have been made to remove various mercury species from the flue gas of utility boilers. However, due to technical and economic limitations, no process has been commercially utilized beyond pilot scale tests. Among the current technologies being evaluated, activated carbon injection is the most promising process for removing mercury from flue gas due to its high removal efficiency. [2-6] In this process, activated carbon powder is injected into the flue gas stream and collected, after adsorption, with a particulate matter control device. However, the high cost of activated carbon hinders the large-scale applications in utility boilers. [1] Therefore, there is a desire to find an alternative carbon.. Fly ash is a by-product generated from the burning of pulverized coal in coal-fired facilities such as utility boilers. Because fly ash is composed of very fine solid particles, it must be captured from flue gas before being introduced into atmosphere. Every year, according to a survey of American Coal Ash Association (ACAA) in 1996, there are about 54 million tons of fly ash generated in USA from all coal-fired utilities. Therefore, beneficial use of fly ash becomes a major issue in both environmental and economic perspectives. Currently, the biggest market for fly ash is in concrete applications as an additive for cement. One of the criteria for such application is that the carbon content or the LOI (loss-on-ignition) limit must be lower than 6% according to ASTM standard 618 and lower than 3% in market practice. [7] Usually the carbon content in fly ash is in the range of 2-12%. However, with the introduction of the 1990 Clean Air Act Amendments, caps have been established on the emission of nitrogen oxides (NO x ). Many coal-fired utilities have started to retrofit with low NO x burners to meet the emission requirements. As a result of such transition, the carbon content of fly ash increases significantly, up to 20% in some cases, due to the low oxygen and/or low temperature combustion conditions that are required by those low NO x combustion units. Therefore, the carbon content in fly ash needs to be reduced before the low NO x fly ash can be utilized in concrete applications. Since the unburned carbon separated from fly ash is a byproduct, any practical application of such material would be economically and environmentally advantageous to the overall fly ash beneficiation process. Preliminary study has shown that some unburned carbon from fly ash has certain capabilities of adsorbing elemental mercury. Such findings triggered the idea of using fly ash carbon as a low cost adsorbent in removing elemental mercury from gas phases such as utility flue gas, in replacement of costly activated carbons. [8-13] This series of papers presents the research efforts that have been conducted to separate unburned carbon from fly ash, the characterization of the carbon, the mercury adsorption tests of the carbon at various conditions, as well as the elucidation of the relations between adsorption behavior of unburned carbons and their surface physical and chemical properties.  Vol. 1, No. 1 Unburned Carbon from Fly Ash for Mercury Adsorption 41 Separation technologies As mentioned earlier, the main purpose of separating unburned carbon from fly ash is to obtain high quality fly ash for concrete applications. Another incentive for a well-established separation technology is that, to efficiently utilize fly ash, high value products must be generated from raw ashes to counter balance the transportation cost of the material. According to the characterization study on different fly ash samples, [14] it has been found that the major mineral components in fly ash are silicates, iron oxides, low-density silicates (cenospheres) and unburned carbons. These particulate mineral materials, after various treatments, can be used as fillers in plastics, reinforcement material in metal matrix composites, as well as refractory materials. [5] Particularly according to this study, the unburned carbon can be used as an adsorbent in removing hazardous substances such as mercury in flue gas. By separation of individually functional components, fly ash is converted from a completely waste material into various high value-added products. Usually, there are four major processing techniques for the physical separation of various components from fly ash, i.e. gravity separation, electrostatic separation, magnetic separation, and froth flotation. The gravity separation process can be used to separate dense particles with light particles, here in this special case, to extract unburned carbon from the coarse fraction of fly ash. This coarse fraction of fly ash has a high LOI value and is difficult to process with other techniques such as froth flotation. Also, the process is useful in separating hollow cenospheres, which have a specific gravity of about 0.64. The electrostatic separation is used to separate particulate materials with different electrical conductivity. Under a high electrostatic field, the less conductive particles are polarized while the conductive particles are not, so that a high-tension drum can pick up the polarized particles to make the separation. This process is suitable for the separation of relatively coarse materials, such as particles of +100 mesh. Froth flotation is a widely used separation technique in mineral processing industry. In the slurry of solid and water, physico-chemical processes take place at the interface of solid, liquid and gas phases, during the process of froth flotation. A collector selectively coats the surfaces of certain mineral particles causing the surface of one or more of the components in the slurry to become hydrophobic and responsive to the attachment of air bubbles introduced into the slurry. Separation is accomplished as the mineral-laden air bubbles rise to the surface in a froth (or a concentrate) which flows over a weir, leaving in the slurry particles that are not coated with the collector. These pass out the bottom of the cell. Under proper conditions, almost all materials can be made to float. Success depends on the capability to control the surface chemistry to yield selective adsorption of collectors. A second reagent, known as a frother, is used to stabilize the air bubbles upon which the floatable minerals become attached.  42 J. Y. Hwang, X. Sun and Z. Li Vol. 1, No. 1 The froth flotation process to separate unburned carbon from fly ash has been developed by Michigan Technological University. A target of less than 1% carbon in clean ash with 90% or more recovery, or 80% of LOI in the carbon concentrate with 70% or more recovery of total carbon, can be achieved with this process. [15,16] In this study the froth flotation was used to separate unburned carbon from the –100 mesh portions of fly ash samples. Froth flotation is the most common physical separation technology utilized in the mining industry because of its reliability, low maintenance, and economics. The iron oxide component in fly ash can be extracted with the magnetic separation process. Because iron oxides are strong paramagnetic materials, the separation efficiency is well established. In this paper, as the first step of the series, various separation techniques for unburned carbon will be introduced for the fly ashes from different sources, and results of characterization for the separation products will also be presented in detail. Experimental Three representative fly ash samples from different power plants were used in the separation tests. Since froth flotation is suitable for separation of particulate materials at sizes of –100 mesh, the fly ash samples were screened in order to obtain the coarse portion +100 mesh. The separation of unburned carbon from the coarse portion was carried out with gravity separation followed by electrostatic separation. The fine portion was fed into flotation circuit for carbon separation. A diagonal-deck concentration table (Wilfley table), Super Duty RH15S SD, was used for the gravity separation. The tilt angles, stroke and length as well as the flow rate of wash water were adjusted to the optimum levels. For each experiment run, the material was fed to the table through a vibrating feeder. The feed rate was determined by the dry weight of the samples taken at an interval of 15 to 30 seconds. Three separation products were obtained at the end of the process, i.e. carbon concentrate, clean ash product, and middlings. The electrostatic separation was carried out with an Eriez electrodynamic electrostatic separator. The test conditions are listed as following, Exiting voltage: 18 kV, Drum speed: 60 rpm, Angle of the ionizing electrode: 31 o , Angle of the static electrode: 17 o , The froth flotation tests were carried out in a pilot plant operation running at 200 lb/hr. Fly ash was mixed with water at 20% solid content, and the slurry was fed into a tank where the cenospheres were skimmed off from the top since they have a density lower than that of water. Then the slurry was fed into a magnetic drum separator to recover the magnetic spheres. After magnetic separation, the slurry was conditioned with an oil (fuel oil #2) collector at a dosage of 2 lbs./ton (Fuel oil at this dosage was proved  Vol. 1, No. 1 Unburned Carbon from Fly Ash for Mercury Adsorption 43 not damaging to mercury adsorbability in a separate study). The oil has an affinity for carbon and is preferentially adsorbed on the carbon particles. The slurry was then fed into a flotation machine where air was bubbled through it. During flotation, the rising air bubbles collided with the oil coated carbon particles and attached themselves to these particles due to a hydrophobic interaction. This caused the carbon particles to float to the top of the flotation cell, where they were skimmed off. This flotation operation left the clean ash in the cell and the carbon fraction was transferred to another flotation cell and re-floated in order to upgrade the carbon content in the carbon concentrate. The reject from the carbon-refloat operation was then returned to the first flotation cell. The effectiveness of separation was evaluated with LOI value analyzed at 950 o C in the presence of air. Densities of the separation products were measured with a pycnometer, Accupyc 1330 (Micromeritics). Helium was used as the measurement medium. Five data points were taken for each sample, and the average number was reported with a standard deviation of less than 0.0010 g/cm 3 , for a density range of 0.6 g/cm 3 to 2.5 g/cm 3 . The particle size distribution of the unburned carbon was analyzed with a particle size analyzer, Microtrac (Micromeritics), in combination with the sieving method. The surface morphology was investigated with a Scanning Electron Microscopy, JEOL 850. The surface area and the pore structure were analyzed with FlowSorb II 2300, Micromeritics. The chemical composition of ashes and their components were determined with AA and ICP spectroscopy. Mercury content of ash components was analyzed with a Manual Cold Vapor AAS technique, according to the EPA Method 7471. Separation Results Gravity separation. Three fly ash samples representing different classes of ashes were tested in the experiment. FA1 fly ash is a Class F ash, FA2 a mixture of Class F and Class C ash, and FA3 a Class C ash (based on ASTM classification). In general, Class F ash is the combustion residue of the bituminous coal and Class C ash is the residue from sub-bituminous coal and lignite. Figure 1 shows the particle size distributions associated with the LOI values of as-received ash sample. For ash samples FA2 and FA3, it can be seen from the figure that the LOI value increases as the particle size increases. For the FA1 sample, however, the LOI value increases with the particle size until it reaches 65 mesh (175 µm), and the LOI value becomes lower when the particle size is at 465 µm. Such difference may be attributed to the rank of the coal sources and the initial sizes of the coal as well as the combustion flue gas and particulate collector conditions (For example, high flue gas velocity may carry more coarse particles into electrostatic precipitation). Since the gravity separation is suitable for the coarse particles, only +100 mesh fractions of the fly ash samples were tested with this method. Tables 1-3 list the separation results for each fly ash sample. The head +100 mesh ashes had LOI values from 36% to 42%,  44 J. Y. Hwang, X. Sun and Z. Li Vol. 1, No. 1 whereas the carbon concentrate for each fly ash sample, as a separation product, has a much higher LOI value, from 63% to 66%. The LOI recovery in the carbon concentrate ranged from 84% to 95%. The clean ash, as the other product, had a very low LOI value for the FA1 sample, at 0.03%. Reasonably low LOI values were also obtained for FA2 and FA3 samples. Electrostatic separation. Although separation of unburned carbon with clean ash had been achieved with the gravity separation method, the LOI values in carbon concentrates were still relatively low. Microscopic examinations indicated that there were some siliceous materials with porous structure in the carbon concentrates. Hence, to further concentrate the unburned carbon, the electrostatic separation method was used, based on the fact that the unburned carbon particles are conductive while the siliceous particles are not. Carbon concentrates derived from the gravity separation tests were subjected to two stages of electrostatic separation, i.e. a rough and a scavenging stage respectively. Results of bench scale tests were shown in Figure 2. The FA2 sample had the best separation, the LOI value increased from 66% to 80% with a yield of 76%. The FA1 sample had an upgrade in LOI from 63% to 79% with a yield of 73%, and the FA3 sample from 65% to 70% with a yield of 79%. Froth flotation. Table 4 shows the results of separation with froth flotation of FA1 sample (-100 mesh fraction). It can be seen that the LOI value in the carbon concentrate increased to 67.7% from 21.7% of the head sample, and the LOI value was greatly reduced to 0.40% in the clean ash, which indicates that the clean ash is suitable for the concrete applications. These results demonstrate that the froth flotation is effective in extracting the unburned carbon from fly ash. Characterization Results and Discussion Density measurement of the fly ash components. The densities of fly ash separation products were measured with a pycnometer so as to set up a guideline for the separation process. As mentioned before, a fly ash can be separated into components such as clean ash, unburned carbon and cenospheres, according to their differences in density. The criterion for separation ability as based on the differences in density (i.e. gravity separation) is a parameter called the separation index (SI), which is defined as SI=(D d -D f )/(D t -D f ), where D d is the density of dense particles, D t is the density of light particles, and D f the density of the fluid medium. Usually, the gravity separation is effective when SI is greater than 2.5, and is difficult when SI is lower than 1.25. However, the size and the shape of the particles also play an important role in the gravity separation. Table 5 lists the density measurement results for each component of the fly ash samples. Also listed are the densities of ash components from electrostatic separations,  Vol. 1, No. 1 Unburned Carbon from Fly Ash for Mercury Adsorption 45 specified as ES-ash. The ash component, also known as the siliceous particles, had the highest density (2.3g/cm 3 to 2.4 g/cm 3 ), and the carbon component had a density of 2.0 g/cm 3 , whereas the ES-ashes had a lower density of 1.7 to 2.0 g.cm 3 . Cenospheres had the lowest density among these components, with a density of 0.68 g/cm3, which is lower than water. The SI between the ash and unburned carbon ranges from 1.46 to 1.06, which explains the difficulty of gravity separation in some cases. Correlation of LOI values with carbon and sulfur content. The LOI value has been used extensively in this study to express the carbon content of the ashes and their components, due to the fact that the determination of LOI is much easier than the carbon analysis. Because the LOI value includes primarily the carbon and sulfur contents, it is possible to derive a relationship between these three parameters, provided that the later two follow a certain pattern with the LOI values. Figures 3-5 shows the relationship between the carbon/sulfur contents and LOI values for the three fly ash samples. The data points represent the results from clean ash, middlings (gravity), electrostatic rejects, carbon concentrate (gravity), and electrostatic conductive, respectively. A linear trend was observed for all three samples. Particle size distribution of carbon concentrates. Carbon particle size is an important factor in the adsorption applications. For a fix bed adsorber, the carbon particles must be large to keep the bed sufficiently packed; while for a carbon injection method, the particles should be relatively fine to be spread into the gas stream. Figure 6 shows the size distribution of the carbon concentrate from various ash sources. From the figure it can be seen that most of the particles are in the range of 200 to 400 µm. Figure 7 shows the size distribution of the carbon concentrate from FA1 samples separated with froth flotation. In this case, most of the particles are under 140 µm. Therefore, for fixed bed adsorption, pelletization of the carbon particles will be needed. Morphologies of unburned Carbon. Figure 8 shows an SEM image of unburned carbon from the FA1 sample. The porous structure of the particle is clearly seen from the photo, indicating that the unburned carbon is a good candidate for the adsorbing material. Within the resolution range of SEM, macropores of 1 to 10 µm are observed and also visible are micro-sized glassy spheres embedded in the carbon particle. These glassy spheres may be formed during combustion and they may have some influence on the adsorption properties of the unburned carbon, which will be discussed in details in the following papers of the series. Surface area and pore structure of unburned carbon. Surface area, pore structure, and surface chemistry are the critical parameters of a sorbent. In general, the higher the surface area, the greater the adsorption capabilities. For example, the most commonly used adsorbent – activated carbon usually has a surface area of 800 to 1200 m 2 per gram of the material. The pore structure of the material includes the porosity, the pore size and the pore size distribution. Pores of different sizes serve different functions in the adsorption process. Macropores (>50 nm) act as a conduit for the bulk medium;  46 J. Y. Hwang, X. Sun and Z. Li Vol. 1, No. 1 mesopores (2~50 nm) and micropores are the primary source of the active adsorption sites. Surface chemistry will be discussed in the following paper. Surface areas of the carbon concentrates and activated carbons (F-400, BPL, from Calgon Co.) as references were measured with BET method and results are presented in Table 6. From the data listed in the table, it can be seen that the specific surface area of unburned carbon is in a range of 25 to 58 m 2 /g, which is much lower than the activated carbon (945 m 2 /g for F-400). This can be explained by the fact that the unburned carbon has not experienced an activation process during the combustion, collection and separation processes as activated carbon experiences, although the steam in the combustion gas may have caused a limited extent of activation. Not surprisingly, the micro pore volume of the unburned carbon is very low in comparison with the activated carbon. The volume of pores between 17-3000 Å was in a range of 0.033 to 0.059 ml/g, according to the nitrogen adsorption tests. Thus, most of the pore volume is taken by the macropores as observed with SEM. Chemical analysis of unburned carbon. Since the focus of this study is to use the unburned carbon for mercury removals, only the chemical analysis for unburned carbon is reported in this paper. Unburned carbon samples from the above mentioned separation processes were analyzed for their chemical compositions, and Table 7 lists the results of the analysis. Due to the fact that fly ash came out from a high temperature environment, the major elements were reported as oxides, except carbon and sulfur. It can be seen that all the unburned carbons have certain ash contents, which are mainly composed of siliceous materials. The results of trace element analysis are presented in Table 8. Apparently the mercury content in unburned carbon is much higher than that in clean ashes. To further illustrate how mercury is distributed, the mercury contents of fly ashes as well as their components are analyzed, and the results are shown in Table 9 (The data was based on the products of whole beneficiation process). It is obvious that the mercury concentration in the carbon concentrates is almost 100 times higher than the other separation products. In other words, the unburned carbon in fly ash captured certain amount of mercury during the process, which provides two important findings. First, since the majority of the mercury carried by fly ash is in the carbon concentrate, the detoxification of fly ash in terms of mercury can be achieved by removing carbon from the fly ash and carbon cleansing thereafter. Second, the abnormally high content in the carbon concentrate indicates that the unburned carbon has a high affinity to mercury that is released during coal combustion. Therefore, it is possible to use unburned carbon separated from fly ash as the adsorbent for the mercury in the flue gas. Since the unburned carbon is almost a no-cost material, the cost of flue gas cleansing for mercury can be greatly lowered, so that the implementation of carbon adsorption technology for industrial facilities can be accelerated. It has also been found that the mercury content in carbon concentrates is proportional to the LOI value for each sample. Figure 9 shows the correlation between  Vol. 1, No. 1 Unburned Carbon from Fly Ash for Mercury Adsorption 47 the mercury content of various separation products derived from the three fly ashes, and it can be seen that there is an almost linear relationship between them. This finding further indicates that the mercury is associated with the unburned carbon in fly ash. Acknowledgment 1. EPA, Mercury Study Report to Congress, 1997, EPA-452/R-97-10 2. Clarke, L. B.; Sloss, L. L. IEA Coal Research, IEACR/49, 1992, July. 3. White, D. M.; Kelly, W. E.; Stucky, M. J.; Swift, J. L.; Palazzolo, M. A. Field test of carbon injection for mercury control: Canden County municipal waste combustor. Prepared for Office of Research and Development, U.S. EPA, Washington, D.C. EPA-600/R-93-181 (PB94-101540) 4. Miller, S.; Laudal, D.; Dunham, G. Proceedings of Eleventh Annual Coal Preparation, Utilization, and Environmental Control Contractors Conference, Pittsburgh, Pennsylvania, 1995, July. 5. Ramsay Chang ; Preparation and Evaluation of Coal-Derived Activated Carbons for Removal of Mercury Vapor from Simulated Coal Combustion Flue Gases, Energy & Fuels; 1998; 12(6); 1061-1070. 6. Paul F. Sanders ; Kinetics of Mercury(II) Adsorption and Desorption on Soil, Environmental Science & Technology; 31(2); 496-503. 7. Hwang, J. Y.; Huang, X.; Gillis, J. M. Proceedings: 13 th International Symposium on Use and Management of Coal Combustion Products (CCPs), 1999, 1, 19-1-19- 22. 8. Shannon D. Serre* and Geoffrey D. Silcox ; Adsorption of Elemental Mercury on the Residual Carbon in Coal Fly Ash, Industrial & Engineering Chemistry Research; 2000; 39(6); 1723-1730. 9. Tanaporn Sakulpitakphon, James C. Hower,* Alan S. Trimble, William H. Schram, and Gerald A. Thomas; Mercury by Fly Ash: Study of the Combustion of a High- Mercury Coal at a Utility Boiler, Energy & Fuels; 2000; (3); 727-733. 10. James C. Hower,* M. Mercedes Maroto-Valer, Darrell N. Taulbee, and Tanaporn Sakulpitakphon ; Mercury Capture by Distinct Fly Ash Carbon Forms, Energy & Fuels; 2000; 14(1); 224-226. 11. James C. Hower,* Robert B. Finkelman, Robert F. Rathbone, and Jennifer Goodman; Intra- and Inter-unit Variation in Fly Ash Petrography and Mercury Adsorption: Examples from a Western Kentucky Power Station, Energy & ; 2000; 14(1); 212-216. 12. P. Fermo, F. Cariati, S. Santacesaria, S. Bruni, M. Lasagni,# M. Tettamanti,# E. Collina,# and D. Pitea*# ; MSWI Fly Ash Native Carbon Thermal Degradation: A TG-FTIR Study, Environmental Science & Technology; 2000; 13. Hwang, J.Y. and Li, Z., “Control of Mercury Emissions Using Unburned Carbon From Combustion By-Products,” U.S. Patent 6,027,551 (2000). 14. Hwang, J.Y., Hein, A.M., Kramer, R.S., Liu, J., Hozeska, T.J., Zhang, Q., and Scott, T.E., “Application of Characterization on Fly Ash Beneficiation to Produce Quality Controlled Products,” Process Mineralogy XI: Characterization of Metallurgical and Recyclable Products, 1991, pp. 167-180.  48 J. Y. Hwang, X. Sun and Z. Li Vol. 1, No. 1 15. Hwang, J.Y., Liu, X., Zimmer, F.V., Thiruvengadam, T.R., and Patzias, T., “Beneficiation Process for Fly Ash and Utilization of Cleaned Fly Ash for Concrete Application,” Proceedings: 11 th International Symposium on Use and Management of Coal Combustion By-Products, Vol. 1, Paper 11, EPRI Publication, 1995. 16. Hwang, J.Y., “Wet Process for Fly Ash Beneficiation,” U.S. Patent 5,047,145 (1991), and 5,227,047 (1993). 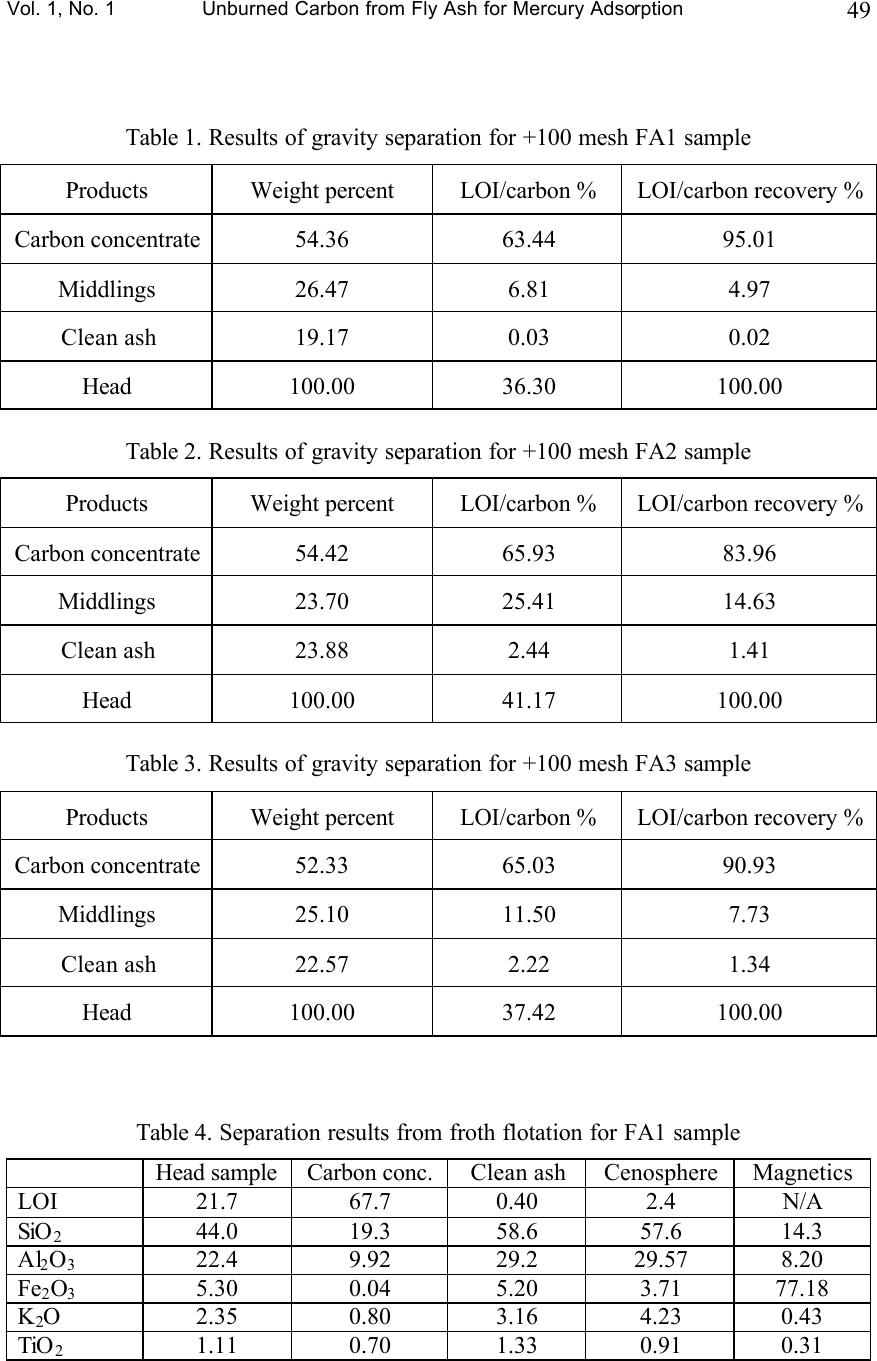 Vol. 1, No. 1 Unburned Carbon from Fly Ash for Mercury Adsorption 49 Table 1. Results of gravity separation for +100 mesh FA1 sample Products Weight percent LOI/carbon % LOI/carbon recovery % Carbon concentrate 54.36 63.44 95.01 Middlings 26.47 6.81 4.97 Clean ash 19.17 0.03 0.02 Head 100.00 36.30 100.00 Table 2. Results of gravity separation for +100 mesh FA2 sample Products Weight percent LOI/carbon % LOI/carbon recovery % Carbon concentrate 54.42 65.93 83.96 Middlings 23.70 25.41 14.63 Clean ash 23.88 2.44 1.41 Head 100.00 41.17 100.00 Table 3. Results of gravity separation for +100 mesh FA3 sample Products Weight percent LOI/carbon % LOI/carbon recovery % Carbon concentrate 52.33 65.03 90.93 Middlings 25.10 11.50 7.73 Clean ash 22.57 2.22 1.34 Head 100.00 37.42 100.00 Table 4. Separation results from froth flotation for FA1 sample Head sample Carbon conc. Clean ash Cenosphere Magnetics LOI 21.7 67.7 0.40 2.4 N/A SiO 2 44.0 19.3 58.6 57.6 14.3 Al 2 O 3 22.4 9.92 29.2 29.57 8.20 Fe 2 O 3 5.30 0.04 5.20 3.71 77.18 K 2 O 2.35 0.80 3.16 4.23 0.43 TiO 2 1.11 0.70 1.33 0.91 0.31 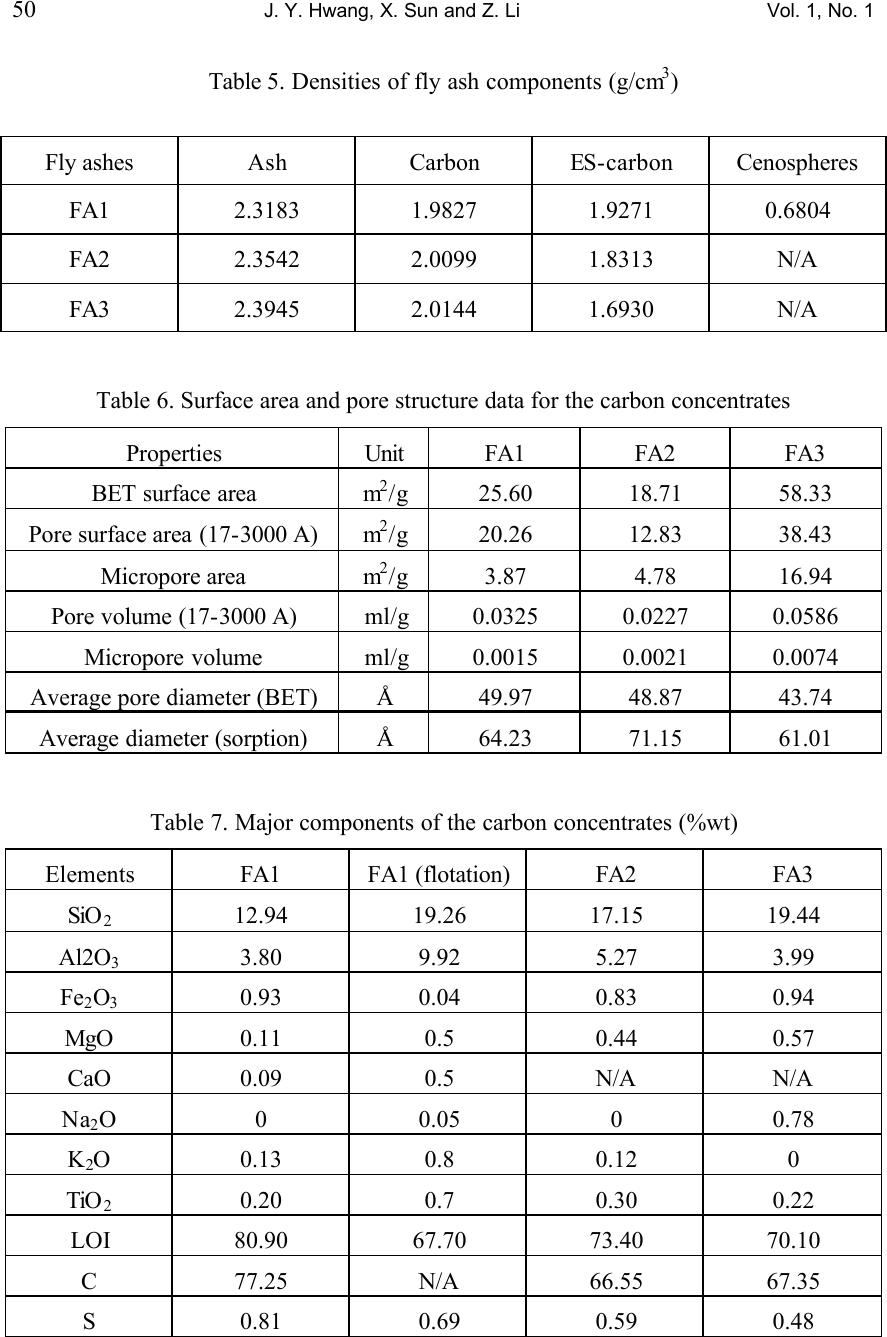 50 J. Y. Hwang, X. Sun and Z. Li Vol. 1, No. 1 Table 5. Densities of fly ash components (g/cm 3 ) Fly ashes Ash Carbon ES-carbon Cenospheres FA1 2.3183 1.9827 1.9271 0.6804 FA2 2.3542 2.0099 1.8313 N/A FA3 2.3945 2.0144 1.6930 N/A Table 6. Surface area and pore structure data for the carbon concentrates Properties Unit FA1 FA2 FA3 BET surface area m 2 /g 25.60 18.71 58.33 Pore surface area (17-3000 A) m 2 /g 20.26 12.83 38.43 Micropore area m 2 /g 3.87 4.78 16.94 Pore volume (17-3000 A) ml/g 0.0325 0.0227 0.0586 Micropore volume ml/g 0.0015 0.0021 0.0074 Average pore diameter (BET) Å 49.97 48.87 43.74 Average diameter (sorption) Å 64.23 71.15 61.01 Table 7. Major components of the carbon concentrates (%wt) Elements FA1 FA1 (flotation) FA2 FA3 SiO 2 12.94 19.26 17.15 19.44 Al2O 3 3.80 9.92 5.27 3.99 Fe 2 O 3 0.93 0.04 0.83 0.94 MgO 0.11 0.5 0.44 0.57 CaO 0.09 0.5 N/A N/A Na 2 O 0 0.05 0 0.78 K 2 O 0.13 0.8 0.12 0 TiO 2 0.20 0.7 0.30 0.22 LOI 80.90 67.70 73.40 70.10 C 77.25 N/A 66.55 67.35 S 0.81 0.69 0.59 0.48 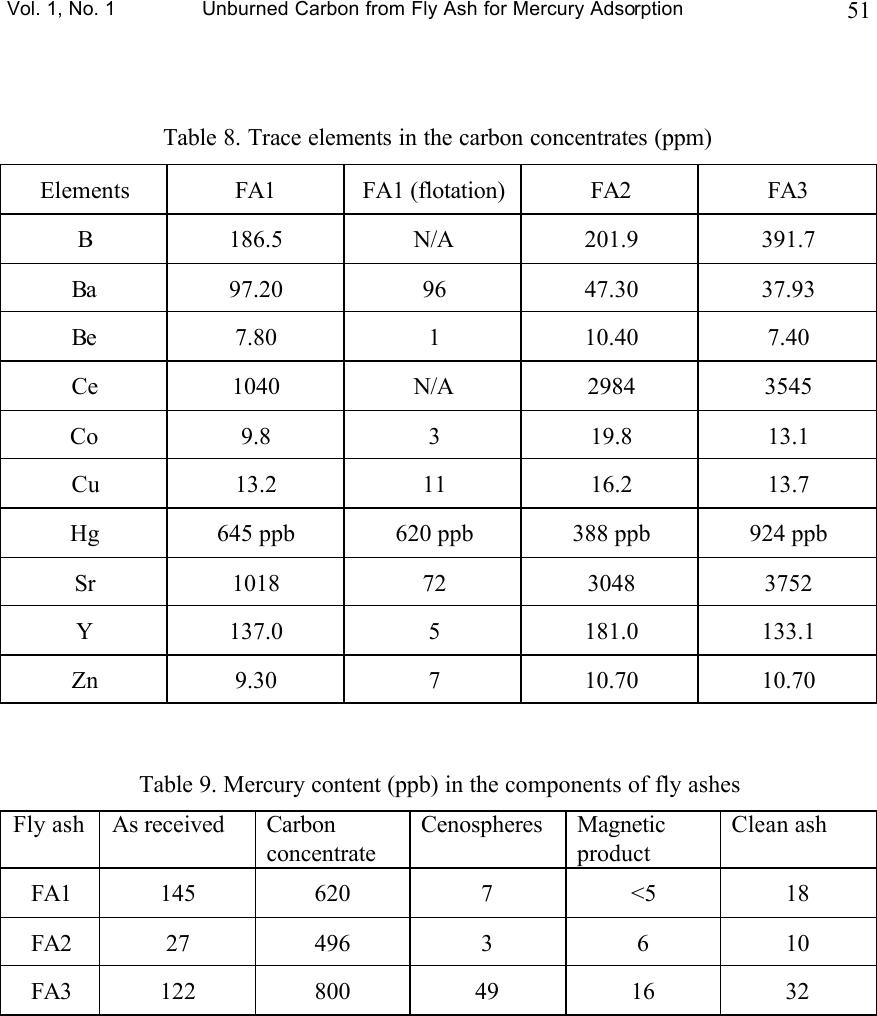 Vol. 1, No. 1 Unburned Carbon from Fly Ash for Mercury Adsorption 51 Table 8. Trace elements in the carbon concentrates (ppm) Elements FA1 FA1 (flotation) FA2 FA3 B 186.5 N/A 201.9 391.7 Ba 97.20 96 47.30 37.93 Be 7.80 1 10.40 7.40 Ce 1040 N/A 2984 3545 Co 9.8 3 19.8 13.1 Cu 13.2 11 16.2 13.7 Hg 645 ppb 620 ppb 388 ppb 924 ppb Sr 1018 72 3048 3752 Y 137.0 5 181.0 133.1 Zn 9.30 7 10.70 10.70 Table 9. Mercury content (ppb) in the components of fly ashes Fly ash As received Carbon concentrate Cenospheres Magnetic product Clean ash FA1 145 620 7 <5 18 FA2 27 496 3 6 10 FA3 122 800 49 16 32 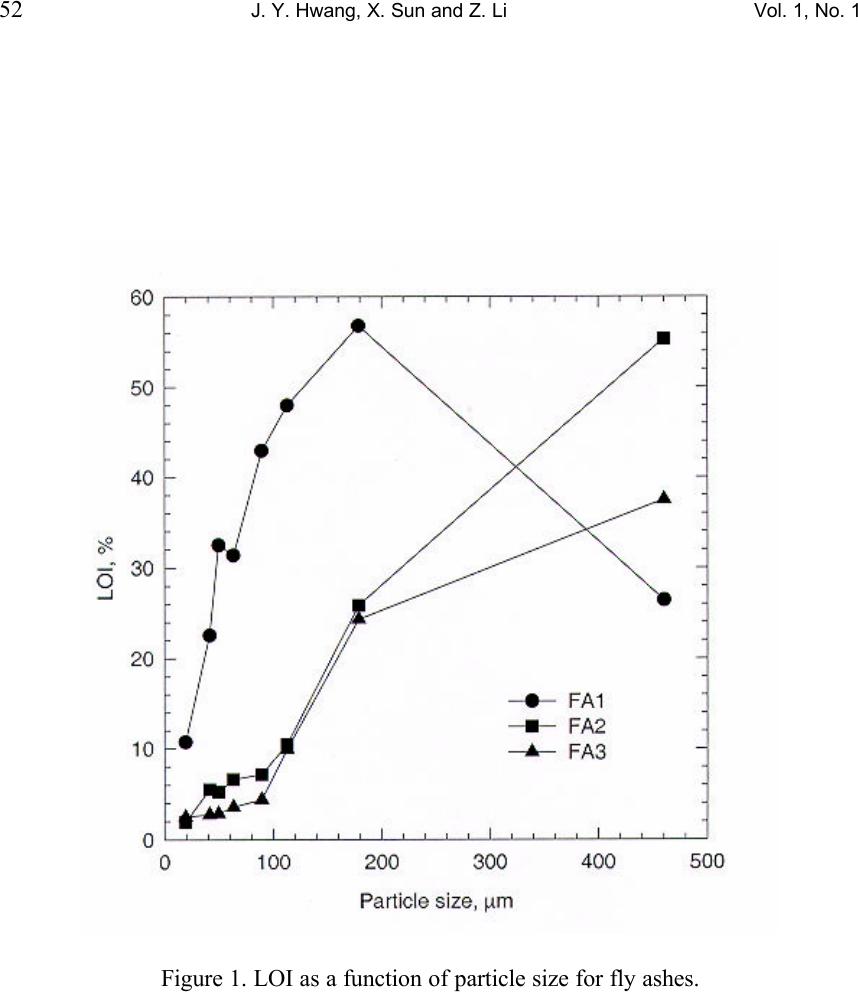 52 J. Y. Hwang, X. Sun and Z. Li Vol. 1, No. 1 Figure 1. LOI as a function of particle size for fly ashes. 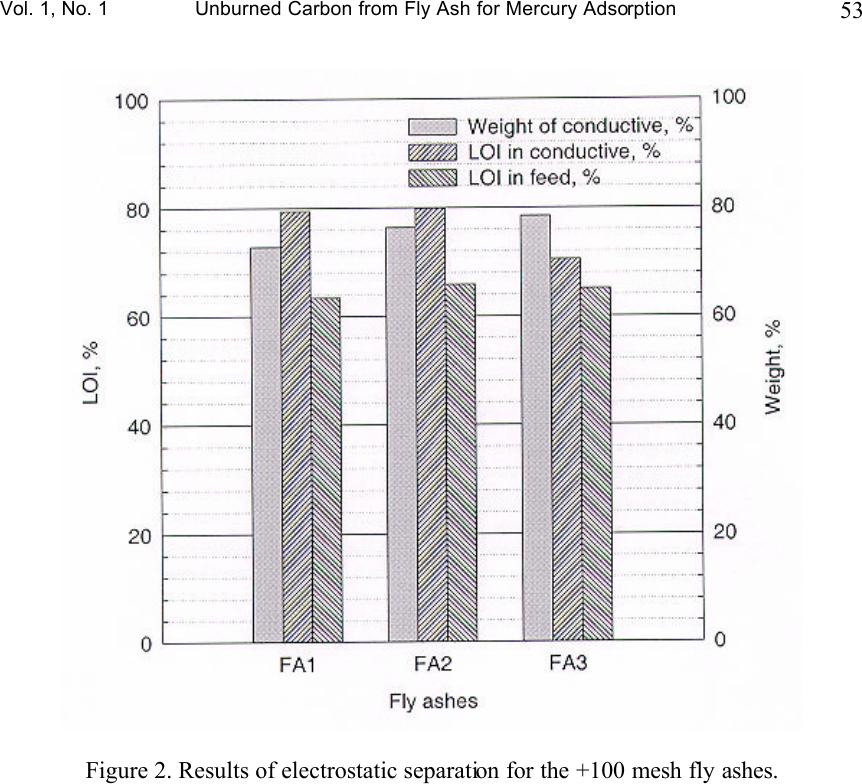 Vol. 1, No. 1 Unburned Carbon from Fly Ash for Mercury Adsorption 53 Figure 2. Results of electrostatic separation for the +100 mesh fly ashes.  54 J. Y. Hwang, X. Sun and Z. Li Vol. 1, No. 1 Figure 3. LOI versus carbon and sulfur content of FA1 sample.  Vol. 1, No. 1 Unburned Carbon from Fly Ash for Mercury Adsorption 55 Figure 4. LOI versus carbon and sulfur content of FA2 sample.  56 J. Y. Hwang, X. Sun and Z. Li Vol. 1, No. 1 Figure 5. LOI versus carbon and sulfur content of FA3 sample.  Vol. 1, No. 1 Unburned Carbon from Fly Ash for Mercury Adsorption 57 Figure 6. Particle size distribution of fly ash carbons.  58 J. Y. Hwang, X. Sun and Z. Li Vol. 1, No. 1 Figure 7. Size distribution of FA1 carbon separated with flotation.  Vol. 1, No. 1 Unburned Carbon from Fly Ash for Mercury Adsorption 59 Figure 8. SEM image of FA1 carbon particle  60 J. Y. Hwang, X. Sun and Z. Li Vol. 1, No. 1 Figure 9. Mercury content at different LOI values. |