Paper Menu >>
Journal Menu >>
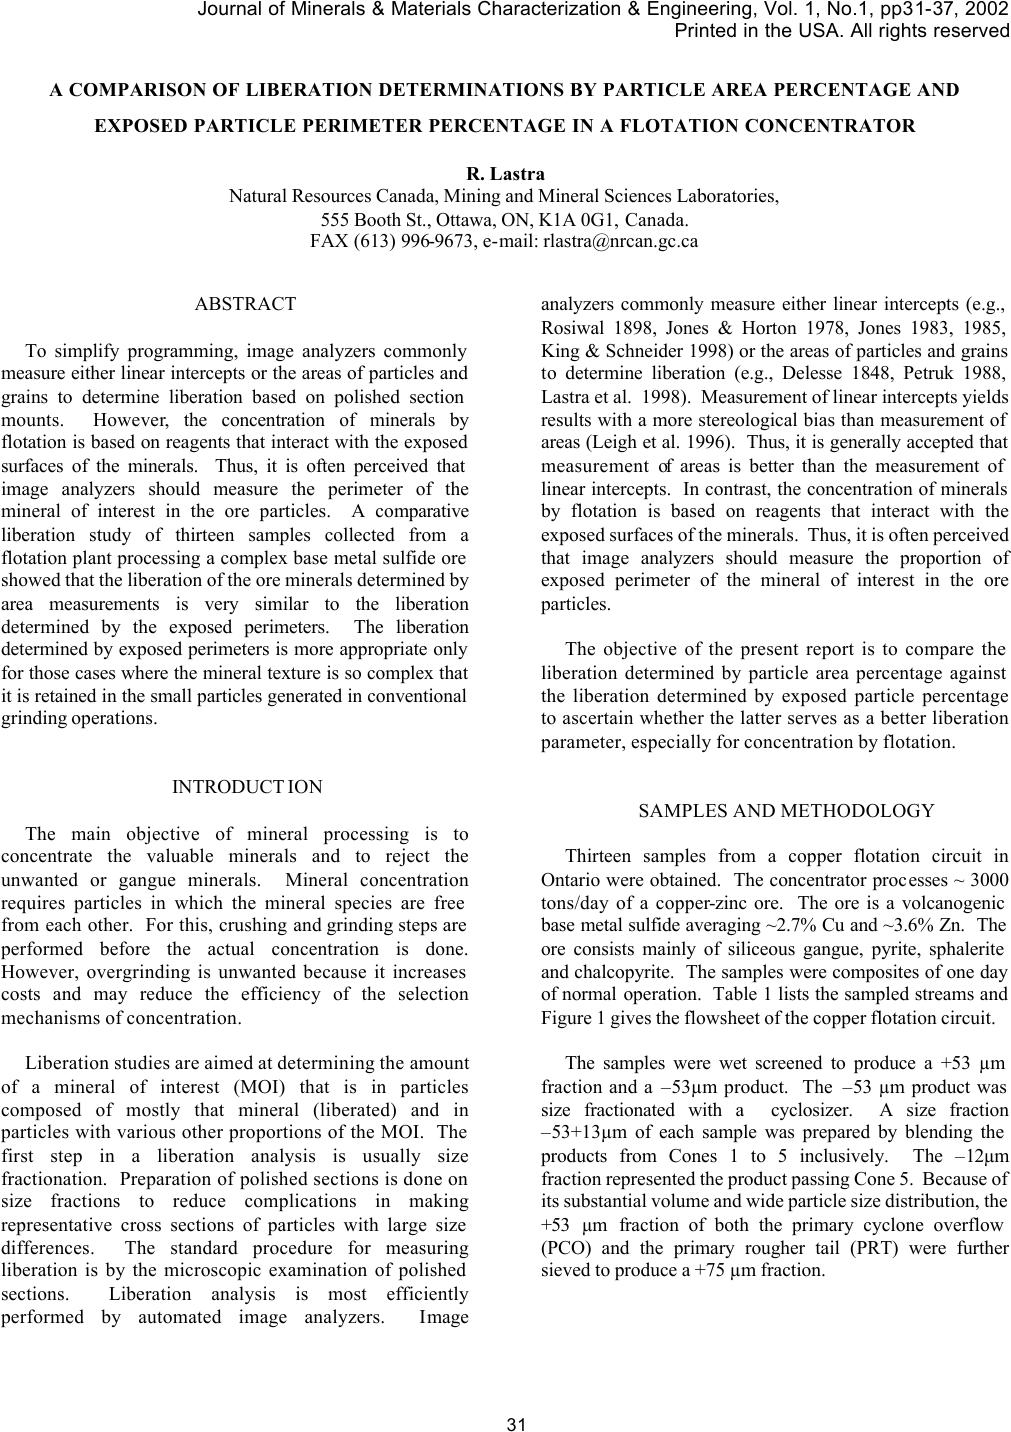 Journal of Minerals & Materials Characterization & Engineering, Vol. 1, No.1, pp31-37, 2002 Printed in the USA. All rights reserved 31 A COMPARISON OF LIBERATION DETERMINATIONS BY PARTICLE AREA PERCENTAGE AND EXPOSED PARTICLE PERIMETER PERCENTAGE IN A FLOTATION CONCENTRATOR R. Lastra Natural Resources Canada, Mining and Mineral Sciences Laboratories, 555 Booth St., Ottawa, ON, K1A 0G1, Canada. FAX (613) 996-9673, e-mail: rlastra@nrcan.gc.ca ABSTRACT To simplify programming, image analyzers commonly measure either linear intercepts or the areas of particles and grains to determine liberation based on polished section mounts. However, the concentration of minerals by flotation is based on reagents that interact with the exposed surfaces of the minerals. Thus, it is often perceived that image analyzers should measure the perimeter of the mineral of interest in the ore particles. A comparative liberation study of thirteen samples collected from a flotation plant processing a complex base metal sulfide ore showed that the liberation of the ore minerals determined by area measurements is very similar to the liberation determined by the exposed perimeters. The liberation determined by exposed perimeters is more appropriate only for those cases where the mineral texture is so complex that it is retained in the small particles generated in conventional grinding operations. INTRODUCTION The main objective of mineral processing is to concentrate the valuable minerals and to reject the unwanted or gangue minerals. Mineral concentration requires particles in which the mineral species are free from each other. For this, crushing and grinding steps are performed before the actual concentration is done. However, overgrinding is unwanted because it increases costs and may reduce the efficiency of the selection mechanisms of concentration. Liberation studies are aimed at determining the amount of a mineral of interest (MOI) that is in particles composed of mostly that mineral (liberated) and in particles with various other proportions of the MOI. The first step in a liberation analysis is usually size fractionation. Preparation of polished sections is done on size fractions to reduce complications in making representative cross sections of particles with large size differences. The standard procedure for measuring liberation is by the microscopic examination of polished sections. Liberation analysis is most efficiently performed by automated image analyzers. Image analyzers commonly measure either linear intercepts (e.g., Rosiwal 1898, Jones & Horton 1978, Jones 1983, 1985, King & Schneider 1998) or the areas of particles and grains to determine liberation (e.g., Delesse 1848, Petruk 1988, Lastra et al. 1998). Measurement of linear intercepts yields results with a more stereological bias than measurement of areas (Leigh et al. 1996). Thus, it is generally accepted that measurement of areas is better than the measurement of linear intercepts. In contrast, the concentration of minerals by flotation is based on reagents that interact with the exposed surfaces of the minerals. Thus, it is often perceived that image analyzers should measure the proportion of exposed perimeter of the mineral of interest in the ore particles. The objective of the present report is to compare the liberation determined by particle area percentage against the liberation determined by exposed particle percentage to ascertain whether the latter serves as a better liberation parameter, especially for concentration by flotation. SAMPLES AND METHODOLOGY Thirteen samples from a copper flotation circuit in Ontario were obtained. The concentrator processes ~ 3000 tons/day of a copper-zinc ore. The ore is a volcanogenic base metal sulfide averaging ~2.7% Cu and ~3.6% Zn. The ore consists mainly of siliceous gangue, pyrite, sphalerite and chalcopyrite. The samples were composites of one day of normal operation. Table 1 lists the sampled streams and Figure 1 gives the flowsheet of the copper flotation circuit. The samples were wet screened to produce a +53 µm fraction and a –53µm product. The –53 µm product was size fractionated with a cyclosizer. A size fraction –53+13µm of each sample was prepared by blending the products from Cones 1 to 5 inclusively. The –12µm fraction represented the product passing Cone 5. Because of its substantial volume and wide particle size distribution, the +53 µm fraction of both the primary cyclone overflow (PCO) and the primary rougher tail (PRT) were further sieved to produce a +75 µm fraction.  R. Lastra Vol. 1, No. 1 32 Figure 1. Flowsheet of the copper concentrator circuit and sampling points. Table 1. List of studied samples. Sample description Abbreviation Primary Cyclone Overflow PCO Primary Rougher Concentrate PRC Primary Rougher Tail PRT Secondary Rougher Concentrate SRC Secondary Scavenger Concentrate – Pans On SSC ON Secondary Scavenger Concentrate – Pans Off SSC OFF Secondary Scavenger Tail SST Copper Cleaner 1 Feed CCF Copper Cleaner 1 Tail CCT1 Copper Cleaner 3 Concentrate CCC Combined Copper Middlings CCM Copper Cleaner 2 Tail CCT2 Secondary Cyclone Overflow SCO One polished section of each size fraction was prepared making a total of 41 polished sections. The polished sections were briefly studied by reflected light optical microscopy and scanning electron microscopy. It was found that the minerals in these samples are quartz, chlorite, amphibole, pyrite, pyrrhotite, sphalerite, chalcopyrite and galena, together with traces of arsenopyrite, cassiterite, enargite, zircon, monazite, albite, epidote, muscovite, sphene, calcite, ankerite, siderite, magnetite and an unnamed Ag-Se-Bi mineral. In addition, there are secondary copper minerals, such as bornite, covellite and digenite. However, these secondary copper minerals occur in very low proportions in comparison to chalcopyrite, which is the dominant copper mineral. The most bornite-rich sample is the copper cleaner concentrate (CCC), and even in this sample, bornite occurs in a very low proportion with respect to chalcopyrite. The polished sections were studied using a Kontron IBAS image analyzer interfaced to a JEOL 733 electron microprobe (Petruk 1988). The image analysis was done using backscattered electron (BSE) images. With polished sections, the grey level of BSE images is a function of the average atomic number of the mineral grains. The electron microprobe is equipped with a beam stabilizer that, every second, checks and maintains a constant beam current. Thus, during all the run, the grey level range of each mineral is maintained constant. The operating conditions for the electron microprobe were 20kV of accelerating voltage and 15nA of beam current. Under those conditions it was possible to use the grey levels of the BSE image to classify the main ore minerals of interest: • Chalcopyrite (cp) group: Mainly chalcopyrite plus traces of covellite and digenite. • Sphalerite (sp) group: Mainly sphalerite plus traces of bornite and enargite. • Pyrite (py) group: Mainly pyrite plus lower proportions of pyrrhotite. The image analysis study of the other minerals was limited to two general groups: • Gangue: Mainly quartz. Minor proportions of chlorite and amphibole. Lesser proportions of epidote, muscovite, sphene, calcite, and ankerite. Traces of siderite and magnetite. • Heavy minerals: Mainly galena. Minor proportions of aresnopyrite. Lesser proportions of cassiterite. Trace amounts of enargite, zircon, monazite and an unnamed Ag-Se-Bi mineral. A special image analysis program was made to determine mineral quantities, liberation based on area measurements and liberation based on perimeter measurements. The liberation measurements were done for the three groups of the MOI; i.e., mainly chalcopyrite, sphalerite and pyrite. At this point some definitions are introduced to simplify differentiation between the measurements based on areas and measurements based on perimeters. • Liberated MOI: Mineral that occupies at least 95% of the cross sectional area of a host particle. • Exposed MOI: Mineral that occupies at least 95% of a host particle perimeter in cross section. • Locked MOI: Mineral that occupies less than 95% of the cross sectional area of a host particle. • Partly exposed MOI: Mineral that occupies less than 95% of a host particle perimeter in cross section. S. BALL MILL PRIMARYPCO PRT SCO SSC OFFSSC ON CCFCCT1 CCC CCM CCT2 SST SRCPRC SCAV(-)SCAV(+)2NDARY Cu CL # 1 Cu CL # 2 Cu CL # 3  Vol. 1, No. 1 Comparison Of Liberation Determinations by Particle Area and Perimeter Percentage 33 The image analysis program consisted mainly of two sub-routines. Sub-routine Based on Area • Measurement of the cross sectional area of the particle and the cross sectional area of the MOI in the particle. • Determination of the area percent of the MOI in the particle area. • Sort the data into liberation classes. Percent of the MOI in the sample in particles with discrete MOI compositions: -5, +5-25, +25-35, +35-45, +45-55, +55-65, +65-75, +75-85, +85-95 and +95%. Sub-routine Based on Perimeter • Measurement of the particle perimeter and the perimeter of the MOI: • Determination of the coincidence perimeter of the MOI and the particle perimeter. • Determination of the perimeter percent of the MOI in the particle perimeter. • Measurement of the cross section area of the MOI in the particle. • Sort the data into exposure classes. Percent of the MOI in the sample in particles with discrete perimeter exposure of MOI: -5, +5-25, +25-35, +35-45, +45-55, +55-65, +65-75, +75-85, +85-95 and +95%. Several thousands of particles in each polished section were analyzed. The image analysis of a polished section required an average of 30 minutes. A report of the data for each size fraction of each of the thirteen samples would be very lengthy. For simplification purposes, therefore, the data obtained for each size fraction were combined into data for the original sample, on the basis of the mineral quantity in each size fraction and the relative weight percentage of the sieved fractions. In addition, several liberation classes were combined to make broader classes: +95%, +75-95% and +0.1-75%. The +95% class corresponds to liberated MOI particles. Particles with decreasing area percent of the MOI will be simply referred to as the locked class +75-95% and the locked class +0.1- 75%. Similarly, several exposure classes were combined to make broader classes. The +95% class of host particle perimeter corresponds to an exposed MOI. Particles with decreasing perimeter percent of the MOI will be simply referred to as the partly exposed class +75-95% and the partly exposed class +0.1-75%. RESULTS Table 2 gives the weight percentage of each size fraction of the samples and the Cu and Zn assays. Table 3 gives the determined mineral quantities [wt. %] in each of the samples. Table 2. Weight % retained in each size fraction and Cu and Zn assays. Sample Size fraction [µm] wt % Assay %Cu %Zn PCO +75 40.7 1.7 2.5 -75+53 5.6 1.9 2.6 -53+12 25.8 4.8 6.1 -12 27.9 2.4 3.2 PRC +53 5.8 25.5 1.3 -53+13 40.4 28.2 2.4 -13 53.8 21.0 3.7 PRT +75 44.6 1.6 2.5 -75+53 4.9 1.9 2.8 -53+12 24.3 2.3 6.3 -12 26.2 0.6 3.1 SRC +53 5.8 29.1 1.2 -53+14 48.7 25.4 3.7 -14 45.5 17.4 5.8 SSC ON +53 12.0 17.5 4.9 -53+13 43.6 4.9 15.1 -13 44.4 3.9 24.0 SSC OFF +53 15.0 7.2 4.7 -53+14 53.3 2.7 14.8 -13.8 31.7 2.5 16.9 SST +53 22.1 0.2 1.6 -53+12 36.5 0.1 5.7 -12 41.4 0.2 3.1 CCF +53 10.7 26.5 1.7 -53+13 46.5 22.1 4.9 -13 42.8 17.9 7.0 CCT1 +53 10 18.6 3.1 -53+11 47 8.1 12.9 -11 43 5.2 11.9 CCC +53 3.0 32.3 1.0 -53+13 49.2 28.0 2.5 -13 47.8 24.5 4.7 CCM +53 9.7 17.1 3.3 -53+13 39.1 5.3 13.7 -13 51.2 4.5 12.5 CCT2 +53 14.2 28.1 1.9 -53+13 52.1 19.2 5.6 -13 33.7 13.9 8.6 SCO +53 23.0 1.2 1.9 -53+12 38.6 2.7 6.1 -12 38.4 1.5 4.1 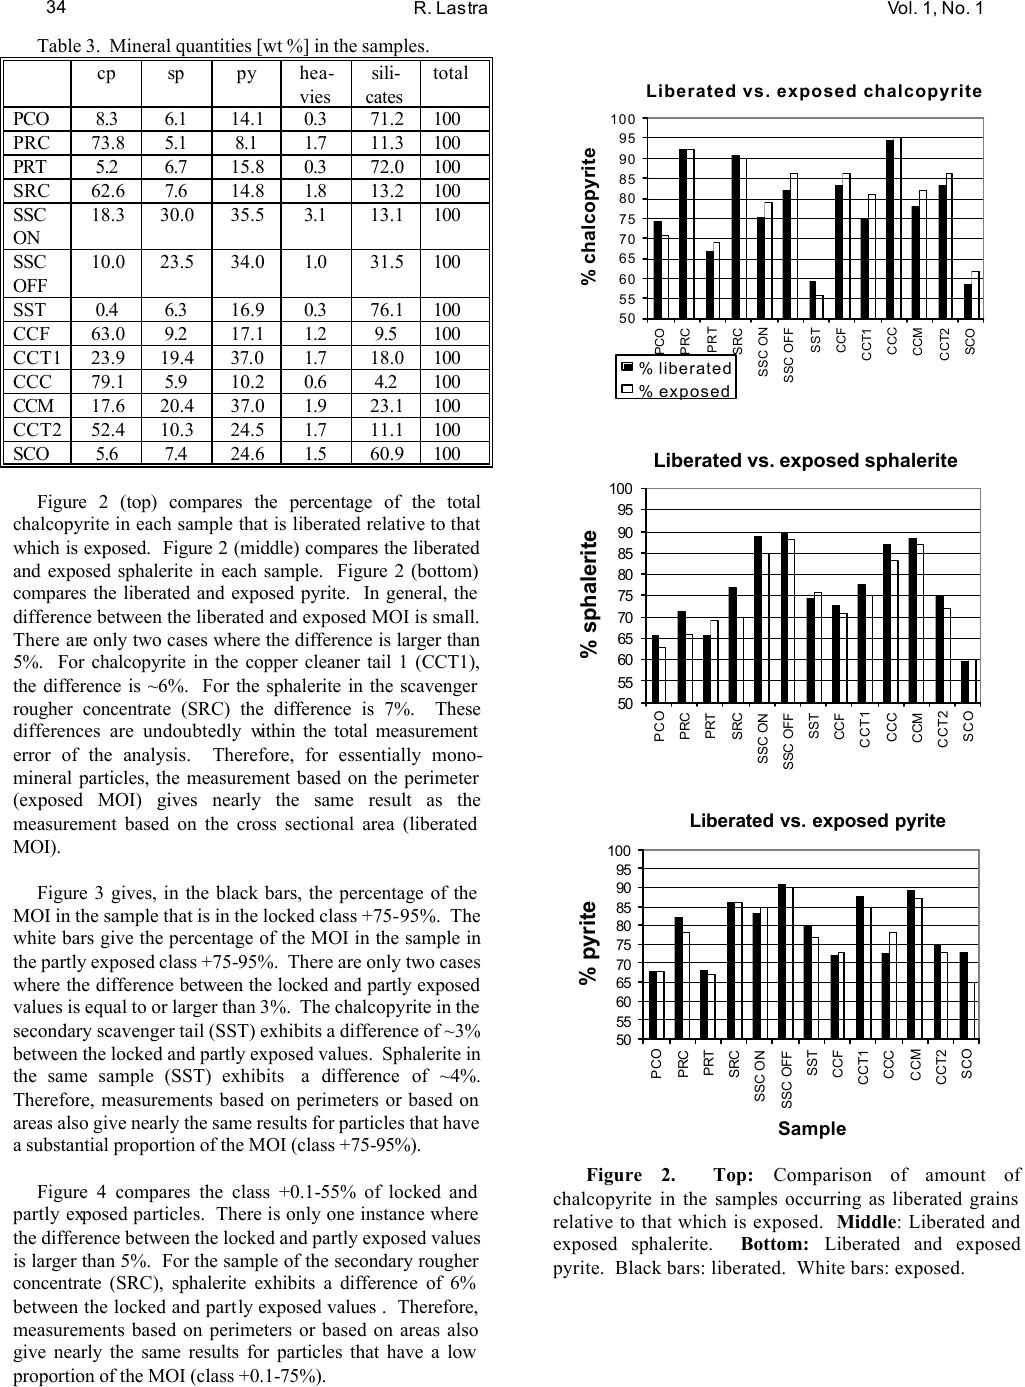 R. Lastra Vol. 1, No. 1 34 Table 3. Mineral quantities [wt %] in the samples. cp sp py hea- vies sili- cates total PCO 8.3 6.1 14.1 0.3 71.2 100 PRC 73.8 5.1 8.1 1.7 11.3 100 PRT 5.2 6.7 15.8 0.3 72.0 100 SRC 62.6 7.6 14.8 1.8 13.2 100 SSC ON 18.3 30.0 35.5 3.1 13.1 100 SSC OFF 10.0 23.5 34.0 1.0 31.5 100 SST 0.4 6.3 16.9 0.3 76.1 100 CCF 63.0 9.2 17.1 1.2 9.5 100 CCT1 23.9 19.4 37.0 1.7 18.0 100 CCC 79.1 5.9 10.2 0.6 4.2 100 CCM 17.6 20.4 37.0 1.9 23.1 100 CCT2 52.4 10.3 24.5 1.7 11.1 100 SCO 5.6 7.4 24.6 1.5 60.9 100 Figure 2 (top) compares the percentage of the total chalcopyrite in each sample that is liberated relative to that which is exposed. Figure 2 (middle) compares the liberated and exposed sphalerite in each sample. Figure 2 (bottom) compares the liberated and exposed pyrite. In general, the difference between the liberated and exposed MOI is small. There are only two cases where the difference is larger than 5%. For chalcopyrite in the copper cleaner tail 1 (CCT1), the difference is ~6%. For the sphalerite in the scavenger rougher concentrate (SRC) the difference is 7%. These differences are undoubtedly within the total measurement error of the analysis. Therefore, for essentially mono- mineral particles, the measurement based on the perimeter (exposed MOI) gives nearly the same result as the measurement based on the cross sectional area (liberated MOI). Figure 3 gives, in the black bars, the percentage of the MOI in the sample that is in the locked class +75-95%. The white bars give the percentage of the MOI in the sample in the partly exposed class +75-95%. There are only two cases where the difference between the locked and partly exposed values is equal to or larger than 3%. The chalcopyrite in the secondary scavenger tail (SST) exhibits a difference of ~3% between the locked and partly exposed values. Sphalerite in the same sample (SST) exhibits a difference of ~4%. Therefore, measurements based on perimeters or based on areas also give nearly the same results for particles that have a substantial proportion of the MOI (class +75-95%). Figure 4 compares the class +0.1-55% of locked and partly exposed particles. There is only one instance where the difference between the locked and partly exposed values is larger than 5%. For the sample of the secondary rougher concentrate (SRC), sphalerite exhibits a difference of 6% between the locked and partly exposed values . Therefore, measurements based on perimeters or based on areas also give nearly the same results for particles that have a low proportion of the MOI (class +0.1-75%). Figure 2. Top: Comparison of amount of chalcopyrite in the samples occurring as liberated grains relative to that which is exposed. Middle: Liberated and exposed sphalerite. Bottom: Liberated and exposed pyrite. Black bars: liberated. White bars: exposed. Liberated vs. exposed chalcopyrite 50 55 60 65 70 75 80 85 90 95 100 PCO PRC PRT SRC SSC ON SSC OFF SST CCF CCT1 CCC CCM CCT2 SCO % chalcopyrite % liberated % exposed Liberated vs. exposed sphalerite 50 55 60 65 70 75 80 85 90 95 100 PCO PRC PRT SRC SSC ON SSC OFF SST CCF CCT1 CCC CCM CCT2 SCO % sphalerite Liberated vs. exposed pyrite 50 55 60 65 70 75 80 85 90 95 100 PCO PRC PRT SRC SSC ON SSC OFF SST CCF CCT1 CCC CCM CCT2 SCO Sample % pyrite 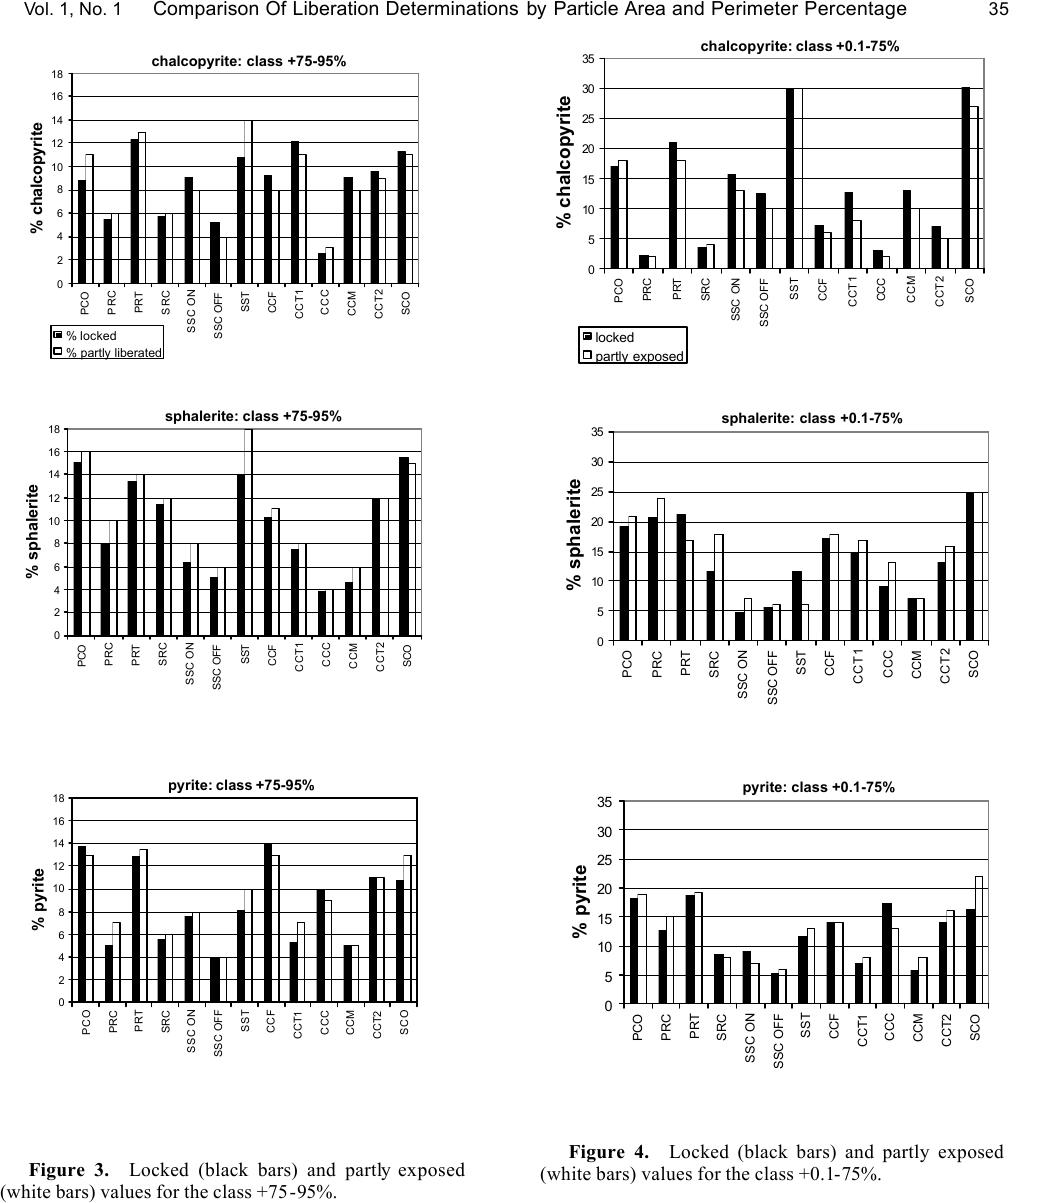 Vol. 1, No. 1 Comparison Of Liberation Determinations by Particle Area and Perimeter Percentage 35 Figure 3. Locked (black bars) and partly exposed (white bars) values for the class +75-95%. Figure 4. Locked (black bars) and partly exposed (white bars) values for the class +0.1-75%. chalcopyrite: class +75-95% 0 2 4 6 8 10 12 14 16 18 PCO PRC PRT SRC SSC ON SSC OFF SST CCF CCT1 CCC CCM CCT2 SCO % chalcopyrite % locked % partly liberated sphalerite: class +75-95% 0 2 4 6 8 10 12 14 16 18 PCO PRC PRT SRC SSC ON SSC OFF SST CCF CCT1 CCC CCM CCT2 SCO % sphalerite pyrite: class +75-95% 0 2 4 6 8 10 12 14 16 18 PCO PRC PRT SRC SSC ON SSC OFF SST CCF CCT1 CCC CCM CCT2 SCO % pyrite chalcopyrite: class +0.1-75% 0 5 10 15 20 25 30 35 PCO PRC PRT SRC SSC ON SSC OFF SST CCF CCT1 CCC CCM CCT2 SCO % chalcopyrite locked partly exposed sphalerite: class +0.1-75% 0 5 10 15 20 25 30 35 PCO PRC PRT SRC SSC ON SSC OFF SST CCF CCT1 CCC CCM CCT2 SCO % sphalerite pyrite: class +0.1-75% 0 5 10 15 20 25 30 35 PCO PRC PRT SRC SSC ON SSC OFF SST CCF CCT1 CCC CCM CCT2 SCO % pyrite  R. Lastra Vol. 1, No. 1 36 DISCUSSION For hypothetical particles composed of only two phases, it would be easy to visualize phase textures that would give different results if they were analyzed with a liberation routine based on areas or one based on exposed perimeters. One example would be for particles like those illustrated in the top row of Figure 5. It is clear that these particles have a high percentage their area occupied by the black phase. In contrast, the exposed perimeter of the black phase is zero for particle 2 and is low for particles 1 and 3. These illustrations can be applied to multi-mineral particles by considering the black phase as the mineral of interest (MOI) and the white phase as all the other minerals combined. Nevertheless, for the studied flotation samples, the results show that there are very small differences between measurements based on areas and those based on perimeters. The percentage of the MOI in the sample that is liberated is similar to the percentage of the MOI in the sample that is exposed. It could be argued that for near mono-mineral particles, the possibility of discrepancy between liberated and exposed particles is very low, because the particles have a very high proportion of the MOI. However, the results of this paper also show that the amount of the MOI in the sample that is locked (class +75-95%) is very similar to the percentage of the MOI in the sample that is partly exposed (class +75-95%). In addition, similar results were also obtained for the class +0.1-75%. Thus, regardless of the proportion of the MOI in the particles, the results based on area measurements are similar to those based on perimeter measurements. This could be explained by considering particles with simple mineral textures, such as those illustrated in the lower row of Figure 5. For these particles, the proportion of the particle area that is made of the MOI is similar to the proportion of the particle perimeter that coincides with the perimeter of the MOI. The studied samples originated from a flotation plant processing a volcanogenic base metal sulfide ore. Commonly this kind of ore displays very complex textures when polished sections of unground fragments are observed. In spite of that, the particles of the ground ore display simple textures (e.g., Figure 6). It is inferred that liberations determined by exposed perimeters may be more appropriate than liberations based on areas only if the texture of the ore is so extremely complex as to be retained in the small particles (~147 to 37µm) generated in the grinding operations. Thus, for most mineral processing situations, liberation measurements based on areas are appropriate, although is not completely impossible to find situations where a complex texture is retained in the small particles. An example would be ores with significant proportion of secondary copper minerals where small particles of chalcopyrite often have rims of secondary copper minerals, giving a texture similar to that of particle 1 in Figure 5. A cursory examination of the polished sections of ground samples would be sufficient to determine if measurements based on perimeters are better suited than measurements based on areas. Obviously, the image analyzer must be versatile enough to allow liberation measurements to be done based on either areas or perimeters. As a closing remark, it is noted that no stereological corrections were done to adjust the image analysis data. It was desired to avoid additional data handling that could obscure the differences between the measurements based on areas and those based on perimeters. There are several stereological corrections that can be applied for liberation measurements based on areas, although it is not certain that the same stereological corrections would be valid for determinations based on perimeters. Figure 5. Example of binary particles with a complex texture (top row) and a simple texture (bottom row). Figure 6. Particles with a simple texture in a BSE image of a typical area from a polished section of the unsized PCO sample. Abbreviations: cp = chalcopyrite, sp = sphalerite, py = pyrite, po = pyrrhotite, qtz = quartz.  Vol. 1, No. 1 Comparison Of Liberation Determinations by Particle Area and Perimeter Percentage 37 CONCLUSION This comparative liberation study of thirteen samples collected from a flotation plant processing complex base metal sulfides showed that the liberation of chalcopyrite, sphalerite and pyrite determined by area measurements is very similar to the liberation determined by the exposed perimeters. It is inferred that liberation determined by exposed perimeters may be more appropriate than liberation based on areas only for the case where the texture of the ore is so extremely complex as to be retained in the small particles (~147 to 37µm) generated in the grinding operations. ACKNOWLEDGMENTS This work was part of a CANMET contract, under the scientific authority of R. Lastra, awarded to the Research Productivity Council (RPC), Fredericton, New Brunswick. The work of Mr. Lech Lewczuk (formerly with RPC) is gratefully acknowledged. REFERENCES Delesse A. (1848): Procédé mecanique pour determiner la composition des roches. Annales des Mines 13, 4 th series. pp. 379-388. Jones M.P. (1983): The characterization of ores and mineral products by automatic image analysis of mineralogical features. In Proceedings Internat. Congress Applied Mineralogy (ICAM) 1981 (J.P.R. de Villiers & P.A. Cawthorn, eds.). Geol. Soc. South Africa Special Publication 7, pp. 475-478. Jones M.P. (1985): Recent developments in rapid collection of quantitative mineralogical data. In Process Mineralogy V (W.C. Park, D.M. Hausen & D.R/ Hagni, eds.). AIME/TMS, New York, pp. 141-155. Jones M.P. & Horton R. (1978): Recent developments in the stereological assessment of composite (middling) particles by linear measurements. In Proceedings 11th Commonwealth Mining and Metallurgical Congress, Hong Kong (M.J. Jones, ed.). London I.M.M, 1978, pp. 113-122. King R.P. & Schneider C.L. (1998): Stereological correction of linear grade distributions for mineral liberation. Powder Technology 98, pp. 21-37. Lastra R., Petruk W. & Wilson J. (1998): Image analysis techniques and applications to mineral processing. In Short Course on Modern Approaches to Ore and Environmental Mineralogy (J.L. Jambor, ed.). Mineral. Assoc. Can. Short Course Vol. 27, pp. 327-366. Leigh G.M., Lyman G.J. & Gottlieb P. (1996): Stereological estimates of liberation from mineral section measurements: a rederivation of Barbery’s formulae with extension. Powder Technology 87, pp. 141-152. Petruk W. (1988): Capabilities of the microprobe Kontron image analysis system: application to mineral beneficiation. Scanning Microscopy 2, pp. 1247-1256. Rosiwal A. (1898): Über Geometrische Gesteinsanalysen. Ein einfacher Weg zür ziffermassigen Feststellung des Quantitätsverhältnisses der Mineral-Bestandteile gemengter Gesteine; Verh, Kaiserlich-Koeniglichen Geologischen Reichsanstaet, Vienna, 5/6, pp. 143-175. (Translatted by H.G. Ranson; On geometric rock analysis. A simple method for the numerical determination of the quantitative ratios of the mineral fractions of mixed rocks: Royal Aircraft Establ., Farnborough, U.K., Lib. Trans. #871, 1960). |