 World Journal of Nano Science and Engineering, 2012, 2, 92-102 http://dx.doi.org/10.4236/wjnse.2012.22012 Published Online June 2012 (http://www.SciRP.org/journal/wjnse) X-Ray Photoelectron Spectroscopy and Raman Spectroscopy Studies on Thin Carbon Nitride Films Deposited by Reactive RF Magnetron Sputtering Masao Matsuoka1*, Sadao Isotani1, Ronaldo D. Mansano2, Wilmer Sucasaire1, Ricardo A. C. Pinto1, Juan C. R. Mittani1, Kiyoshi Ogata3, Naoto Kuratani4 1Institute of Physics, University of São Paulo, São Paulo, Brazil 2Polytechnical School, University of São Paulo, São Paulo, Brazil 3Nissin Electric Company, Ltd., Kyoto, Japan 4MEMS Development Department, Semiconductor Division, OMRON Corporation, Shiga, Japan Email: *matsuoka@if.usp.br Received March 23, 2012; revised April 22, 2012; accepted May 12, 2012 ABSTRACT Thin carbon nitride (CNx) films were synthesized on silicon substrates by reactive RF magnetron sputtering of a graph- ite target in mixed N2/Ar discharges and the N2 gas fraction in the discharge gas, FN, varied from 0.5 to 1.0. The atomic bonding configuration and chemical composition in the CNx films were examined using X-ray photoelectron spectros- copy (XPS) and the degree of structural disorder was studied using Raman spectroscopy. An increase in the nitrogen content in the film from 19 to 26 at% was observed at FN = 0.8 and found to influence the film properties; normality tests suggested that the data obtained at FN = 0.8 are not experimental errors. The interpretation of XPS spectra might not be always straightforward and hence the detailed and quantitative comparison of the XPS data with the information acquired by Raman spectroscopy enabled us to interpret the decomposed peaks in the N 1s and C 1s XPS spectra. Two N 1s XPS peaks at 398.3 and 399.8 eV (peaks N1 and N2, respectively) were assigned to a sum of pyridine-like nitrogen and CN bond, and to a sum of pyrrole-like nitrogen and threefold nitrogen, respectively. Further, the peaks N1 and N2 were found to correlate with C 1s XPS peaks at 288.2 and 286.3 eV, respectively; the peak at 288.2 eV might include a contribution of sp 3 carbon. Keywords: Carbon Nitride; Magnetron Sputtering; X-Ray Photoelectron; Raman Scattering 1. Introduction The prediction of hypothetical material -C3N4, whose hardness might be equal or superior to that of diamond [1], has motivated much research to synthesize and char- acterize carbon-nitrogen materials, because this super- hard material has not only scientific interest, but also promising technological potential for thin-film applica- tion. Extensive experimental effort has been made on growing thin carbon nitride (CNx, 0 x 1.33) films with various deposition methods, such as reactive sput- tering [2-4], dual ion beam sputtering [5], ion beam depo- sition [6-8], ion beam nitridation [9], laser ablation [10], chemical vapor deposition [11]. Despite much effort to achieve the stoichiometric com- pound, the large majority of the experiments done to date indicate that the maximal achievable nitrogen content structurally incorporated into amorphous CNx formed is limited to about 30 to 40 at% less than the stoichiometric value of the -C3N4 phase (57 at%) [12]. Some authors reported the presence of nanometer-sized -C3N4 crystal- lites buried in an amorphous CNx matrix on the basis of electron diffraction data [13], but others claimed that there is no definite evidence of the existence of crystal- line -C3N4 [14]. Despite the discrepancy in stoichiome- try, the obtained CNx films prove to be interesting and useful in material science and coating technology, because of their high hardness, low friction, wear resistance, and ease of fabrication. Numerous studies have been carried out on the differ- ent kinds of amorphous CNx; however, many questions, fundamentally regarding the identification of carbon-ni- trogen bonding configurations, still remain. Carbon as well as nitrogen has some atomic bonding configurations and the most commonly encountered configurations of carbon and nitrogen are linear, trigonal, and tetrahedral, which correspond to the sp, sp2, and sp3 hybridizations, respectively. Indeed, the carbon coordination in nitrogen- free carbon networks defines the local structural properties *Corresponding author. C opyright © 2012 SciRes. WJNSE 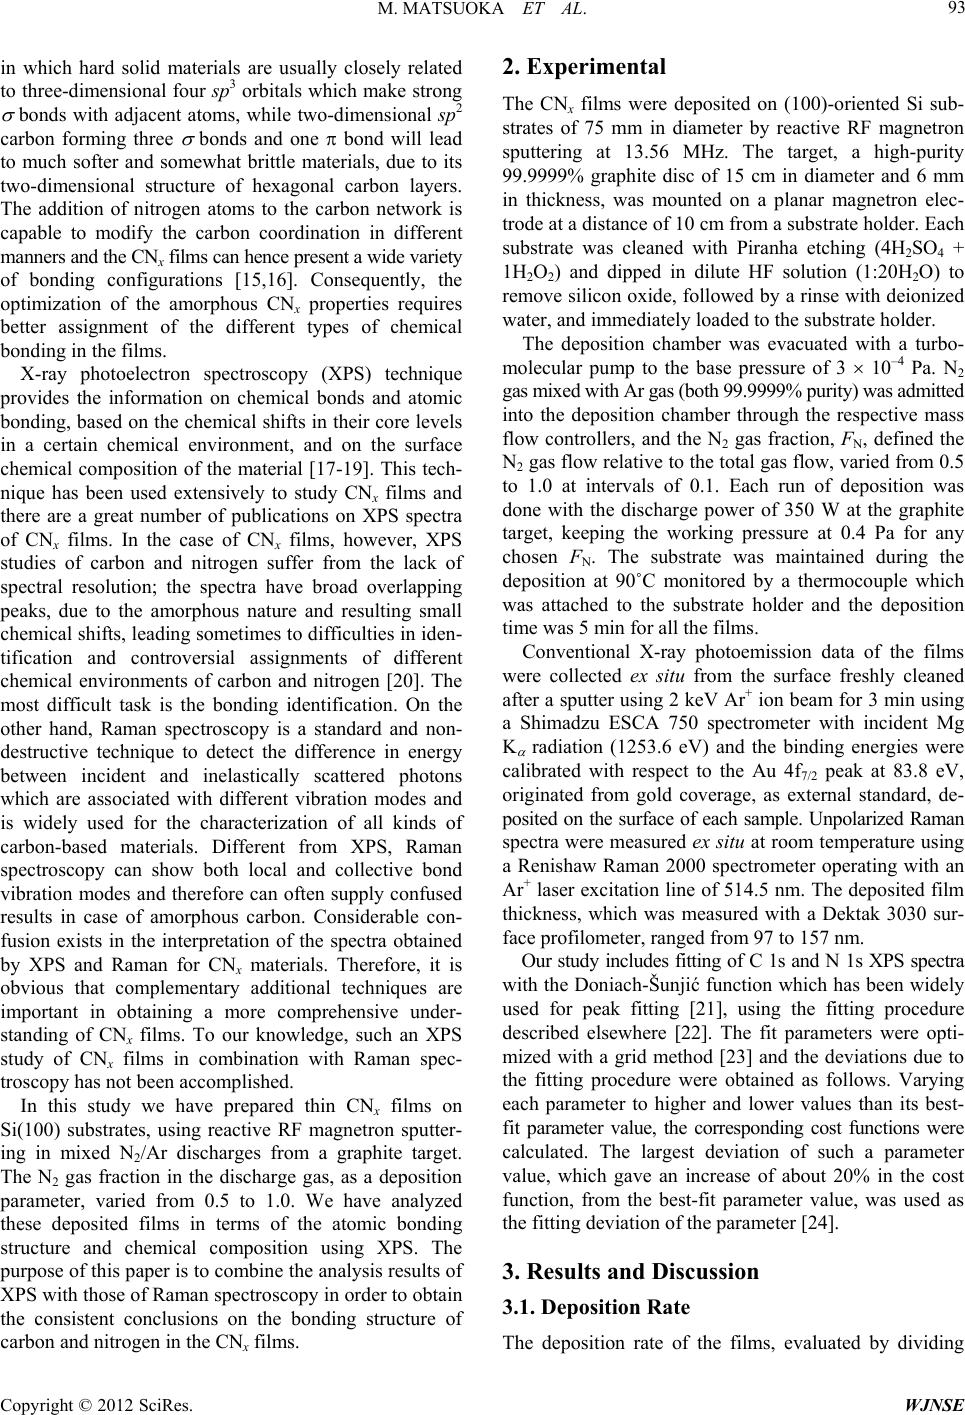 M. MATSUOKA ET AL. 93 in which hard solid materials are usually closely related to three-dimensional four sp3 orbitals which make strong bonds with adjacent atoms, while two-dimensional sp2 carbon forming three bonds and one bond will lead to much softer and somewhat brittle materials, due to its two-dimensional structure of hexagonal carbon layers. The addition of nitrogen atoms to the carbon network is capable to modify the carbon coordination in different manners and the CNx films can hence present a wide variety of bonding configurations [15,16]. Consequently, the optimization of the amorphous CNx properties requires better assignment of the different types of chemical bonding in the films. X-ray photoelectron spectroscopy (XPS) technique provides the information on chemical bonds and atomic bonding, based on the chemical shifts in their core levels in a certain chemical environment, and on the surface chemical composition of the material [17-19]. This tech- nique has been used extensively to study CNx films and there are a great number of publications on XPS spectra of CNx films. In the case of CNx films, however, XPS studies of carbon and nitrogen suffer from the lack of spectral resolution; the spectra have broad overlapping peaks, due to the amorphous nature and resulting small chemical shifts, leading sometimes to difficulties in iden- tification and controversial assignments of different chemical environments of carbon and nitrogen [20]. The most difficult task is the bonding identification. On the other hand, Raman spectroscopy is a standard and non- destructive technique to detect the difference in energy between incident and inelastically scattered photons which are associated with different vibration modes and is widely used for the characterization of all kinds of carbon-based materials. Different from XPS, Raman spectroscopy can show both local and collective bond vibration modes and therefore can often supply confused results in case of amorphous carbon. Considerable con- fusion exists in the interpretation of the spectra obtained by XPS and Raman for CNx materials. Therefore, it is obvious that complementary additional techniques are important in obtaining a more comprehensive under- standing of CNx films. To our knowledge, such an XPS study of CNx films in combination with Raman spec- troscopy has not been accomplished. In this study we have prepared thin CNx films on Si(100) substrates, using reactive RF magnetron sputter- ing in mixed N2/Ar discharges from a graphite target. The N2 gas fraction in the discharge gas, as a deposition parameter, varied from 0.5 to 1.0. We have analyzed these deposited films in terms of the atomic bonding structure and chemical composition using XPS. The purpose of this paper is to combine the analysis results of XPS with those of Raman spectroscopy in order to obtain the consistent conclusions on the bonding structure of carbon and nitrogen in the CNx films. 2. Experimental The CNx films were deposited on (100)-oriented Si sub- strates of 75 mm in diameter by reactive RF magnetron sputtering at 13.56 MHz. The target, a high-purity 99.9999% graphite disc of 15 cm in diameter and 6 mm in thickness, was mounted on a planar magnetron elec- trode at a distance of 10 cm from a substrate holder. Each substrate was cleaned with Piranha etching (4H2SO4 + 1H2O2) and dipped in dilute HF solution (1:20H2O) to remove silicon oxide, followed by a rinse with deionized water, and immediately loaded to the substrate holder. The deposition chamber was evacuated with a turbo- molecular pump to the base pressure of 3 10–4 Pa. N2 gas mixed with Ar gas (both 99.9999% purity) was admitted into the deposition chamber through the respective mass flow controllers, and the N2 gas fraction, FN, defined the N2 gas flow relative to the total gas flow, varied from 0.5 to 1.0 at intervals of 0.1. Each run of deposition was done with the discharge power of 350 W at the graphite target, keeping the working pressure at 0.4 Pa for any chosen FN. The substrate was maintained during the deposition at 90˚C monitored by a thermocouple which was attached to the substrate holder and the deposition time was 5 min for all the films. Conventional X-ray photoemission data of the films were collected ex situ from the surface freshly cleaned after a sputter using 2 keV Ar+ ion beam for 3 min using a Shimadzu ESCA 750 spectrometer with incident Mg K radiation (1253.6 eV) and the binding energies were calibrated with respect to the Au 4f7/2 peak at 83.8 eV, originated from gold coverage, as external standard, de- posited on the surface of each sample. Unpolarized Raman spectra were measured ex situ at room temperature using a Renishaw Raman 2000 spectrometer operating with an Ar+ laser excitation line of 514.5 nm. The deposited film thickness, which was measured with a Dektak 3030 sur- face profilometer, ranged from 97 to 157 nm. Our study includes fitting of C 1s and N 1s XPS spectra with the Doniach-Šunjić function which has been widely used for peak fitting [21], using the fitting procedure described elsewhere [22]. The fit parameters were opti- mized with a grid method [23] and the deviations due to the fitting procedure were obtained as follows. Varying each parameter to higher and lower values than its best- fit parameter value, the corresponding cost functions were calculated. The largest deviation of such a parameter value, which gave an increase of about 20% in the cost function, from the best-fit parameter value, was used as the fitting deviation of the parameter [24]. 3. Results and Discussion 3.1. Deposition Rate The deposition rate of the films, evaluated by dividing Copyright © 2012 SciRes. WJNSE 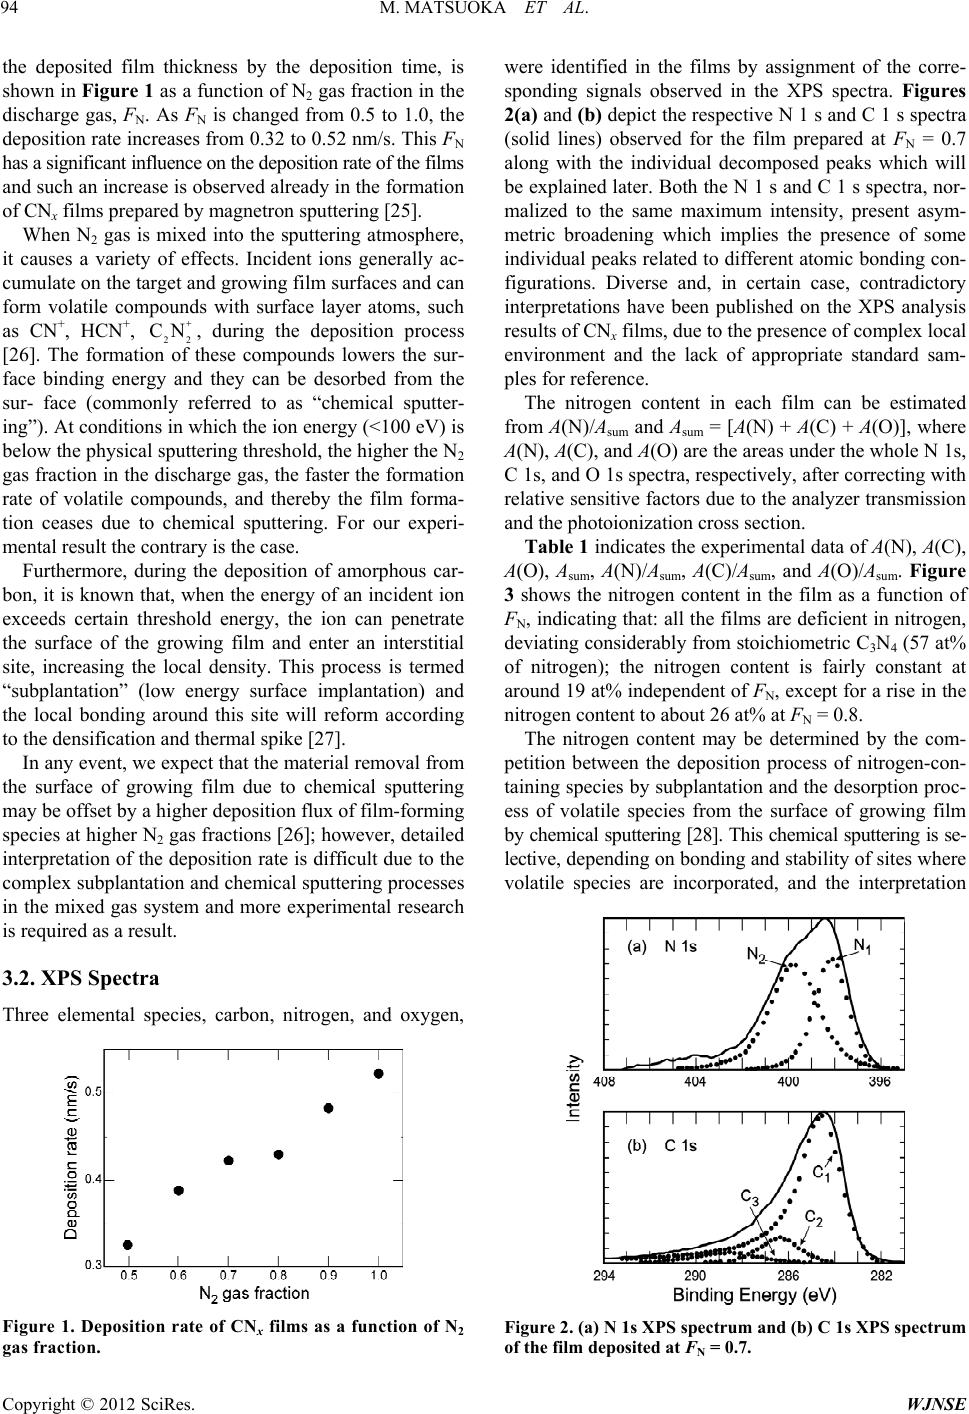 M. MATSUOKA ET AL. 94 the deposited film thickness by the deposition time, is shown in Figure 1 as a function of N2 gas fraction in the discharge gas, FN. As FN is changed from 0.5 to 1.0, the deposition rate increases from 0.32 to 0.52 nm/s. This FN has a significant influence on the deposition rate of the films and such an increase is observed already in the formation of CNx films prepared by magnetron sputtering [25]. When N2 gas is mixed into the sputtering atmosphere, it causes a variety of effects. Incident ions generally ac- cumulate on the target and growing film surfaces and can form volatile compounds with surface layer atoms, such as CN+, HCN+, 22 , during the deposition process [26]. The formation of these compounds lowers the sur- face binding energy and they can be desorbed from the sur- face (commonly referred to as “chemical sputter- ing”). At conditions in which the ion energy (<100 eV) is below the physical sputtering threshold, the higher the N2 gas fraction in the discharge gas, the faster the formation rate of volatile compounds, and thereby the film forma- tion ceases due to chemical sputtering. For our experi- mental result the contrary is the case. CN Furthermore, during the deposition of amorphous car- bon, it is known that, when the energy of an incident ion exceeds certain threshold energy, the ion can penetrate the surface of the growing film and enter an interstitial site, increasing the local density. This process is termed “subplantation” (low energy surface implantation) and the local bonding around this site will reform according to the densification and thermal spike [27]. In any event, we expect that the material removal from the surface of growing film due to chemical sputtering may be offset by a higher deposition flux of film-forming species at higher N2 gas fractions [26]; however, detailed interpretation of the deposition rate is difficult due to the complex subplantation and chemical sputtering processes in the mixed gas system and more experimental research is required as a result. 3.2. XPS Spectra Three elemental species, carbon, nitrogen, and oxygen, Figure 1. Deposition rate of CNx films as a function of N2 gas fraction. were identified in the films by assignment of the corre- sponding signals observed in the XPS spectra. Figures 2(a) and (b) depict the respective N 1 s and C 1 s spectra (solid lines) observed for the film prepared at FN = 0.7 along with the individual decomposed peaks which will be explained later. Both the N 1 s and C 1 s spectra, nor- malized to the same maximum intensity, present asym- metric broadening which implies the presence of some individual peaks related to different atomic bonding con- figurations. Diverse and, in certain case, contradictory interpretations have been published on the XPS analysis results of CNx films, due to the presence of complex local environment and the lack of appropriate standard sam- ples for reference. The nitrogen content in each film can be estimated from A(N)/Asum and Asum = [A(N) + A(C) + A(O)], where A(N), A(C), and A(O) are the areas under the whole N 1s, C 1s, and O 1s spectra, respectively, after correcting with relative sensitive factors due to the analyzer transmission and the photoionization cross section. Table 1 indicates the experimental data of A(N), A(C), A(O), Asum, A(N)/Asum, A(C)/Asum, and A(O)/Asum. Figure 3 shows the nitrogen content in the film as a function of FN, indicating that: all the films are deficient in nitrogen, deviating considerably from stoichiometric C3N4 (57 at% of nitrogen); the nitrogen content is fairly constant at around 19 at% independent of FN, except for a rise in the nitrogen content to about 26 at% at FN = 0.8. The nitrogen content may be determined by the com- petition between the deposition process of nitrogen-con- taining species by subplantation and the desorption proc- ess of volatile species from the surface of growing film by chemical sputtering [28]. This chemical sputtering is se- lective, depending on bonding and stability of sites where volatile species are incorporated, and the interpretation Figure 2. (a) N 1s XPS spectrum and (b) C 1s XPS spectrum of the film deposited at FN = 0.7. Copyright © 2012 SciRes. WJNSE  M. MATSUOKA ET AL. Copyright © 2012 SciRes. WJNSE 95 Table 1. Areas of N 1 s, C 1 s, and O 1 s XPS spectra. The units of the areas are in countseV. FN A(N) A(C) A(O) Asum A(N)/Asum A(C)/Asum A(O)/Asum 0.5 17,175 66,981 1782 85,938 0.200 0.779 0.0207 0.6 15,636 68,362 1321 85,319 0.183 0.801 0.0155 0.7 15,223 61,902 2182 79,307 0.192 0.781 0.0275 0.8 20,545 55,708 4170 80,423 0.225 0.693 0.0519 0.9 17,757 67,005 1733 86,495 0.205 0.775 0.0200 1.0 14,072 62,229 2351 78,652 0.179 0.791 0.0299 Mean 16,000 65,300 1900 82,700 σ 3100 6300 1100 5500 p value 0.67 0.25 0.09 0.12 0.088 0.012 0.13 Figure 3. Nitrogen content in the film as a function of N2 gas fraction. of this result needs further research. Further, from the table, the oxygen content given by A(O)/Asum is found to be relatively low (2 - 5 at%). The point corresponding to FN = 0.8 in Figure 3 is found to be removed in value from the others. Fearing that this outlying point might be the result of an error in measurement, the data set of Asum is examined carefully before any further analysis. It is observed at first that: the standard deviation of Asum (3600) is small compared with the mean (4%); the difference between the mean and me- dian (82871) is also small (0.2%); the means calculated from all the subsets, which are formed by subtracting one data from the data set, are very close to the mean of Asum. The normality test of Anderson-Darling [29] and the fol- lowing evaluation by the software ACTION [30] for the normality test are used to determine whether the data set is well-modeled by a normal distribution or not and p value in the test is found to be 0.12. From the considerations above mentioned and the cri- terion of p value 0.05 for a normal distribution, the data set of Asum is distributed normally in spite of a small number of the data set member. Consequently, we can conclude that the XPS measurement was run routinely and correctly. Further, all the data of Asum fall within a 99% confidence interval and then this interval is consid- ered as the deviation from the mean of each parameter. Next the data sets of A(N), A(C), and A(O), also given in Table 1, are examined and p values obtained are 0.67, 0.25, and 0.09, respectively, suggesting normal distribu- tions for the three data sets; however, the data for FN = 0.8 are outside 99% confidence intervals for the three data sets. To reduce the effect of random fluctuations in A(N) and A(C), their fractional contents, i.e., A(N)/Asum and A(C)/Asum, which are also given in the table, are ex- amined; A(O) /Asum is excluded from the examination due to its relatively small contribution. The p value obtained for the data set of A(N)/Asum indicates a normal distribu- tion (p = 0.088) and that for the data set of A(C)/Asum, a non-normal distribution (p = 0.012); the data for FN = 0.8 are outside 99% confidence intervals for the two data sets. Note that the subset of A(C)/Asum without the data for FN = 0 shows a normal distribution (p = 0.45). Figures 4(a) and (b) depict the relations between the experi- mental data and the expected data from the normal dis- tribution for the data sets of A(N)/Asum and A(C)/Asum, respectively, as a function of parameter Z, which is known as a standard normal random variable and defined by Z = (X )/ , where X is experimental data, is the mean, and is the standard deviation. It is known that, if the distribution of data is normal, the plotted points should approximately lie on a straight line. All the points except the point for FN = 0.8 in each figure arise from a normal distribution; however, the point for FN = 0.8 in each figure does not lie on the line determined by the other points and hence the data for FN = 0.8 are outliers. As shown in detail in the following Sub-Heading 3.3, three distinct Raman parameters are evaluated from the spectra analysis and the normality test results for each Raman parameter indicate that: the parameter value re- lated to the film prepared at FN = 0.8 is an outlier and the other parameter values originate from a normal distribu- tion in each data set. Taking into consideration that the two measurements with XPS and Raman are independent, we conclude that the data for FN = 0.8 are genuine results and may indicate an extreme behavior of the corre- sponding film. The Knoop hardness of the films was tentatively measured on different sites of each film using a micro- hardness tester with a load of 10 gf. The film thickness is insufficient for this measurement, because the hardness  M. MATSUOKA ET AL. 96 Figure 4. (a) A(N)/Asum and (b) A(C)/Asum, as a function of Z. reading obtained should be influenced by the silicon sub- strate with hardness of 10.8 GPa. However, it is worth mentioning here that: the apparent hardness reading indi- cates an abrupt increase from (5.4 ± 1.4) GPa to (13.7 ± 0.8) GPa at FN = 0.8; the hardness reading for the film prepared at FN = 0.8 is found, through the normality test, to be an outlier. A similar abrupt increase from 18 to 25 GPa in hardness of CNx films formed by RF plasma beam deposition using N2/Ar gas mixtures (0.1 FN 1) has been found at FN = 0.5; however, there is not any explanation for it [31]. The N 1s spectra have been commonly simulated with three or four peaks based on organic molecules contain- ing nitrogen with the well-known atomic bonding con- figurations. Most authors have used three peaks in the ranges of around 398 (N1), 400 (N2), and 402 eV (N3) [6,7,9,10]. The consensus of assignment is that the peak N3 is generally attributed to N-O bonds and/or chemi- sorbed N2 [2,5,6,10]. Some authors have taken into ac- count an additional peak situated at around 399 eV which is due to sp nitrogen bonded to carbon (CN) forming a nitrile terminating configuration [5,9]. Concerning the peaks N1 and N2, the majority of au- thors ascribe the peaks situated below 400 eV to nitrogen bonded to sp3 carbon (N–sp3 C), and the peaks above 400 eV, to nitrogen linked to sp2 carbon (N–sp2 C), on the basis of the values of binding energy for urotropine (N–sp3 C) at 399.4 eV and pyridine (N–sp 2 C) at 399.8 eV, respectively [2,5,6,10]. However, this identification scheme is not completely accepted and alternative interpretations are published by some authors. Ronning and co-workers proposed that the peaks N1 and N2 are due to nitrogen bonded to two and three neighbors, respectively [7]. Muhl and Méndez claimed that the binding energy of nitrogen is governed by the charge transfer of the electron lone pair from the nitrogen according to the surrounding chemical envi- ronment; partial or total localization of the lone pair in the CN bond leads to a decrease in the binding energy of the N 1s level and to an increase in that of the C 1s level, and less or no localization, to an increase in the binding energy of the N 1s level and to a decrease in that of the C 1s level [12]. This charge transfer depends, of course, on the binding nature between carbon and nitro- gen. Accordingly, they attributed the peak N1 to two- fold-coordinated sp 2 nitrogen in a hexagonal ring as in pyridine (pyridine-like nitrogen) or to nitrogen linked trigonally to three sp3 carbon atoms, and the peak N2 to threefold-coordinated sp2 nitrogen in a pentagonal ring as in pyrrole (pyrrole-like nitrogen). Later Sánchez-Lópes et al. attributed the peak N1 to a sum of nitrogen bonded to three sp2 carbon atoms (N–sp2 C) and terminating bond- ing configurations (−NH2, −CN), and the peak N2, to pyridine-like nitrogen [3]. On the other hand, Ripalda et al. correlated the peak N1 to pyridine-like nitrogen at edges of graphite layers or the overlap of sp and sp2 nitrogen, and the peak N2 to substitutional nitrogen in graphite, respectively [9]. This assignment is supported by theo- retical calculations by Titantah and Lamoen [32]. Further, Normand et al. proposed that the peaks N1 and N2 may be assigned to −CN bond or pyridine-like nitrogen, and to sp3 nitrogen or pyrrole-like nitrogen, respectively, what- ever configuration of carbon to which it is bonded [15]. Neidhardt et al. attributed the peak N1 to pyridine-like nitrogen and the peak N2 to threefold-coordinated nitro- gen in graphite layers [4]. The decomposition of the N 1s spectra in our work was done accordingly in terms of the three peaks N1 - N3. An example of the results is shown in Figure 2(a); the peaks N1 and N2, represented by closed circles, are prin- cipal. The contribution of the peak N3 is not included in the figure, because of the low contamination by oxygen as mentioned above, and hence this peak will be ignored in the following discussion. The best fitting parameters obtained are given in Ta- ble 2. In this table the asymmetric parameter, , related to the density of states at the Fermi level, and the line width, , related to the lifetime of destruction of the hole states by electron capture are shown; both parameters are used in the Doniach-Šunjić function. No substantial dif- ference is observed in the respective spectra, except for the variation in the integrated intensity of each peak. On the other hand, the interpretation of the C 1s spectra is even more controversial and not definitive to date. Up to the present, the C 1s spectra have been generally ana- lyzed by many authors in terms of four peaks around 284.5 eV (C1) and in the ranges of 285 - 286 (C2), 287 - 288 (C3), and 288 - 290 eV (C4) [5-7]. The consensus is that the peak C1 is exclusively attributed to graphite-like or amorphous carbon in the film and adventitious carbon on the surface [5-7,10], and that the peak C4 is associated with CO bonds [5,6]. Copyright © 2012 SciRes. WJNSE 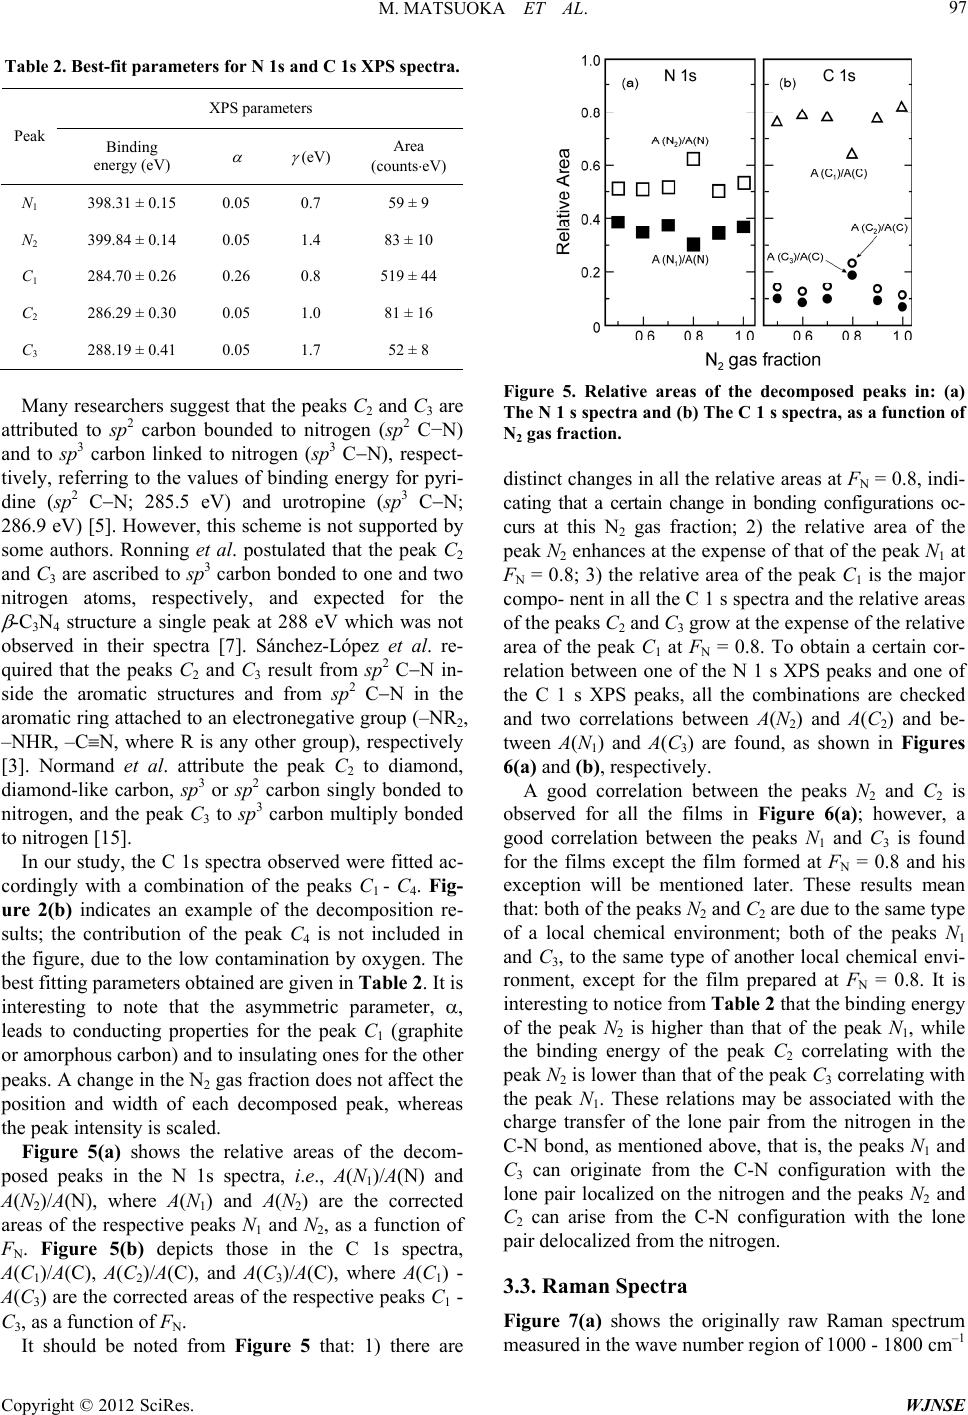 M. MATSUOKA ET AL. 97 Table 2. Best-fit parameters for N 1s and C 1s XPS spectra. XPS parameters Peak Binding energy (eV) (eV) Area (countseV) N1 398.31 ± 0.15 0.05 0.7 59 ± 9 N2 399.84 ± 0.14 0.05 1.4 83 ± 10 C1 284.70 ± 0.26 0.26 0.8 519 ± 44 C2 286.29 ± 0.30 0.05 1.0 81 ± 16 C3 288.19 ± 0.41 0.05 1.7 52 ± 8 Many researchers suggest that the peaks C2 and C3 are attributed to sp2 carbon bounded to nitrogen (sp2 C−N) and to sp3 carbon linked to nitrogen (sp3 CN), respect- tively, referring to the values of binding energy for pyri- dine (sp2 CN; 285.5 eV) and urotropine (sp3 CN; 286.9 eV) [5]. However, this scheme is not supported by some authors. Ronning et al. postulated that the peak C2 and C3 are ascribed to sp3 carbon bonded to one and two nitrogen atoms, respectively, and expected for the -C3N4 structure a single peak at 288 eV which was not observed in their spectra [7]. Sánchez-López et al. re- quired that the peaks C2 and C3 result from sp2 CN in- side the aromatic structures and from sp2 CN in the aromatic ring attached to an electronegative group (–NR2, –NHR, –CN, where R is any other group), respectively [3]. Normand et al. attribute the peak C2 to diamond, diamond-like carbon, sp3 or sp2 carbon singly bonded to nitrogen, and the peak C3 to sp3 carbon multiply bonded to nitrogen [15]. In our study, the C 1s spectra observed were fitted ac- cordingly with a combination of the peaks C1 - C4. Fig- ure 2(b) indicates an example of the decomposition re- sults; the contribution of the peak C4 is not included in the figure, due to the low contamination by oxygen. The best fitting parameters obtained are given in Table 2. It is interesting to note that the asymmetric parameter, , leads to conducting properties for the peak C1 (graphite or amorphous carbon) and to insulating ones for the other peaks. A change in the N2 gas fraction does not affect the position and width of each decomposed peak, whereas the peak intensity is scaled. Figure 5(a) shows the relative areas of the decom- posed peaks in the N 1s spectra, i.e., A(N1)/A(N) and A(N2)/A(N), where A(N1) and A(N2) are the corrected areas of the respective peaks N1 and N2, as a function of FN. Figure 5(b) depicts those in the C 1s spectra, A(C1)/A(C), A(C2)/A(C), and A(C3)/A(C), where A(C1) - A(C3) are the corrected areas of the respective peaks C1 - C3, as a function of FN. It should be noted from Figure 5 that: 1) there are Figure 5. Relative areas of the decomposed peaks in: (a) The N 1 s spectra and (b) The C 1 s spectra, as a function of N2 gas fraction. distinct changes in all the relative areas at FN = 0.8, indi- cating that a certain change in bonding configurations oc- curs at this N2 gas fraction; 2) the relative area of the peak N2 enhances at the expense of that of the peak N1 at FN = 0.8; 3) the relative area of the peak C1 is the major compo- nent in all the C 1 s spectra and the relative areas of the peaks C2 and C3 grow at the expense of the relative area of the peak C1 at FN = 0.8. To obtain a certain cor- relation between one of the N 1 s XPS peaks and one of the C 1 s XPS peaks, all the combinations are checked and two correlations between A(N2) and A(C2) and be- tween A(N1) and A(C3) are found, as shown in Figures 6(a) and (b), respectively. A good correlation between the peaks N2 and C2 is observed for all the films in Figure 6(a); however, a good correlation between the peaks N1 and C3 is found for the films except the film formed at FN = 0.8 and his exception will be mentioned later. These results mean that: both of the peaks N2 and C2 are due to the same type of a local chemical environment; both of the peaks N1 and C3, to the same type of another local chemical envi- ronment, except for the film prepared at FN = 0.8. It is interesting to notice from Table 2 that the binding energy of the peak N2 is higher than that of the peak N1, while the binding energy of the peak C2 correlating with the peak N2 is lower than that of the peak C3 correlating with the peak N1. These relations may be associated with the charge transfer of the lone pair from the nitrogen in the C-N bond, as mentioned above, that is, the peaks N1 and C3 can originate from the C-N configuration with the lone pair localized on the nitrogen and the peaks N2 and C2 can arise from the C-N configuration with the lone pair delocalized from the nitrogen. 3.3. Raman Spectra Figure 7(a) shows the originally raw Raman spectrum measured in the wave number region of 1000 - 1800 cm–1 Copyright © 2012 SciRes. WJNSE 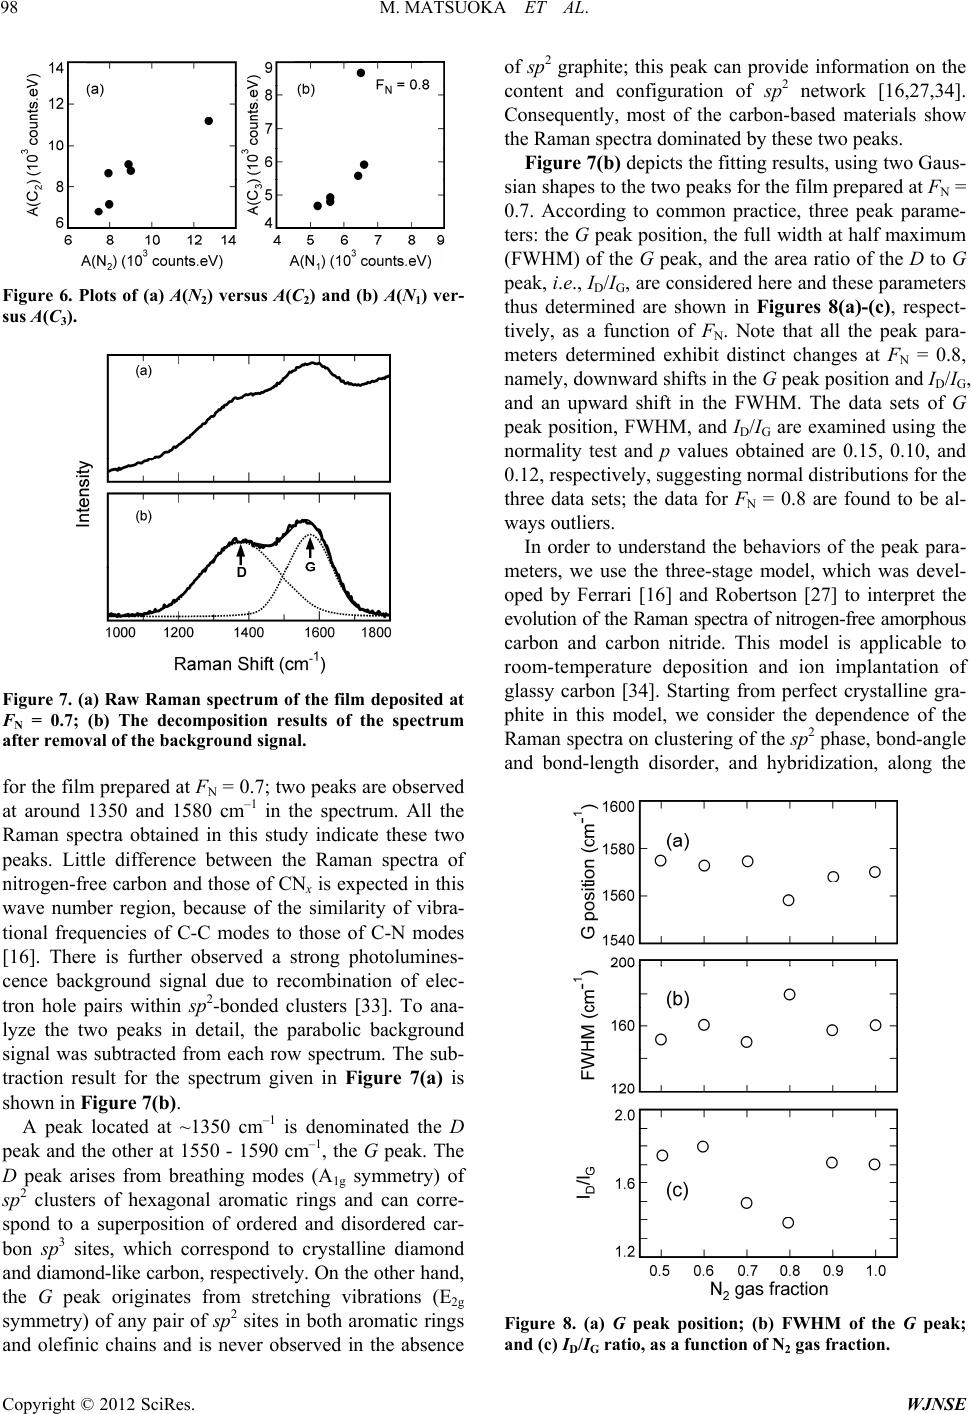 M. MATSUOKA ET AL. 98 Figure 6. Plots of (a) A(N2) versus A(C2) and (b) A(N1) ver- sus A(C3). Figure 7. (a) Raw Raman spectrum of the film deposited at FN = 0.7; (b) The decomposition results of the spectrum after removal of the background signal. for the film prepared at FN = 0.7; two peaks are observed at around 1350 and 1580 cm–1 in the spectrum. All the Raman spectra obtained in this study indicate these two peaks. Little difference between the Raman spectra of nitrogen-free carbon and those of CNx is expected in this wave number region, because of the similarity of vibra- tional frequencies of C-C modes to those of C-N modes [16]. There is further observed a strong photolumines- cence background signal due to recombination of elec- tron hole pairs within sp 2-bonded clusters [33]. To ana- lyze the two peaks in detail, the parabolic background signal was subtracted from each row spectrum. The sub- traction result for the spectrum given in Figure 7(a) is shown in Figure 7(b). A peak located at ~1350 cm–1 is denominated the D peak and the other at 1550 - 1590 cm–1, the G peak. The D peak arises from breathing modes (A1g symmetry) of sp2 clusters of hexagonal aromatic rings and can corre- spond to a superposition of ordered and disordered car- bon sp3 sites, which correspond to crystalline diamond and diamond-like carbon, respectively. On the other hand, the G peak originates from stretching vibrations (E2g symmetry) of any pair of sp2 sites in both aromatic rings and olefinic chains and is never observed in the absence of sp2 graphite; this peak can provide information on the content and configuration of sp2 network [16,27,34]. Consequently, most of the carbon-based materials show the Raman spectra dominated by these two peaks. Figure 7(b) depicts the fitting results, using two Gaus- sian shapes to the two peaks for the film prepared at FN = 0.7. According to common practice, three peak parame- ters: the G peak position, the full width at half maximum (FWHM) of the G peak, and the area ratio of the D to G peak, i.e., ID/IG, are considered here and these parameters thus determined are shown in Figures 8(a)-(c), respect- tively, as a function of FN. Note that all the peak para- meters determined exhibit distinct changes at FN = 0.8, namely, downward shifts in the G peak position and ID/IG, and an upward shift in the FWHM. The data sets of G peak position, FWHM, and ID/IG are examined using the normality test and p values obtained are 0.15, 0.10, and 0.12, respectively, suggesting normal distributions for the three data sets; the data for FN = 0.8 are found to be al- ways outliers. In order to understand the behaviors of the peak para- meters, we use the three-stage model, which was devel- oped by Ferrari [16] and Robertson [27] to interpret the evolution of the Raman spectra of nitrogen-free amorphous carbon and carbon nitride. This model is applicable to room-temperature deposition and ion implantation of glassy carbon [34]. Starting from perfect crystalline gra- phite in this model, we consider the dependence of the Raman spectra on clustering of the sp2 phase, bond-angle and bond-length disorder, and hybridization, along the Figure 8. (a) G peak position; (b) FWHM of the G peak; and (c) ID/IG ratio, as a function of N2 gas fraction. Copyright © 2012 SciRes. WJNSE 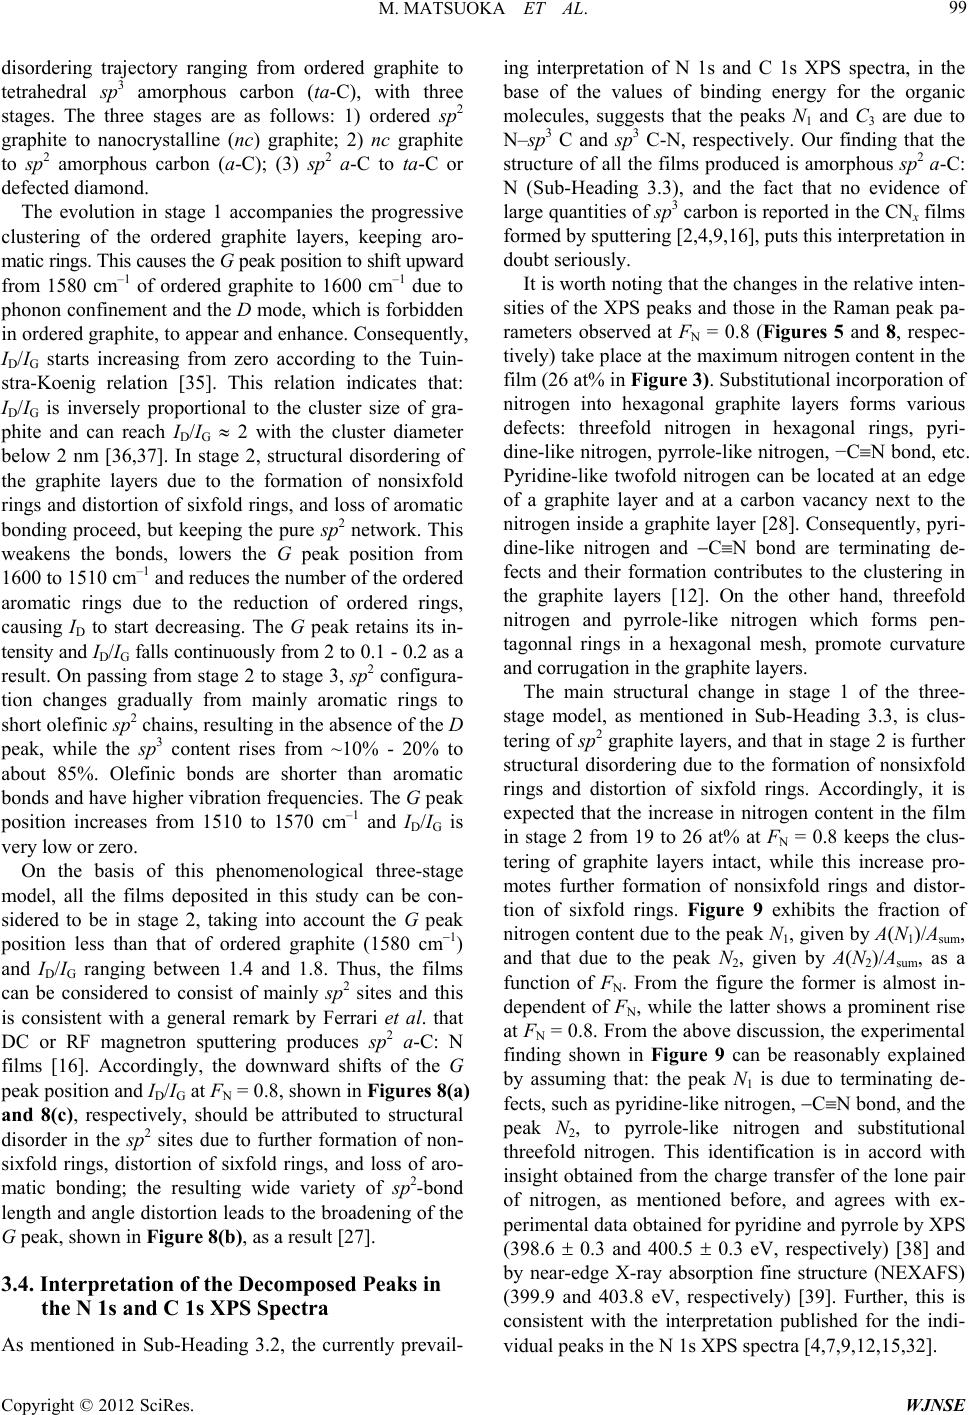 M. MATSUOKA ET AL. 99 disordering trajectory ranging from ordered graphite to tetrahedral sp3 amorphous carbon (ta-C), with three stages. The three stages are as follows: 1) ordered sp2 graphite to nanocrystalline (nc) graphite; 2) nc graphite to sp2 amorphous carbon (a-C); (3) sp2 a-C to ta-C or defected diamond. The evolution in stage 1 accompanies the progressive clustering of the ordered graphite layers, keeping aro- matic rings. This causes the G peak position to shift upward from 1580 cm–1 of ordered graphite to 1600 cm–1 due to phonon confinement and the D mode, which is forbidden in ordered graphite, to appear and enhance. Consequently, ID/IG starts increasing from zero according to the Tuin- stra-Koenig relation [35]. This relation indicates that: ID/IG is inversely proportional to the cluster size of gra- phite and can reach ID/IG 2 with the cluster diameter below 2 nm [36,37]. In stage 2, structural disordering of the graphite layers due to the formation of nonsixfold rings and distortion of sixfold rings, and loss of aromatic bonding proceed, but keeping the pure sp2 network. This weakens the bonds, lowers the G peak position from 1600 to 1510 cm–1 and reduces the number of the ordered aromatic rings due to the reduction of ordered rings, causing ID to start decreasing. The G peak retains its in- tensity and ID/IG falls continuously from 2 to 0.1 - 0.2 as a result. On passing from stage 2 to stage 3, sp2 configura- tion changes gradually from mainly aromatic rings to short olefinic sp2 chains, resulting in the absence of the D peak, while the sp3 content rises from ~10% - 20% to about 85%. Olefinic bonds are shorter than aromatic bonds and have higher vibration frequencies. The G peak position increases from 1510 to 1570 cm–1 and ID/IG is very low or zero. On the basis of this phenomenological three-stage model, all the films deposited in this study can be con- sidered to be in stage 2, taking into account the G peak position less than that of ordered graphite (1580 cm1) and ID/IG ranging between 1.4 and 1.8. Thus, the films can be considered to consist of mainly sp2 sites and this is consistent with a general remark by Ferrari et al. that DC or RF magnetron sputtering produces sp2 a-C: N films [16]. Accordingly, the downward shifts of the G peak position and ID/IG at FN = 0.8, shown in Figures 8(a) and 8(c), respectively, should be attributed to structural disorder in the sp2 sites due to further formation of non- sixfold rings, distortion of sixfold rings, and loss of aro- matic bonding; the resulting wide variety of sp2-bond length and angle distortion leads to the broadening of the G peak, shown in Figure 8( b) , as a result [27]. 3.4. Interpretation of the Decomposed Peaks in the N 1s and C 1s XPS Spectra As mentioned in Sub-Heading 3.2, the currently prevail- ing interpretation of N 1s and C 1s XPS spectra, in the base of the values of binding energy for the organic molecules, suggests that the peaks N1 and C3 are due to N–sp3 C and sp 3 C-N, respectively. Our finding that the structure of all the films produced is amorphous sp2 a-C: N (Sub-Heading 3.3), and the fact that no evidence of large quantities of sp3 carbon is reported in the CNx films formed by sputtering [2,4,9,16], puts this interpretation in doubt seriously. It is worth noting that the changes in the relative inten- sities of the XPS peaks and those in the Raman peak pa- rameters observed at FN = 0.8 (Figures 5 and 8, respec- tively) take place at the maximum nitrogen content in the film (26 at% in Figure 3). Substitutional incorporation of nitrogen into hexagonal graphite layers forms various defects: threefold nitrogen in hexagonal rings, pyri- dine-like nitrogen, pyrrole-like nitrogen, −CN bond, etc. Pyridine-like twofold nitrogen can be located at an edge of a graphite layer and at a carbon vacancy next to the nitrogen inside a graphite layer [28]. Consequently, pyri- dine-like nitrogen and CN bond are terminating de- fects and their formation contributes to the clustering in the graphite layers [12]. On the other hand, threefold nitrogen and pyrrole-like nitrogen which forms pen- tagonnal rings in a hexagonal mesh, promote curvature and corrugation in the graphite layers. The main structural change in stage 1 of the three- stage model, as mentioned in Sub-Heading 3.3, is clus- tering of sp2 graphite layers, and that in stage 2 is further structural disordering due to the formation of nonsixfold rings and distortion of sixfold rings. Accordingly, it is expected that the increase in nitrogen content in the film in stage 2 from 19 to 26 at% at FN = 0.8 keeps the clus- tering of graphite layers intact, while this increase pro- motes further formation of nonsixfold rings and distor- tion of sixfold rings. Figure 9 exhibits the fraction of nitrogen content due to the peak N1, given by A(N1)/Asum, and that due to the peak N2, given by A(N2)/Asum, as a function of FN. From the figure the former is almost in- dependent of FN, while the latter shows a prominent rise at FN = 0.8. From the above discussion, the experimental finding shown in Figure 9 can be reasonably explained by assuming that: the peak N1 is due to terminating de- fects, such as pyridine-like nitrogen, CN bond, and the peak N2, to pyrrole-like nitrogen and substitutional threefold nitrogen. This identification is in accord with insight obtained from the charge transfer of the lone pair of nitrogen, as mentioned before, and agrees with ex- perimental data obtained for pyridine and pyrrole by XPS (398.6 0.3 and 400.5 0.3 eV, respectively) [38] and by near-edge X-ray absorption fine structure (NEXAFS) (399.9 and 403.8 eV, respectively) [39]. Further, this is consistent with the interpretation published for the indi- vidual peaks in the N 1s XPS spectra [4,7,9,12,15,32]. Copyright © 2012 SciRes. WJNSE 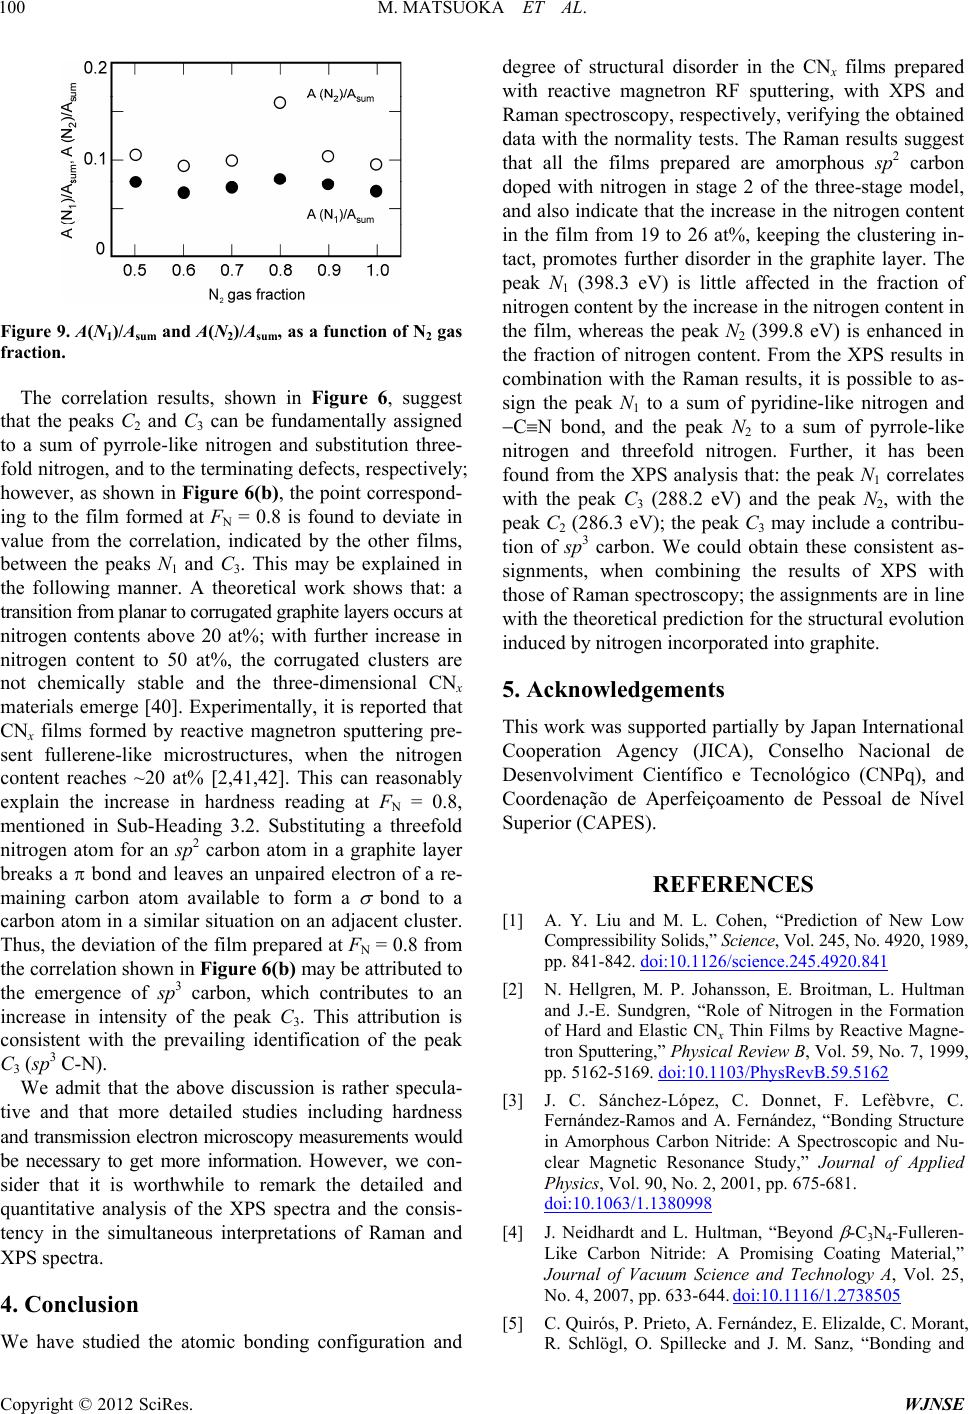 M. MATSUOKA ET AL. 100 Figure 9. A(N1)/Asum and A(N2)/Asum, as a function of N2 gas fraction. The correlation results, shown in Figure 6, suggest that the peaks C2 and C3 can be fundamentally assigned to a sum of pyrrole-like nitrogen and substitution three- fold nitrogen, and to the terminating defects, respectively; however, as shown in Figure 6(b), the point correspond- ing to the film formed at FN = 0.8 is found to deviate in value from the correlation, indicated by the other films, between the peaks N1 and C3. This may be explained in the following manner. A theoretical work shows that: a transition from planar to corrugated graphite layers occurs at nitrogen contents above 20 at%; with further increase in nitrogen content to 50 at%, the corrugated clusters are not chemically stable and the three-dimensional CNx materials emerge [40]. Experimentally, it is reported that CNx films formed by reactive magnetron sputtering pre- sent fullerene-like microstructures, when the nitrogen content reaches ~20 at% [2,41,42]. This can reasonably explain the increase in hardness reading at FN = 0.8, mentioned in Sub-Heading 3.2. Substituting a threefold nitrogen atom for an sp2 carbon atom in a graphite layer breaks a bond and leaves an unpaired electron of a re- maining carbon atom available to form a bond to a carbon atom in a similar situation on an adjacent cluster. Thus, the deviation of the film prepared at FN = 0.8 from the correlation shown in Figure 6(b) may be attributed to the emergence of sp3 carbon, which contributes to an increase in intensity of the peak C3. This attribution is consistent with the prevailing identification of the peak C3 (sp3 C-N). We admit that the above discussion is rather specula- tive and that more detailed studies including hardness and transmission electron microscopy measurements would be necessary to get more information. However, we con- sider that it is worthwhile to remark the detailed and quantitative analysis of the XPS spectra and the consis- tency in the simultaneous interpretations of Raman and XPS spectra. 4. Conclusion We have studied the atomic bonding configuration and degree of structural disorder in the CNx films prepared with reactive magnetron RF sputtering, with XPS and Raman spectroscopy, respectively, verifying the obtained data with the normality tests. The Raman results suggest that all the films prepared are amorphous sp2 carbon doped with nitrogen in stage 2 of the three-stage model, and also indicate that the increase in the nitrogen content in the film from 19 to 26 at%, keeping the clustering in- tact, promotes further disorder in the graphite layer. The peak N1 (398.3 eV) is little affected in the fraction of nitrogen content by the increase in the nitrogen content in the film, whereas the peak N2 (399.8 eV) is enhanced in the fraction of nitrogen content. From the XPS results in combination with the Raman results, it is possible to as- sign the peak N1 to a sum of pyridine-like nitrogen and CN bond, and the peak N2 to a sum of pyrrole-like nitrogen and threefold nitrogen. Further, it has been found from the XPS analysis that: the peak N1 correlates with the peak C3 (288.2 eV) and the peak N2, with the peak C2 (286.3 eV); the peak C3 may include a contribu- tion of sp3 carbon. We could obtain these consistent as- signments, when combining the results of XPS with those of Raman spectroscopy; the assignments are in line with the theoretical prediction for the structural evolution induced by nitrogen incorporated into graphite. 5. Acknowledgements This work was supported partially by Japan International Cooperation Agency (JICA), Conselho Nacional de Desenvolviment Científico e Tecnológico (CNPq), and Coordenação de Aperfeiçoamento de Pessoal de Nível Superior (CAPES). REFERENCES [1] A. Y. Liu and M. L. Cohen, “Prediction of New Low Compressibility Solids,” Science, Vol. 245, No. 4920, 1989, pp. 841-842. doi:10.1126/science.245.4920.841 [2] N. Hellgren, M. P. Johansson, E. Broitman, L. Hultman and J.-E. Sundgren, “Role of Nitrogen in the Formation of Hard and Elastic CNx Thin Films by Reactive Magne- tron Sputtering,” Physical Review B, Vol. 59, No. 7, 1999, pp. 5162-5169. doi:10.1103/PhysRevB.59.5162 [3] J. C. Sánchez-López, C. Donnet, F. Lefèbvre, C. Fernández-Ramos and A. Fernández, “Bonding Structure in Amorphous Carbon Nitride: A Spectroscopic and Nu- clear Magnetic Resonance Study,” Journal of Applied Physics, Vol. 90, No. 2, 2001, pp. 675-681. doi:10.1063/1.1380998 [4] J. Neidhardt and L. Hultman, “Beyond -C3N4-Fulleren- Like Carbon Nitride: A Promising Coating Material,” Journal of Vacuum Science and Technology A, Vol. 25, No. 4, 2007, pp. 633-644. doi:10.1116/1.2738505 [5] C. Quirós, P. Prieto, A. Fernández, E. Elizalde, C. Morant, R. Schlögl, O. Spillecke and J. M. Sanz, “Bonding and Copyright © 2012 SciRes. WJNSE  M. MATSUOKA ET AL. 101 Morphology Study of Carbon Nitride Films Obtained by Dual Ion Beam Sputtering,” Journal of Vacuum Science and Technology A, Vol. 18, No. 2, 2000, pp. 515-523. doi:10.1116/1.582218 [6] D. Marton, K. J. Boyd, A. H. Al-Bayati, S. S. Todorov and J. W. Rabalais, “Carbon Nitride Deposited Using En- ergetic Species: A Two-Phase System,” Physical Review Letters, Vol. 73, No. 1, 1994, pp. 118-121. doi:10.1103/PhysRevLett.73.118 [7] C. Ronning, H. Feldermann, R. Merk and H. Hofsäss, “Carbon Nitride Deposited Using Energetic Species: A Reviews on XPS Studies,” Physical Review B, Vol. 58, No. 4, 1998, pp. 2207-2215. doi:10.1103/PhysRevB.58.2207 [8] W. Sucasaire, M. Matsuoka, K. C. Lopes, J. C. R. Mittani, L. H. Avanci, J. F. D. Chubaci, N. Added, V. Trava and E. J. Corat, “Raman and Infrared Spectroscopy Studies of Carbon Nitride Films Prepared on Si(100) Substrates by Ion Beam Assisted Deposition,” Journal of the Brazilian Chemical Society, Vol. 17, No. 6, 2006, pp. 1163-1169. doi:10.1590/S0103-50532006000600014 [9] J. M. Ripalda, E. Román, N. Díaz, L. Galán, I. Montero, G. Comelli, A. Baraldi, S. Lizzit, A. Goldoni and G. Paolucci, “Correlation of X-Ray Absorption and X-Ray Photoelectron Spectroscopies in Amorphous Carbon Ni- tride,” Physical Review B, Vol. 60, No. 6, 1999, pp. R3705-R3708. doi:10.1103/PhysRevB.60.R3705 [10] R. McCann, S. S. Roy, P. Papakonstantinou, J. A. Mc- Laughlin and S. C. Ray, “Spectroscopic Analysis of a-C and a-CNx Films Prepared by Ultrafast High Repetition Rate Pulsed Laser Deposition,” Journal of Applied Phys- ics, Vol. 97, No. 7, 2005, pp. 073522-1 - 073522-11. doi:10.1063/1.1874300 [11] Y. Zhang, Z. Zhou and H. Li, “Crystalline Carbon Nitride Films Formation by Chemical Vapor Deposition,” Ap- plied Physics Letters, Vol. 68, No. 5, 1996, pp. 634-636. doi:10.1063/1.116492 [12] S. Muhl and J. M. Méndez, “A Review of the Preparation of Carbon Nitride Films,” Diamond and Related Materi- als, Vol. 8, No. 10, 1999, pp. 1809-1830. doi:10.1016/S0925-9635(99)00142-9 [13] C. Niu, Y. Z. Lu and C. M. Lieber, “Experimental Reali- zation of the Covalent Solid Carbon Nitride,” Science, Vol. 261, No. 5119, 1993, pp. 334-337. doi:10.1126/science.261.5119.334 [14] S. Matsumoto, E.-Q. Xie and F. Izumi, “On the Validity of the Formation of Crystalline Carbon Nitride, C3N4,” Diamond and Related Materials, Vol. 8, No. 7, 1999, pp. 1175-1182. doi:10.1016/S0925-9635(99)00103-X [15] F. Le Normand, J. Hommet, T. Szörényi, C. Fuchs and E. Fogarassy, “XPS Study of Pulsed Laser Deposited CNx Films,” Physical Review B, Vol. 64, No. 23, 2001, pp. 235416-1-235416-15. doi:10.1103/PhysRevB.64.235416 [16] A. C. Ferrari, S. E. Rodil and J. Robertson, “Interpreta- tion of Infrared and Raman Spectra of Amorphous Car- bon Nitride,” Physical Review B, Vol. 67, No. 15, 2003, pp. 155306-1-155306-20. doi:10.1103/PhysRevB.67.155306 [17] M. Matsuoka, S. Isotani, J. C. R. Mittani, J. F. D. Chubaci, K. Ogata and N. Kuratani, “Effects of Arrival Rate and Gas Pressure on the Chemical Bonding and Composition in Titanium Nitride Films Prepared on Si(100) Substrates by Ion Beam and Vapor Deposition,” Journal of Vacuum Science and Technology A, Vol. 23, No. 1, 2005, pp. 137- 141. doi:10.1116/1.1839895 [18] M. Matsuoka, S. Isotani, W. Sucasaire, N. Kuratani and K. Ogata, “X-Ray Photoelectron Spectroscopy Analysis of Zirconium Nitride-Like Films Prepared on Si(100) Sub- strates by Ion Beam Assisted Deposition,” Surface and Coating Technology, Vol. 202, No. 13, 2008, pp. 3129- 3135. doi:10.1016/j.surfcoat.2007.11.019 [19] M. Matsuoka, S. Isotani, W. Sucasaire, L. S. Zambom and K. Ogata, “Chemical Bonding and Composition of Silicon Nitride Films Prepared by Inductively Coupled Plasma Chemical Vapor Deposition,” Surface and Coat- ing Technology, Vol. 204, No. 18-19, 2010, pp. 2923- 2927. doi.org/10.1016/j.surfcoat.2010.02.071 [20] S. Neuville and A. Matthews, “A Perspective on the Op- timization of Hard Carbon and Related Coatings for En- gineering Applications,” Thin Solid Films, Vol. 515, No. 17, 2007, pp. 6619-6653. doi:10.1016/j.tsf.2007.02.011 [21] S. Doniach and M. Šunjić, “Many-Electron Singularity in X-Ray Photoemission an X-Ray Line Spectra from Met- als,” Journal of Physics C, Vol. 3, No. 2, 1970, pp. 285- 291. [22] M. Matsuoka, S. Isotani, S. Miyake, Y. Setsuhara, K. Ogata and N. Kuratani, “Effects of Ion Energy and Arri- val Rate on the Composition of Zirconium Oxide Films Prepared by Ion-Beam Assisted Deposition,” Journal of Applied Physics, Vol. 8, No. 2, 1996, pp. 1177-1181. doi:10.1063/1.362855 [23] S. Isotani and A. T. Fujii, “A Grid Procedure Applied to the Determination of Parameters of a Kinetic Process,” Computer Physics Communications, Vol. 151, No. 1, 2003, pp. 1-7. doi:10.1016/S0010-4655(02)00692-6 [24] S. Isotani, A. R. Blak and S. Watanabe, “UV Optical Absorption Spectra Analysis of Beryl Crystals from Bra- zil,” Physica B: Condensed Matter, Vol. 405, No. 6, 2010, pp. 1501-1508. doi:10.1016/j.physb.2009.12.029 [25] Y. Kusano, J. E. Evetts, R. E. Somekh and I. M. Hutchings, “Properties of Carbon Nitride Films Deposited by Magnetron Sputtering,” Thin Solid Films, Vol. 332, No. 1-2, 1998, pp. 56-61. doi:10.1016/S0040-6090(98)00983-3 [26] J. Neidhardt, L. Hultman, B. Abendroth, R. Gago and W. Möller, “Diagnostics of a N2/Ar Direct Current Magne- tron Discharge for Reactive Sputter Deposition of Ful- lerene-Like Carbon Nitride Thin Films,” Journal of Applied Physics, Vol. 94, No. 11, 2003, pp. 7059-7066. doi:10.1063/1.1625091 [27] J. Robertson, “Diamond-Like Amorphous Carbon,” Ma- terials Science and Engineering: R: Reports, Vol. 37, No. 4-6, 2002, pp. 129-281. doi:10.1016/S0927-796X(02)00005-0 [28] L. Hultman, J. Neidhardt, N. Hellgren, H. Sjöström and J.-E. Sundgren, “Fullerene-Like Carbon Nitride: A Resil- ient Coating Material,” MRS Bulletin, Vol. 28, No. 3, Copyright © 2012 SciRes. WJNSE  M. MATSUOKA ET AL. Copyright © 2012 SciRes. WJNSE 102 2003, pp. 194-202. doi:10.1557/mrs2003.62 [29] T. W. Anderson and D. A. Darling, “Asymptotic Theory of Certain Goodness of Fit Criteria Based on Stochastic Processes,” Annals of Mathematical Statistics, Vol. 23, No. 2, 1952, pp. 193-212. doi:10.1214/aoms/1177729437 [30] User Manual of the Software Action, “Teste de Ander- son-Darling,” Chapter 6.3. http://www.portalaction.com.br/content/63-teste-de-ander son-darling [31] F.-R. Weber and H. Oechsner, “Properties of Carbon Nitride Layers Generated by Direct Plasma Beam Depo- sition,” Surface and Coatings Technology, Vol. 74-75, Part 2, 1995, pp. 704-709. doi:10.1016/0257-8972(95)08269-7 [32] J. T. Titantah and D. Lamoen, “Carbon and Nitrogen 1s Energy Levels in Amorphous Carbon Nitride Systems: XPS Interpretation Using First-Principles,” Diamond and Related Materials, Vol. 16, No. 3, 2007, pp. 581-588. doi:10.1016/j.diamond.2006.11.048 [33] B. Marchon, J. Gui, K. Grannen, G. C. Rahch, J. W. Ager III, S. R. P. Silva and J. Robertson, “Photoluminescence and Raman Spectroscopy in Hydrogenated Carbon Films,” IEEE Transactions on Magnetics, Vol. 33, No. 5, 1997, pp. 3148-3150. doi:10.1109/20.617873 [34] A. C. Ferrari and J. Robertson, “Interpretation of Raman Spectra of Disordered and Amorphous Carbon,” Physical Review B, Vol. 61, No. 20, 2000, pp. 14095-14107. doi:10.1103/PhysRevB.61.14095 [35] F. Tuinstra and J. L. Koenig, “Raman Spectra of Graph- ite,” The Journal of Chemical Physics, Vol. 53, No. 3, 1970, pp. 1126-1130. doi:10.1063/1.1674108 [36] J. Schwan, S. Ulrich, V. Batori, H. Ehrhardt and S. R. P. Silva, “Raman Spectroscopy on Amorphous Carbon Films,” Journal of Applied Physics, Vol. 80, No. 1, 1996, pp. 440-447. doi:10.1063/1.362745 [37] M. Lejeune, S. Charve t, A. Zeinert and M. Benlahsen, “Optical Behavior of Reactive Sputtered Carbon Nitride Films during Annealing,” Journal of Applied Physics, Vol. 103, No. 1, 2008, pp. 0135071-0135078. doi:10.1063/1.2828166 [38] J. R. Pels, F. Kapteijn, J. A. Moulijn, Q. Zhu and K. M. Thomas, “Evolution of Nitrogen Functionalities in Car- bonaceous Materials during Pyrolysis,” Carbon, Vol. 33, No. 11, 1995, pp. 1641-1653. doi:10.1016/0008-6223(95)00154-6 [39] Q. Zhu, S. L. Money, A. E. Russell and K. M. Thomas, “Determination of the Fate of Nitrogen Functionalities in Carbonaceous Materials during Pyrolysis and Combustion Using X-Ray Absorption Near Edge Structure Spectros- copy,” Langmuir, Vol. 13, No. 7, 1997, pp. 2149-2157. doi:10.1021/la961027s [40] M. C. Santos and F. Alvarez, “Nitrogen Substitution of Carbon in Graphite: Structure Evolution toward Molecu- lar Forms,” Physical Review B, Vol. 58, No. 20, 1998, pp. 13918-13924. doi:10.1103/PhysRevB.58.13918 [41] I. Jiménez, R. Gago, J. M. Albella, D. Cáceres and I. Vergara, “Spectroscopy of Bonding in Hard Graphitic Carbon Nitride Films: Superstructure of Basal Planes and Hardening Mechanisms,” Physical Review B, Vol. 62, No. 7, 2000, pp. 4261-4264. doi:10.1103/PhysRevB.62.4261 [42] H. Sjöström, S. Stafström, M. Boman and J.-E. Sundgren, “Superhard and Elastic Carbon Nitride Thin Films Hav- ing Fullerenelike Microstructure,” Physical Review Let- ters, Vol. 75, No. 7, 1995, pp. 1336-1339. doi:10.1103/PhysRevLett.75.1336
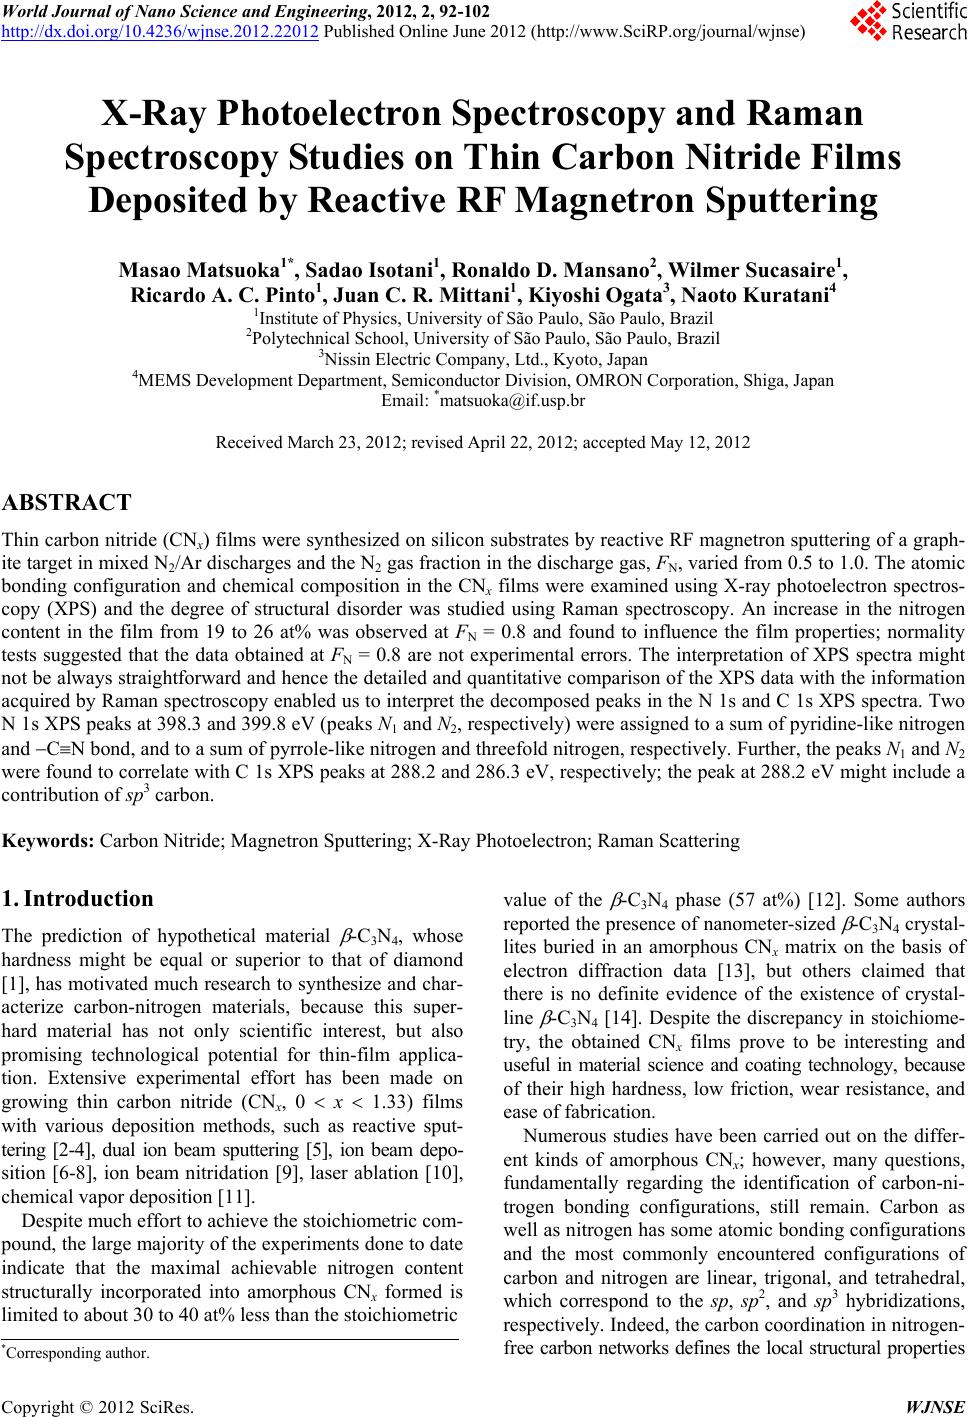
|