Paper Menu >>
Journal Menu >>
 Open Journal of Soil Science, 2012, 2, 71-81 http://dx.doi.org/10.4236/ojss.2012.22011 Published Online June 2012 (http://www.SciRP.org/journal/ojss) 71 Tillage and Rice-Wheat Cropping Sequence Influences on Some Soil Physical Properties and Wheat Yield under Water Deficit Conditions Sandeep Kumar1*, Pradeep K. Sharma2, Stephen H. Anderson3, Kapil Saroch4 1Carbon Management & Sequestration Center, School of Environment & Natural Resources, Ohio State University, Columbus, USA; 2Department of Soil Science, CSK HPKV, Palampur, India; 3Department of Soil, Environmental and Atmospheric Sciences, Univer- sity of Missouri, Columbia, USA; 4Department of Agronomy, Forage and Grassland Management, CSK HPKV, Palampur, India. Email: *kumar.278@osu.edu Received February 2nd, 2012; revised March 10th, 2012; accepted March 18th, 2012 ABSTRACT Adopting a better tillage system not only improves the soil hea lth and crop productivity but also improves the en viron- ment. A field experiment was conducted to investigate the effects of tillage and irrigation management on wheat (Triti- cum aestivum L.) production in a po st-rice (Oryza sativa L.) management system on silty clay loam soil (acidic Alfisol) for 2003-2006. Four irrigation levels (RF: rainfed; I1: irrigation at crown root initiation (CRI); I2: irrigation at CRI + flowering; I3: irrigation at CRI + tillering + flowering), and two tillage systems (ZT: zero tillage and CT: conv entional tillage) were tested. Zero tillage compared to CT, resulted in higher bulk density (1.34 vs 1.23 Mg·m–3), lower total porosity (48.7% vs 52.9%), higher penetration resistance (1.51 vs 1.37 MPa), lower saturated hydraulic conductivity (1.60 vs 92.0 mm·h–1), lower infiltration rate (9.40 vs 36.6 mm·h–1) and higher volumetric available water capacity (7.9% vs 7.5%) in the surf ace 0.15 m soil layer. Irrigation levels significantly affected crop water use, wheat yield, and water use efficiency (WUE). Average total water use was 461, 491, 534 and 580 mm under RF, I1, I2 and I3 treatments, respectively. Grain and straw yield of wheat were statistically the same under ZT and CT during 2003-2004; the values, averaged over four irrigation levels were 2.10 and 2.38 Mg·ha–1 for grain, and 3.46 and 3.67 Mg·ha–1 for straw, respec- tively. Grain yield declined by 22%, 11% and 8% of I3 (2.32 Mg·ha–1) with RF, I1 and I2 treatments, respectively, under ZT; and by 13%, 8% and 5% of I3 (2.61 Mg·ha–1) with RF, I1 and I2 treatments under CT. Average values of WUE were 4.33 kg·ha–1·mm–1 and 2.35 m3·kg–1 grain for the ZT and CT treatments. Wheat yield increased with increased irriga- tion levels for all the cropping seasons. Results from this study concluded that ZT system was better compared to the CT system even with lower yields due to lower input costs for this treatment. Keywords: Conventional Tillage; Soil Physical Properties; Infiltration; Water Retention ; Water Use Efficiency; Zero Tillage 1. Introduction Rice and wheat in sequence are cultivated in two contra- sting soil environments. Rice requires soft, puddled and water-saturated soil conditions, while wheat requires well aggregated and well aerated soil with fine tilth. Puddling (wet tillage) is the most common technique of land pre- paration for rice in South Asian countries. Puddling cre- ates soil conditions ideal for rice cultivation, but unsuit- able for upland crops which follow rice [1,2]. After rice harvest, puddled soils, upon drying shrink, b ecome com- pact and hard, and develop surface cracks of varying sizes and shapes. The draught power requirement for tilling such soils is very high, sometimes beyond the reach of local ploughs and small tractors. Nevertheless, when tilled, these soils often br eak into larger clods, hav- ing high breaking energy [3]. In spite of spending sig- nificant time and energy, it is often difficult to obtain seedbeds with the desired tilth for sowing wheat. Wheat planted in seedbeds with coarse tilth, due mainly to poor seed-soil contact, results in poor seedling emergence and unsatisfactory crop stands. This lowers wheat producti- vity. Frequent stirring opens the soil, breaks soil clods and aggregates, and enhances the oxidation of soil organic matter [4,5]. The loose soils especially on sloping land- scapes and in high rainfall areas, are excessively prone to soil erosion. Thus, this system enhances land degradation and results in a decline in soil quality. To achieve satisfactory soil tilth , soils must be tilled at optimum moisture content. The optimum water content *Corresponding a uthor. Copyright © 2012 SciRes. OJSS  Tillage and Rice-Wheat Cropping Sequence Influences on Some Soil Physical Properties and Wheat Yield under Water Deficit Conditions 72 range in puddled soils is generally narrow [1], and many times difficult for farmers to observe. Further, puddled soils may take from several weeks to months to dry and reach a moisture content optimum for tillage. This in- creases the lag time between rice harvest and wheat planting. The delayed sowing of wheat is another cause of low productivity in post-rice management. An esti- mate suggests each day delay in planting after 15th of November lowers wheat yield by about 0.04 Mg·ha–1 [6,7]. Conventional cultivation of wheat involves several repetitions (3 to 7) of ploughing and planking with ani- mal-drawn local p loughs and wood en planks. The idea of repeated tillage is to create a seedbed with fine tilth and create a dust mulch to conserve soil moistu re in the seed- bed. In high rainfall areas (annual rainfall varying be- tween 1500 - 2500 mm), these soils suffer from severe soil erosion. Hence, a conservation tillage system is re- quired which is less intensive, is better for the environ- ment (reduces carbon emissions), and enhances soil structural stability and helps to conserv e soil by reducing erosion risks [8]. Field experiments with zero tillage in wheat at sev eral locations in the Indo-Gangetic plains have shown encour- aging results [9-11]. Farmers have found direct drilling of wheat into post-rice systems without tillage feasible and beneficial at several locations. Wheat yields with zero tillage are either equal or even better than those ob- tained with conventional tillage because of timely plant- ing of wheat, efficient use of fertilizers and weed control. In addition, zero tillage is fuel and energy efficient but also reduces greenhouse gas emissions [12]. Zero tillage systems conserve the land resource and are cost effective and efficient. Moreover, this tillage system also avoids challenges with clod formation. Benefits of zero-till plan ting have been reported under irrigated conditions. Whether similar benefits can be ob- tained under deficit water conditions still remains a qu es- tion. The issue is more relevant to hilly areas, as in the Himachal Pradesh (HP) state of India, where wheat is principally a rainfed crop. Irrigated areas under wheat in HP, India are less than 18%. Deficit irrigation systems also need to be evaluated relative to performance with zero-till planting. The objectives of the current study were to 1) compare soil physical properties under zero and conventional tillage systems for a rice-wheat cropp- ing system, and 2) compare wheat yields, and wheat wa- ter use efficiency (WUE) for zero and conventional till- age systems. 2. Materials and Methods 2.1. Experimental Site and Management The experiment was conducted at the Experimental Farm of the Department of Soil Science, CSK Himachal Pra- desh Krishi Vishvavidyalaya, Palampur, Himachal Pra- desh (HP). The experimental site was situated at 32˚6'N latitude and 76˚3'E longitude at an elevation of about 1290 m above mean sea level. The area lies in th e Palam Valley of Kangra district in the foothills of Dhauladhar Range and represents the high rainfall, mid-elevation, wet-temperate zone of Himachal Pradesh in the North- west Himalayas. The climate of the study area is wet temperate, char- acterized by severe winters and mild summers. The ave- rage annual rainfall of the study area in the last 10 years was 2058 mm and pan evaporation was 1215 mm. The annual maximum temperature is 22.4˚C and the mini- mum temperature is 13.3˚C. Annual mean temperature varies from 8.2˚C in January to around 28.0˚C during the months of May-June. The soil temperature drops as low as 2˚C during the winters and frost incidences are com- mon. The soils of the region are classified as Gray Brown Podzols, as per the Genetic System of Classification. Ta- xonomically, these soils fall under the order of Alfisols [13]. These soils owe their origin to the fluvio-glacial parent materials developed from rocks like slate, phyl- lites, quartzites, schists and gneisses. The soils are acid ic (pH 5.2 to 6.3). The experimental soils belonged to sub- group Typic Hapludalfs. 2.2. Treatment Details A field experiment was conducted in 2003-2006. Soil physical properties were measured for 2003-2004 year, and wheat yield and water use efficiency were also com- pared for three cropping seasons from 2003 to 2006 for different treatments. Two tillage systems (ZT: zero till- age and CT: conventional tillage) and four irrigation le- vels (RF: rainfed; I1: irrigation at CRI; I2: irrigation at CRI + flowering; I3: irrigation at CRI + tillering + flow- ering) were tested. The two tillage systems included 1) zero tillage: wheat sown in lin es 0.20 m apart by opening narrow slits with a hand plough in untilled plots (ZT), and 2) conventional tillage: wheat was sown in lines 0.20 m apart with the help of a hand plough in well pu lverized plots (CT). The four irrigation management systems in- cluded 1) rainfed (RF), 2) irrigation at CRI (CRI), 3) irrigation at CRI and flowering stage (CRI + F), and 4) irrigation at CRI, active tillering and flowering stages (CRI + T + F). It is noted that each irrigation of about 5 cm was applied as surface flooding per treatment. One pre-sowing irrigation was applied to all plots. The total number of treatment combinations was eight with three replications for 24 total nu mber of plots (9 m2 areas). The treatment effect was investigated for wheat crop (Surbhi, HPW-89) and the experimental design was Copyright © 2012 SciRes. OJSS  Tillage and Rice-Wheat Cropping Sequence Influences on Some Soil Physical Properties and Wheat Yield under Water Deficit Conditions Copyright © 2012 SciRes. OJSS 73 a randomized complete block. Land preparation was done with the help of a power tiller (Model CT-85, V.S.T. Tillers Tractors Ltd., Bangalore, India). Different field operations and irrigation scheduling during the experi- ment are summarized in Tables 1 and 2. ples (0 - 0.15 and 0.15 - 0.30 m) was done using the pi- pette method [14]. Particle density of the soil was deter- mined by the pycnometer method [15]. The soil textural class was silty clay loam and the particle density of the soil was 2.60 and 2.61 Mg·cm–3, respectively for 0 - 0.15 and 0.15 - 0.30 m soil depths. The soil bulk density (b ) was determined before land preparation and 30-d ays after sowing of wheat by the core sampler method [16], using metallic cores having 0.138 m length and 0.103 m inter- nal diameter. Undisturbed soil cores were collected from the 0 - 0.60 m depth at 0.15 m depth intervals in all plots. Four soil cores were removed at each depth and the moist mass was recorded. Gravimetric moisture content was determined in a sub-sample of each soil core and was used to determine the dry mass of soil in each core. Each plot received a uniform application of 120 N kg·ha–1, 60 kg·ha–1 P2O5 and 40 kg·ha–1 K2O as urea, sin- gle super phosphate and muriate of potash during the growing season. For the rainfed treatment (no irrigation applications), all fertilizers were band-placed at the time of sowing in November. For the irrigation treatment at crown root initiation (CRI; I1), 50% of the N and all of the P and K were band-placed at the time of sowing with 50% of N broadcast applied at CRI stage during No- vember and December. For the irrigation treatments at CRI + flowering (I2) and irrigation at CRI + active tiller- ing + flowering (I3), 50% of the N and all of the P and K were band-placed at sowing with 25% of N broadcast applied, each at CRI and flowering stage. The total porosity (ƒ) of the 0 - 0.15 m soil layer was determined at 30-days after seeding from data on particle density and b , using the following relationship: 1 100 bs f (1) 2.3. Soil Physical Properties where, ƒ is the total porosity (%), b the bulk density (Mg·m–3) and s the particle density (Mg·m–3). Particle size analysis of surface and sub-surface soil sam- Table 1. Summary of field operations performed during the study for the 2003-2004 cropping season. The same operations were performed for the 2004-2005 and 2005-2006 cropping years within a couple days of the dates for the 2003-2004 season. Date Field operation Remarks Nov. 6 Pre-plant irrigation Flood-irrigation method. Nov. 9 Land preparation in conventionally-tilled plotsLand prepared using a power tiller. Nov. 11 Planting of wheat Wheat sown in rows at 0.20 m spacing using hand p lough at 100 kg·ha–1 seed rate. Dec. 27 Hand weeding and hoeing Weeding in all plots. Hoeing only in conventionally-tilled plots. Jan. 28 Hand weeding and hoeing Weeding in all the plots. Hoeing only in conventionally-tilled plots. May 6 Crop harvesting Wheat harvested in 5.76 m2 area in centre of each p l ot. Table 2. Irrigation timing and amount of water applied to the zero tillage (ZT) and conventional tillage (CT) treatments for the irrigation regime treatments for the 2003-2004 cropping year. The same amounts were applied within a couple of days of the dates for the 2003-2004 cropping years for the 2004-2005 and 2005-2006 cropping years. Amount of Irrigation Water Applied (mm) Irrigation Application Dates Irrigation Regime Treatment Tillage Treatment Nov. 6 Dec. 12 Jan. 11 March 3 Total water applied ZT 50 - - - 50 RF CT 50 - - - 50 ZT 50 50 - - 100 I1 CT 50 50 - - 100 ZT 50 50 - 50 150 I2 CT 50 50 - 50 150 ZT 50 50 50 50 200 I3 CT 50 50 50 50 200 RF = Rainf ed; I1 = Irrigation at crown root initiation (CRI); I2 = Irrigation at CRI and flowering stage; I3 = Irrigation at CRI and active tillering and flowering stage.  Tillage and Rice-Wheat Cropping Sequence Influences on Some Soil Physical Properties and Wheat Yield under Water Deficit Conditions 74 Undisturbed soil cores were collected from the 3 rep- licates in metal cores of 0.11 m length and 0.081 m dia- meter in the 0 - 0.15 m soil depth in both zero-till and conventionally-tilled plots at crop harvest. The saturated hydraulic conductivity (Ksat) was determined by the con- stant head method [17]. 2.4. Soil Water Content Soil water content was determined gravimetrically in the 0 to 0.60 m profile at 0.15 m depth intervals at sowing, one-day before and after each irrigation and at crop har- vest. The mass wetness was converted into volume wet- ness for each soil layer using the b of each respective soil layer. 2.5. Soil Penetration Resistance Soil penetrometer resistance (SPR) refers to the resis- tance offered by the soil to a metal pro be (representing a plant root) pushed into soil. The SPR at field moisture content was determined in the 0 - 0.03 and 0.10 - 0.13 m soil depths at tillering stag e. A Proctor penetrometer hav- ing a 0.18 m long prob e with a flat tip of 6 mm diameter was used for SPR determination. About seven observa- tions were made per plot at each depth for computing the average SPR. After recording the SPR value, soil sam- ples from the layer of the same depth thickness were col- lected with the help of a tube auger for determining gra- vimetric moisture content. 2.6. Soil Water Retention Undisturbed soil core samples, 0.03 m long and 0.054 m diameter were collected from each replication in the middle of the 0 - 0.075 m soil layer with metal cores at the flowering stage of wheat. Moisture content at –33, and –1500 kPa matric potential was determined with a pressure plate apparatus (Soil Moisture Equipment Co., Santa Barbara, California, USA). Soil samples were satu- rated for 24 hours on the porous plate and then equili- brated to the applied pressures. Plant-available water capacity (PAWC) was deter- mined for each treatment at flowering stage of wheat as follows: PAWC = FC – PWP (2) where FC is the moisture retained at –33 kPa matric po- tential, and PWP (permanent wilting point) is the mois- ture retained at –1500 kPa matric potential. 2.7. Infiltration Measurements The infiltration behavior of the soil under zero and con- ventional tillage treatments was studied at the time of wheat harvest using double ring infiltrometers. The infil- trometers were pushed into the ground to a depth of 0.15 m. Care was taken to avoid formation of cracks at the soil surface while the infiltrometers were driven into the soil. Water was filled almost to the same level in the in- ner and outer rings with 0.25 and 0.30 m of inner and outer diameter, respectively. The volume of water which infiltrated into the soil as a function of time was meas- ured. The depth of water infiltrated was computed by dividing the volume by the cross-sectional area of the inner infiltrometer. Regular determinations were made at periodical intervals until a steady water flux was reached. The water intake rate (i) and the cumulative intake (I) were plotted on a simple scale as a function of time. The Gree-Ampt model (1911) was used to fit the infiltration data. The Green-Ampt [18] infiltration equation was modi- fied by Philip [19] for time (t) vs. cumulative infiltration (I), as follows: 2 2 2 2 ln 1 2 s ss IK S IS tKK (3) where t (T) is time (h), I (L) is the cumulative infiltration (mm), S (L·T–0.5) is the sorptivity (mm·h–0.5), and Ks (L·T–1) is the saturated hydraulic conductivity (mm·h–1). For estimating the S and Ks parameters, the method pro- posed by Clothier et al. [20] was used. The method to estimate field saturated hydraulic con- ductivity (Kfs) suggested by Reynolds et al. [17] was used for estimating this parameter. It assumes one-di- mensional water flow in the infiltration ring, and uses th e following equation: * 12 12 11 s fs q K H CdCaCdC a (4) where Kfs is the field-saturated hydraulic conductivity (mm·h–1), qs is the quasi-steady infiltration rate (mm·hr–1), a is the radiu s of the infiltration ring (mm), H is the hydraulic h ead of ponded water in the ring ( mm), d is the depth of ring insertion into the soil (mm), C1 and C2 are dimensionless quasi-empirical constants (C1 = 0.993 and C2 = 0.578 for this infiltrometer), and α* is the soil macroscopic capillary length, assumed to be equal to 0.0036 mm–1 for the conventional tillage, and 0.012 mm–1 for the zero tillage treatment [17]. 2.8. Wheat Yield and Water Use Efficiency The wheat crop was harvested from ground level from the net plot area of 5.76 m2, centered in the plot, with the help of sickles, and was left in the respective plots for Copyright © 2012 SciRes. OJSS  Tillage and Rice-Wheat Cropping Sequence Influences on Some Soil Physical Properties and Wheat Yield under Water Deficit Conditions 75 sun-drying for 2 - 3 days. When most of the straw in a handful bundle broke up on folding, total produce was weighed and recorded as biological yield. The produce was then threshed with thresher and grains were sepa- rated out. The grains thus collected were weighed and the yield was recorded as Mg·ha–1. The water use efficiency (WUE) was computed as: 1) WUE (kg·grains·ha–1·mm–1) = Grain yield (kg·ha–1)/Total water use (mm), and 2) WUE (m3·kg–1) = Total water use (m3)/Wheat grains (kg). 2.9. Statistical Analysis The statistical design for the study was a factorial ex- periment with two levels of tillage and four levels of ir- rigation arranged in a randomized complete block design with three replicates. Some parameters were only evalu- ated for tillage plots; these were sampled from the rain- fed (RF) irrigation treatment. Statistical differences were declared significant at the α = 0.05 level. The statistical analysis was conducted with SAS sof tw are [21]. 3. Results and Discussion 3.1. Soil Penetration Resistance Soil penetration resistance (SPR) values, determined im- mediately before the application of irrigation at the tille- ring stage of wheat in the 0.10 - 0.13 m soil layer, are shown in Table 3. The SPR was significantly affected by tillage, but the effect of irrigation treatments for the CT tillage system on SPR was non-significant. SPR values varied between 1.40 and 1.61 MPa with a mean value of 1.51 MPa under ZT, and between 1.31 and 1.35 MPa with a mean value of 1.34 MPa under CT. The SPR was significantly higher under ZT than CT for all irrigation levels. The gravimetric soil moisture content was 17.6% - 20.0% under ZT, and 19.1% - 21.8% under CT (Table 3). Soil penetration resistance (SPR) values averaged over four irrigation levels, determined at 0 - 0.03 m and 0.10 - 0.13 m soil depths at crop harvest are shown in Table 4 . The SPR at field moisture content (9.3% - 12.2%) was higher in the ZT system than the CT system with a mag- nitude of about 4 times in the 0 - 0.03 m layer, and about 2.5 times in 0.10 - 0.13 m layer. Higher SPR in the ZT plots were found due to the higher soil b value (1.34 Mg·m–3) in ZT plots compared to CT plots (1.23 Mg·m–3; Table 5). 3.2. Soil Bulk Density, Saturated Hydraulic Conductivity and Porosity The b was about 8.9% higher in ZT compared to CT plots (Table 5). The soil Ksat (0 - 0.15 m depth), deter- mined at wheat harvest, was 57 times higher under CT than ZT (Tab le 5). Infiltration rate and Ksat are both func- tions of pore size distribution. Both of these processes increase with an increase in soil macroporosity. Conven- tional tillage caused loosening of the surface soil layer thereby increasing the macroporosity and hence increas- ing the infiltration rate and Ksat. Singh et al. [22] also observed an increase in Ksat in a post-rice soil after tillag e. Higher values of infiltration as well as Ksat under CT than ZT were also reported by Barzegar [23]. The situation, however, may be different under continuous zero till systems than in rice-wheat system. A soil, continuously under zero till manag ement, especially when crop residues are left on the soil surface, may show higher infiltration rates and Ksat values due to root channels formed in soil and enhanced earthworm Table 3. Soil penetration resistance (SPR), and soil water content in the subsurface soil layer (0.10 - 0.13 m) at tillering stage of wheat under different tillage and irrigation treatments measured during the 2003-2004 cropping season. Tillage Treatment Irrigation Regime Treatment Gravimetric soil water content (g/g %)SPR (MPa) RF 17.9de 1.61a I1 17.6e 1.55b I2 20.0bc 1.44c ZT I3 19.5c 1.40d RF 19.8bc 1.35e I1 21.8a 1.31f I2 19.1dc 1.33ef CT I3 21.0ab 1.35e Analysis of variance P > F Treatment <0.01 <0.01 ZT = Zero tillage; CT = Conventional tillage; RF = Rainfed; I1 = Irrigation at CRI s tag e; I2 = Irrigation at CRI and flowering stage; I3 = Irrigation at CRI, tiller- ing and flowering stage; Note: The SPR values have been averaged over different irrigation treatments because of small differences in soil moisture content. Copyright © 2012 SciRes. OJSS  Tillage and Rice-Wheat Cropping Sequence Influences on Some Soil Physical Properties and Wheat Yield under Water Deficit Conditions 76 Table 4. Soil penetration resistance (SPR) and soil water content for two soil depths at crop harvest in the zero tillage (ZT) and conventionally-tilled (CT) treatments measured at crop harvest during the 2003-2004 cropping season. Tillage 0 - 0.03 m soil depth 0.10 - 0.13 m soil depth Water content SPR Water content SPR ZT (g/g %) 12.2a† (MPa) 5.16a (g/g %) 9.3a (MPa) 8.36a CT 11.7b 1.28b 11.4b 3.39b Treatment <0.01 <0.01 <0.01 <0.01 †Means with different letters are significantly different at the 0.05 probability level. Table 5. Saturated hydraulic conductivity (Ksat), bulk density, and total porosity of the surface soil layer (0 - 0.15 m) under zero tillage (ZT) and conventional tillage (CT) treatments at 30 days after seeding of wheat for the 2003-2004 cropping sea- son. Tillage Ksat (mm·h–1) Bulk density ( Mg·m–3) Total porosity (%) ZT 1.62a† 1.34a 49.3a CT 92.0b 1.23b 53.7b Analysis of variance P > F Treatment <0.01 <0.01 <0.01 †Means with different letters are significantly different at the 0.05 probability level. activity as was observed by Barnes and Ellis [24]. Seve- ral other workers reported higher infiltration rate under ZT system due to the formation of continuous soil bio- pores [25-27]. Loch and Coughlan [28] reported higher deep drainage under ZT than CT due to the presence of continuous macropor es under ZT. 3.3. Soil Water Retention Water retention of the surface 0.075 m soil layer on a mass basis at –33 kPa and –1500 kPa soil water pressure was always higher in CT than in ZT plots. The differ- ences, however, narrowed with the decrease in water potential. Water con tent on a volume basis was higher in the ZT system than the CT system at –33 and –1500 kPa pressure due to differences in b (Table 6). The plant available water capacity (PAWC) on a volume basis was lower for the CT (7.5%) than ZT (7.9%) treatment (Ta- ble 6). Soil water retention (0 - 0.75 m soil layer) at –33 and –1500 kPa water pressures varied with tillage system. These differences could be explained with differences in pore size distribution since the water retention of soils depends primarily on 1) the number and size distribution of soil pores and 2) the specific surface area of soils. Pore size distribution affects water retention mainly at higher water potentials, such as those at saturation and field capacity, where the water retention is a function of soil structure. At lower water potentials, close to the per- manent wilting point, the water retention is a function of soil texture, and also depends on the specific surface area of soil particles [29]. Tillage modified the soil structure thereby affecting water retentio n at –33 kPa water poten- tial; however, tillage did not affect soil texture, hence differences in water retention between CT and ZT nar- rowed at –1500 kPa water potential. The water retention on a volume basis at –33 and –1500 kPa pressure was higher under ZT than CT (Table 6). This occurred in part because of the higher b under ZT than CT. Although differences in PAWC between ZT and CT were not very large, the soil water retention un- der ZT was slightly better than under CT. 3.4. Infiltration Rate The steady-state infiltration rate in conventionally-tilled plots (32.6 mm·h–1) was more than 4 times higher than that of zero tilled plots (7.2 mm·h–1). The cumulative infiltration was also higher in CT (665 mm) than in ZT plots (278 mm). The steady-state infiltration in both cases was achieved in about an 11-hour period (Figure 1). The Green-Ampt (GA) model was fitted to measured infiltration data. The GA model appeared to fit the mea- sured infiltration data (Figure 1). The Ks parameter was significantly different, whereas, the S parameter was not significantly different between the tillag e systems (Table 7). The Ks parameter was 47 times higher for the conven- tional tillage compared to zero tillage treatment (Table 7). The Kfs and qs parameters were significantly different between the CT and ZT systems (Table 8). The Kfs was about 5.4 times higher for CT compared to ZT (Table 8 ); whereas the qs was about 4.5 times higher for this system Copyright © 2012 SciRes. OJSS 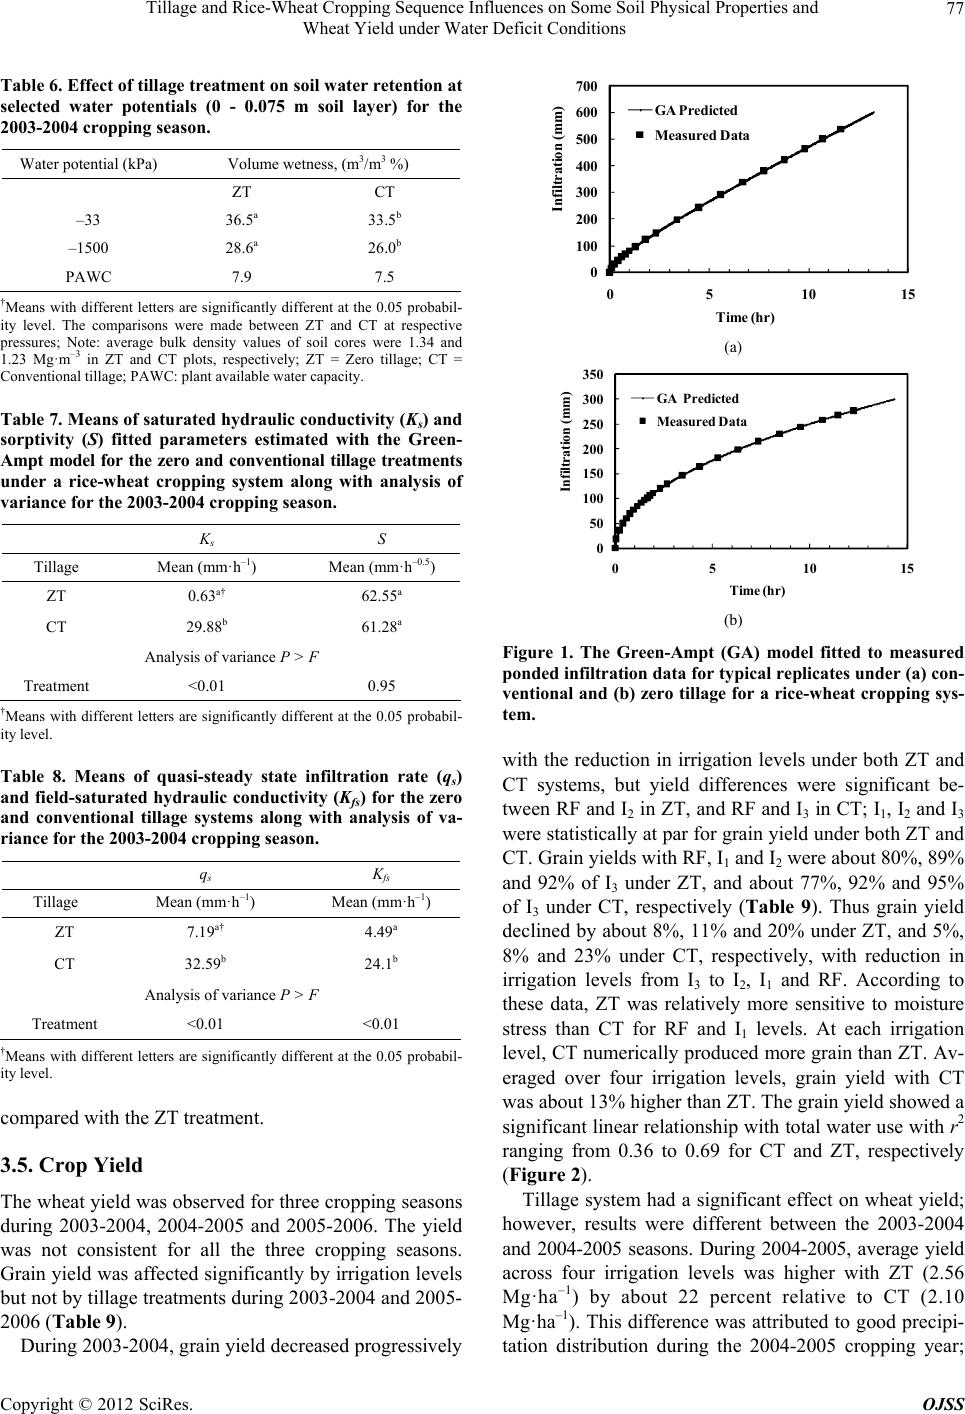 Tillage and Rice-Wheat Cropping Sequence Influences on Some Soil Physical Properties and Wheat Yield under Water Deficit Conditions 77 Table 6. Effect of tillage treatment on soil water retention at selected water potentials (0 - 0.075 m soil layer) for the 2003-2004 cropping season. Water potential (kPa) Volume wetness, (m3/m3 %) ZT CT –33 36.5a 33.5b –1500 28.6a 26.0b PAWC 7.9 7.5 †Means with differen t letters are sign ificantly differ ent at the 0.05 prob abil- ity level. The comparisons were made between ZT and CT at respective pressures; Note: average bulk density values of soil cores were 1.34 and 1.23 Mg·m–3 in ZT and CT plots, respectively; ZT = Zero tillage; CT = Conventional tillage; PAWC: plant available water capacity. Table 7. Means of saturated hydraulic conductivity (Ks) and sorptivity (S) fitted parameters estimated with the Green- Ampt model for the zero and conventional tillage treatments under a rice-wheat cropping system along with analysis of variance for the 2003-2004 cropping season. Ks S Tillage Mean (mm·h–1) Mean (mm·h–0.5) ZT 0.63a† 62.55a CT 29.88b 61.28a Analysis of variance P > F Treatment <0.01 0.95 †Means with differen t letters are sign ificantly differ ent at the 0.05 prob abil- ity level. Table 8. Means of quasi-steady state infiltration rate (qs) and field-saturated hydraulic conductivity (Kfs) for the zero and conventional tillage systems along with analysis of va- riance for the 2003-2004 cropping season. qs K fs Tillage Mean (mm·h–1) Mean (mm·h–1) ZT 7.19a† 4.49a CT 32.59b 24.1b Analysis of variance P > F Treatment <0.01 <0.01 †Means with differen t letters are sign ificantly differ ent at the 0.05 prob abil- ity level. compared with the ZT treatment. 3.5. Crop Yield The wheat yield was observed for three cropping seasons during 2003-2004, 2004-2005 and 2005-2006. The yield was not consistent for all the three cropping seasons. Grain yield was affected significantly by irrigation levels but not by tillage treatments during 2003 -2004 and 200 5- 2006 (Table 9). During 2003-20 04 , g rain yield d ecr eased progr essive ly 0 100 200 300 400 500 600 700 0510 15 Infiltration (mm) Ti me (h r) GA Predicted Measured Data (a) 0 50 100 150 200 250 300 350 0510 15 Infiltration (mm) Ti me ( hr ) GA Predicted Measured Data (b) Figure 1. The Green-Ampt (GA) model fitted to measured ponded infiltration data for typical replicates under (a) con- ventional and (b) zero tillage for a rice-wheat cropping sys- tem. with the reduction in irrigation levels under both ZT and CT systems, but yield differences were significant be- tween RF and I2 in ZT, and RF and I3 in CT; I 1, I2 and I3 were statistically at par for grain yield und er both ZT and CT. Grain yields with RF, I1 and I2 were about 80%, 89% and 92% of I3 under ZT, and about 77%, 92% and 95% of I3 under CT, respectively (Table 9). Thus grain yield declined by about 8%, 11% and 20% under ZT, and 5%, 8% and 23% under CT, respectively, with reduction in irrigation levels from I3 to I2, I1 and RF. According to these data, ZT was relatively more sensitive to moisture stress than CT for RF and I1 levels. At each irrigation level, CT numerically produced more grain than ZT. Av- eraged over four irrigation levels, grain yield with CT was about 13 % higher th an ZT. The gr ain yield show ed a significant linear relationship with total water use with r2 ranging from 0.36 to 0.69 for CT and ZT, respectively (Figure 2). Tillage system had a significant effect on wheat yield; however, results were different between the 2003-2004 and 2004-2005 seasons. During 2004-2005, average yield across four irrigation levels was higher with ZT (2.56 Mg·ha–1) by about 22 percent relative to CT (2.10 Mg·ha–1). This difference was attributed to good precipi- tation distribution during the 2004-2005 cropping year; Copyright © 2012 SciRes. OJSS 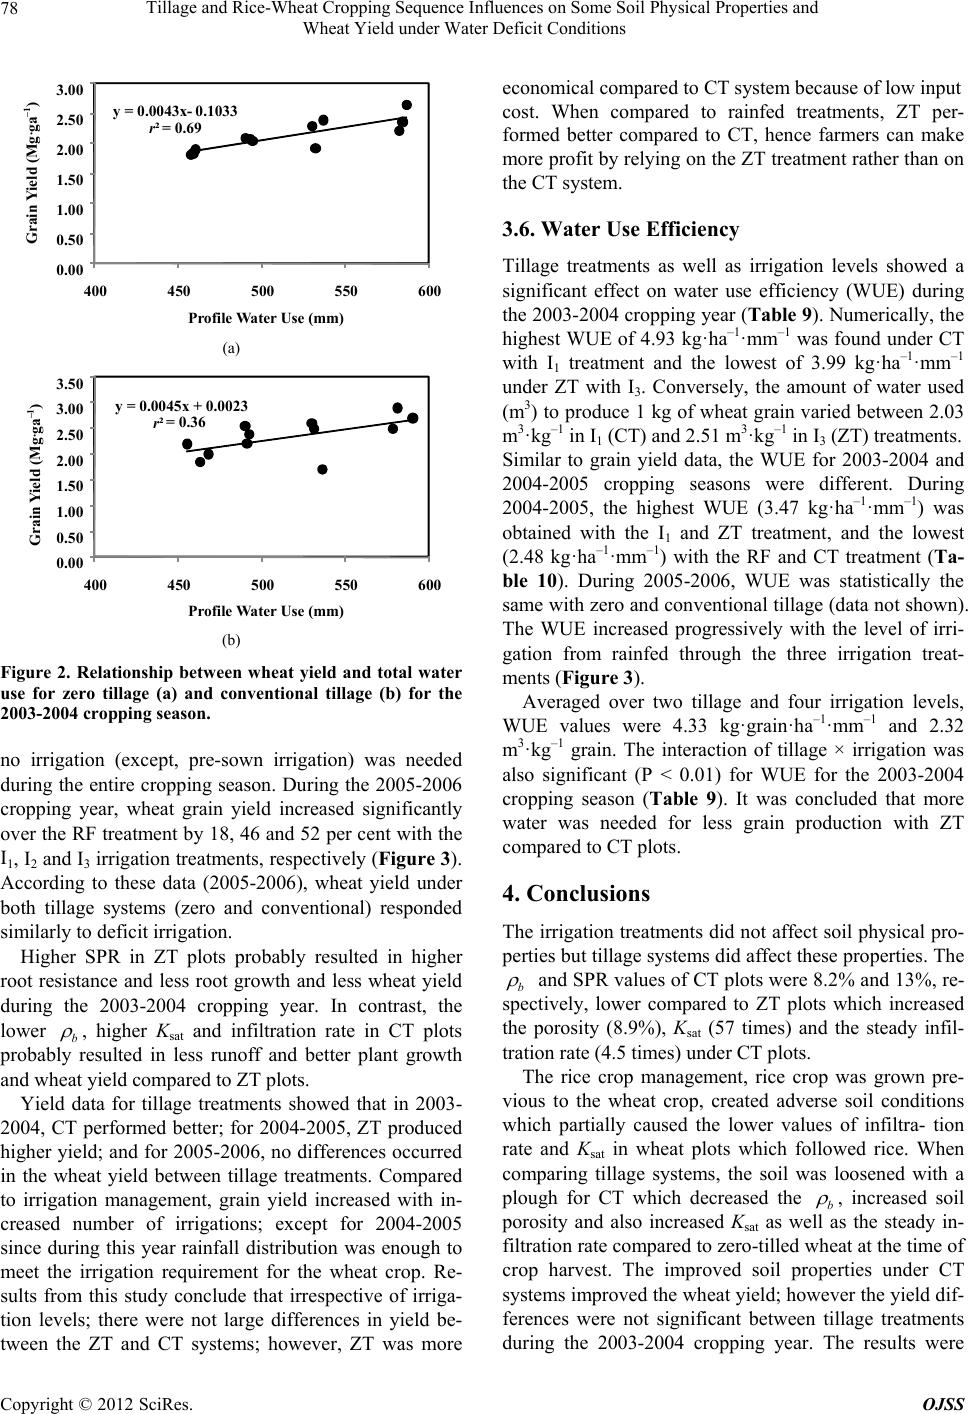 Tillage and Rice-Wheat Cropping Sequence Influences on Some Soil Physical Properties and Wheat Yield under Water Deficit Conditions 78 y = 0.0043x - 0.1033 r²= 0.69 0.00 0.50 1.00 1.50 2.00 2.50 3.00 400 450 500 550 60 0 - 1 ) Profile Water Use (mm) Grain Yield (Mg·ga –1 ) (a) y = 0.0045x + 0.0023 r² = 0.36 0.00 0.50 1.00 1.50 2.00 2.50 3.00 3.50 400 450 500 550 60 0 - 1 ) Profile Water Use ( mm ) Grain Y ield (Mg·g a –1 ) (b) Figure 2. Relationship between wheat yield and total water use for zero tillage (a) and conventional tillage (b) for the 2003-2004 cropping season. no irrigation (except, pre-sown irrigation) was needed during the entire cropping season. During the 2005-2006 cropping year, wheat grain yield increased significantly over the RF treatment by 18, 46 and 52 per cent with the I1, I2 and I3 irrigation treatments, respectively (Figure 3). According to these data (2005-2006), wheat yield under both tillage systems (zero and conventional) responded similarly to deficit irrigation. Higher SPR in ZT plots probably resulted in higher root resistance and less root growth and less wheat yield during the 2003-2004 cropping year. In contrast, the lower b , higher Ksat and infiltration rate in CT plots probably resulted in less runoff and better plant growth and wheat yield compared to ZT plots. Yield data for tillage treatments showed that in 2003- 2004, CT performed better; for 2004-2005, ZT produced higher yield; and for 2005-2006, no differences occurred in the wheat yield between tillage treatments. Compared to irrigation management, grain yield increased with in- creased number of irrigations; except for 2004-2005 since during this year rainfall distribution was enough to meet the irrigation requirement for the wheat crop. Re- sults from this study conclude that irrespective of irriga- tion levels; there were not large differences in yield be- tween the ZT and CT systems; however, ZT was more economical compared to CT system because of low input cost. When compared to rainfed treatments, ZT per- formed better compared to CT, hence farmers can make more profit by relying on the ZT treatment rather than on the CT system. 3.6. Water Use Efficiency Tillage treatments as well as irrigation levels showed a significant effect on water use efficiency (WUE) during the 2003-2004 cropp ing year (Table 9). Numerically, th e highest WUE of 4.93 kg·ha–1·mm–1 was found under CT with I1 treatment and the lowest of 3.99 kg·ha–1·mm–1 under ZT with I3. Conversely, the amount of water used (m3) to produce 1 kg of wheat gr ain varied be tween 2.03 m3·kg–1 in I1 (CT) and 2.51 m3·kg–1 in I3 (ZT) treatments. Similar to grain yield data, the WUE for 2003-2004 and 2004-2005 cropping seasons were different. During 2004-2005, the highest WUE (3.47 kg·ha–1·mm–1) was obtained with the I1 and ZT treatment, and the lowest (2.48 kg·ha–1·mm–1) with the RF and CT treatment (Ta- ble 10). During 2005-2006, WUE was statistically the same with zero and convention al tillage (data not shown ). The WUE increased progressively with the level of irri- gation from rainfed through the three irrigation treat- ments (Figure 3). Averaged over two tillage and four irrigation levels, WUE values were 4.33 kg·grain·ha–1·mm–1 and 2.32 m3·kg–1 grain. The interaction of tillage × irrigation was also significant (P < 0.01) for WUE for the 2003-2004 cropping season (Table 9). It was concluded that more water was needed for less grain production with ZT compared to CT plots. 4. Conclusions The irrigation treatments did not affect soil physical pro- perties but tillage systems did affect these properties. The b and SPR values of CT plots were 8.2% and 13%, re- spectively, lower compared to ZT plots which increased the porosity (8.9%), Ksat (57 times) and the steady infil- tration rate (4.5 times) under CT plots. The rice crop management, rice crop was grown pre- vious to the wheat crop, created adverse soil conditions which partially caused the lower values of infiltra- tion rate and Ksat in wheat plots which followed rice. When comparing tillage systems, the soil was loosened with a plough for CT which decreased the b , increased soil porosity and also increased Ksat as well as the steady in- filtration rate compared to zero -tilled wh eat at the time of crop harvest. The improved soil properties under CT systems improved the wheat yield; however the yield dif- ferences were not significant between tillage treatments during the 2003-2004 cropping year. The results were Copyright © 2012 SciRes. OJSS  Tillage and Rice-Wheat Cropping Sequence Influences on Some Soil Physical Properties and Wheat Yield under Water Deficit Conditions Copyright © 2012 SciRes. OJSS 79 0.00 0.50 1.00 1.50 2.00 2.50 3.00 2003 - 2004 2004 - 2005 2005 - 2006 Grain Y ield (Mg·ha –1 ) (a) 0.00 1.00 2.00 3.00 4.00 5.00 6.00 RF I1 I2 I3 Irri g ation Levels 2003 - 2004 2004 - 2005 2005 - 2006 Water Use Efficiency (kg·ha –1 ·mm –1 ) (b) Figure 3. Wheat yield (a) and water use efficiency (b) for RF (rainfed), I1 (irrigation at CRI), I2 (irrigation at CRI and flow- ering), and I3 (irrigation at tillering, CRI and flowering stages) irrigation levels during the 2003-2004, 2004-2005 and 2005- 2006 cropping seasons. Table 9. Effect of different irrigation regime treatments on total water use, grain yield, and water use efficiency (WUE) for wheat under zero tillage (ZT) and conventional tillage (CT) treatments for the 2003-2004 cropping season. Irrigation regime Treatment Tillage Treatment Total water use (mm) Grain yield (Mg·ha–1) WUE (kg·grain·ha–1·mm–1) ZT 458.9d 1.85c 4.03f RF CT 463.2d 2.02bc 4.36d ZT 491.9c 2.07bc 4.21e I1 CT 489.1c 2.41ab 4.93a ZT 534.8b 2.14ab 4.00gf I2 CT 533.5b 2.47abc 4.62b ZT 581.1a 2.32ab 3.99g I3 CT 578.7a 2.61a 4.51c Analysis of variance P > F Tillage 0.95 0.06 <0.01 Irrigation <0.01 0.01 <0.01 Tillage × Irrigation 0.69 0.81 <0.01 RF = Rainf ed; I1 = Irrigation at CRI stage; I2 = Irrigation at CRI and flowering stage; I3 = Irrigation at CRI, tillering and flowering stage; WUE = Water use efficiency.  Tillage and Rice-Wheat Cropping Sequence Influences on Some Soil Physical Properties and Wheat Yield under Water Deficit Conditions 80 Table 10. Effect of different irrigation regime treatments on total water use, grain yield, and water use efficiency (WUE) for wheat under zero tillage (ZT) and conventional tillage (CT) treatments during the 2004-2005 cropping season. Irrigation regime Treatment Tillage Treatment Total water use* (mm) Grain yield (Mg·ha–1) WUE (kg·grain·ha–1·mm–1) ZT 820 2.48b 3.02e RF CT 820 2.03f 2.48c ZT 820 2.85a 3.47d I1 CT 820 2.22d 2.71a ZT 820 2.41c 2.93f I2 CT 820 2.08e 2.54b ZT 820 2.48b 3.02e I3 CT 820 2.06ef 2.51c Analysis of variance P > F Tillage - <0.01 <0.01 Irrigation - <0.01 <0.01 Tillage × Irrigation - <0.01 <0.01 *No irrigation other than pre-sown was given to wheat crop dur ing 2004-2005 season as enough rai nfall received during this season. different for the 2004-2005 and 2005-2006 cropping seasons. Irrespective of the tillage system, however, grain yield and WUE increased with increased level of irrigation (except for the 2004-2005 cropping season which received frequent rains) and values were higher with the three irrigation treatments for the cropping sea- sons which had deficit rain. Although grain yield was inconsistent between the tillage systems over years, eco- nomic costs were lower for the ZT tillage system which implies it may be the best system for occasional increases in yield and consistently lower input costs. Furthermore, this ZT system conserves soil moisture and reduces soil erosion as residues are left on the plots. REFERENCES [1] P. K. Sharma and S. K. De Datta, “Physical Properties and Processes of Puddled Rice Soils,” Advanced Soil Science, Vol. 5, 1986, pp. 139-178. doi:10.1007/978-1-4613-8660-5_3 [2] P. K. Sharma, J. K. Ladha and L. Bhushan, “Soil Physical Effects of Puddling in Rice-Wheat Cropping Systems. Improving the Productivity and Sustainability of Rice- Wheat Systems: Issues and Impacts,” ASA Special pub- lication, Vol. 65, 2003. [3] P. K. Sharma and R. M. Bhagat, “A Simple Apparatus for Measuring Clod Breaking Strength,” Journal of the In- dian Society of Soil Science, Vol. 41, 1993, pp. 422-425. [4] R. Lal, “Soils and Sustainable Agriculture: A Review,” Agronomy for Sustainable Development, Vol. 28, No. 1, 2008, pp. 57-64. [5] J. He, N. J. Kuhn, X. M. Zhang, X. R. Zhang and H. W. Li, “Effects of 10 Years of Conservation Tillage on Soil Properties and Productivity in the Farming—Pastoral Ecotone of Inner Mongolia, China,” Soil Use Manage, Vol. 25, No. 2, 2009, pp. 201-209. doi:10.1111/j.1475-2743.2009.00210.x [6] P. R. Hobbs, L. W. Harrington, C. Adhkari, G. S. Giri, S. R. Upadhya and B. Adhikari, “Wheat and Rice in Nepal Tarai: Farm Resources and Production Practices in Ru- pandhi District,” Nepal Agricultural Research Council and CIMMYT, Mexico, 1996. [7] A. P. Regmi, J. K. Ladha, Pathak, H. Pasuquin, C. Bueno, D. Dawe, P. R. Hobbs, D. Joshy, S. L. Maskey and S. P. Pandey, “Yield and Soil Fertility Trends in a 20-Year Rice-Rice-Wheat Experiment in Nepal,” Soil Science So- ciety of America Journal, Vol. 66, 2002, pp. 857-867. doi:10.2136/sssaj2002.0857 [8] V. H. D. Zuazo and C. R. R. Pleguezuelo, “Soil-Erosion and Runoff Prevention by Plant Covers, A Review,” Agronomy for Sustainable Development, Vol. 28, No. 1, 2008, pp. 65-86. [9] M. Aslam, A. Majid, N. I. Hashmi and P. R. Hobbs, “Im- proving Wheat Yield in the Rice-Wheat Cropping System of the Punjab through Zero Tillage,” Pakistan Journal of Agricultural Research, Vol. 14, No. 1, 1993, pp. 8-11. [10] B. T. Barnes and F. B. Ellis, “Effects of Different Meth- ods of Cultivation and Direct Drilling, and Dispersal of Straw Residues on Populations of Earthworms,” Journal of Soil Science, Vol. 30, 1979, pp. 669-679. doi:10.1111/j.1365-2389.1979.tb01016.x [11] R. S. Mehla, J. K. Verma, R. K. Gupta and P. R. Hobbs, “Stagnation in Productivity of Wheat in Indo-Gangetic Plains: Zero-Till-Seed-Cum-Fertilizer Drill as an Inte- grated Solution,” Rice-Wheat Consortium Paper Series 8, Rice-Wheat Consortium for the Indo-Gangetic Plains, New Delhi, 2000. [12] P. Smith, D. S. Powlson, M. J. Glendining and J. U. Smith, “Preliminary Estimates of the Potential for Carbon Mitigating in European Soils through No-Till Farming,” Global Change Biology, Vol. 4, No. 6, 1998, pp. 679-685. Copyright © 2012 SciRes. OJSS  Tillage and Rice-Wheat Cropping Sequence Influences on Some Soil Physical Properties and Wheat Yield under Water Deficit Conditions 81 [13] S. D. Verma, “Characterization and Genesis of Soils of Himachal Pradesh,” Ph.D. Thesis, Department of Soil Science, Himachal Pradesh Krishi Vishvavidyalaya, Palampur, H.P., India, 1979. [14] G. W. Gee and D. Or, “Particle-Size Analysis,” In: J. H. Dane and G. C. Topp, Eds., Methods of Soil Analysis, Part 4, Physical Methods, SSSA Book Series 5, SSSA, Madison, 2002, pp. 255-294. [15] A. Flint and L. E. Fli nt, “Partic le Density, ” In: J. H. Dane and G. C. Topp, Eds., Laboratory Methods of Soil Analy- sis, Part 4: Physical Methods, SSSA, Madison, 2002, pp. 229-240. [16] R. A. Singh, “Soil Physical Analysis,” Kalyani Publishers, New Delhi, 1980, p. 165. [17] W. D. Reynolds, D. E. Elrick, E. G. Youngs and A. Amoozegar, “Field Methods (Vadose and Saturated Zone Techniques),” In: J. H. Dane and G. C. Topp, Eds., Meth- ods of Soil Analysis, Part 4, Soil Science Society of America Book Series No. 5, Soil Science Society of America Madison, 2002, pp. 817-826. [18] W. H. Green and G. A. Ampt, “Studies on Soil Physics. Part I. The Flow of Air and Water through Soils,” Journal of Agricultural Research, Vol. 4, No. 1, 1911, pp. 1-24. [19] J. R. Philip, “The Theory of Infiltration: 4. Sorptivity and Algebraic Infiltration Equations,” Soil Science, Vol. 84, No. 3, 1957, pp. 257-264. doi:10.1097/00010694-195709000-00010 [20] B. Clothier, D. Scotter and J. P. Vandervaere, “Unsatu- rated Water Transmission Parameters Obtained from In- filtration,” In: J. H. Dane and G. C. Topp, Eds., Part 4, Methods of Soil Analysis, Soil Science Society of Amer- ica, Madison, 2002, pp. 879-898. [21] SAS Institute, “SAS User’s Guide,” Statistics, SAS Inst., Cary, 1999. [22] Y. Singh, A. K. Bhardwaj, P. K. Singh, A. Saxena, V. Singh, S. P. Singh and A. Kumar, “Effect of Rice Estab- lishment Methods, Tillage Practices in Wheat and Fertili- zation on Soil Physical Properties and Rice-Wheat Sys- tem Productivity on a Silty Clay Mollisol of Utranchal,” Indian Journal of Agricultural Science, Vol. 72, No. 4, 2002, pp. 200-205. [23] A. R. Barzegar, M. A. Asoodar, A. R. Eftekhar and S. J. Herbert, “Tillage Effects on Soil Physical Properties and Performance of Irrigated Wheat and Clover in Semi Arid Region,” Journal of Agronomy, Vol. 3, No. 4, 2004, pp. 237-242. doi:10.3923/ja.2004.237.242 [24] B. T. Barnes and F. B. Ellis, “Effects of Different Meth- ods of Cultivation and Direct Drilling, and Disposal of Straw Residues on Populations of Earthworms,” Journal of Soil Science, Vol. 30, 1979, pp. 669-679. [25] W. Ehlers, “Observations on Earthworm Channels and Infiltration on Tilled and Untilled Loess Soil,” Soil Sci- ence, Vol. 119, 1975, pp. 242-249. doi:10.1097/00010694-197503000-00010 [26] I. J. Packer, G. J. Hamilton and I. White, “Tillage Prac- tices to Conserve Soil and Improve Soil Conditions,” Soil Conservation Journal NSW (Aust), Vol. 40, 1984, pp. 78- 87. [27] P. W. Unger and P. K. Cassel, “Tillage Implement Dis- turbance Effects on Soil Properties Related to Soil and Water Conservation: A Literature Review,” Soil Tillage Research, Vol. 19, 1991, pp. 363-382. doi:10.1016/0167-1987(91)90113-C [28] R. J. Loch and K. J. Coughlan, “Effects of Zero Till and Stubble Retention or Some Properties of Cracking Clay,” Australian Journal of Soil Research, Vol. 22, 1984, pp. 91-98. doi:10.1071/SR9840091 [29] P. K. Sharma and S. K. De Datta, “Rainwater Utilization Efficiency in Rainfed Lowland Rice,” Advance in Agron- omy, Vol. 52, 1994, p. 101. doi:10.1016/S0065-2113(08)60622-7 Copyright © 2012 SciRes. OJSS |