Health
Vol.5 No.8(2013), Article ID:35565,7 pages DOI:10.4236/health.2013.58181
Effects of mammography positioning on the autonomic nervous function
![]()
Graduate School of Health Sciences, Niigata University, Niigata, Japan; *Corresponding Author: uchiyama@clg.niigata-u.ac.jp
Copyright © 2013 Mieko Uchiyama et al. This is an open access article distributed under the Creative Commons Attribution License, which permits unrestricted use, distribution, and reproduction in any medium, provided the original work is properly cited.
Received 1 June 2013; revised 1 July 2013; accepted 30 July 2013
Keywords: Mammography; Physical and Psychological Burden; Autonomic Nervous Function
ABSTRACT
The physical and psychological burden on patients during mammography was analyzed using the autonomic function index in 34 adult females. The indices included heart rate (HR), high frequency (HF) of the R-R interval on an electrocardiogram, and the ratio of HF to LF (low frequency) (LF/HF). HR is an indicator of the degree of mental and physical activity, HF indicates the parasympathetic index and LF/HF indicates the sympathetic index. For the mediolateral oblique (MLO) view in mammography, autonomic function indices were measured before and during mammography. Statistical analysis was performed by the Mann-Whitney U test and the significance level was set at 5%. The autonomic function indices were compared before and during mammography and all showed no significant differences. The average value before imaging and the reference value at rest were compared. The results showed that HR increased 1.3-fold, HF increased 0.4-fold, and LF/HF increased 3.2- fold over reference values. Chronological changes during mammography showed that HF increased and LF/HF decreased from 120 seconds after the start of imaging. From these observations, it is evident that the state before mammography is not the same as the resting state and that the sympathetic index is dominant before imaging. They also suggest that some aspects of the psychological burden experienced during mammography are not due to the pain of breast compression alone.
1. INTRODUCTION
Mammography is performed by pressing and stretching the breast using a thin radiolucent compression plate [1]. During mammography, the patient experiences a physical burden due to the positioning required, such as twisting the neck and raising the arm in addition to the breast compression. As a result, examinees are forced to endure pain caused by breast compression and immobilization. Additionally, in order to obtain the most suitable image for diagnosis, the radiological technologist may directly touch the breast and press it further to spread it if necessary. Breasts are closely related to sexuality for women. Such procedures weigh heavily on examinees in some cases, causing psychological pain in addition to the physical pain [2,3].
As for the physical and psychological burden experienced by the examinees at the time of mammography positioning, we have previously demonstrated empirically the relationship between muscle activity and pain based on the imaging method and the process of imaging [4-6]. Based on these results, we report that patients experience more than moderate pain from the start of positioning through the entire course of breast compression and immobilization and that pain also occurs at sites other than the breast.
We believe it is necessary to clarify empirically the psychological burden experienced by patients during mammography and thus to gain a valuable insight into the experience of pain and tension which will help with the development of a positioning technique that provides a “relaxed state”.
There have been previous reports of research in this field, studying chronic pain associated with skeletal muscle and autonomic nervous activities. As an index of autonomic nervous activity, pain and muscle tension were reported to be associated with sympathetic nerve activity [7-9]. Also, it has been reported that there is a positive correlation between postoperative pain and heart rate variability in the pain score and HF/LF ratio, which is indicative of sympathetic nerve activity [10]. Additional studies have reported physiological effects on autonomic nervous activity from massage and yoga [11,12].
However, previous studies only focused on pain caused by breast compression. The psychological burden beginning at the time of mammography positioning through the process leading to imaging has not been addressed adequately to date. Although it is difficult to objectively measure the psychological burden, we consider that assessing the autonomic nervous function using variations in the R-R interval of an electrocardiogram, which is an indicator of sympathetic and parasympathetic nerve activity, could lead to improved understanding of the creation of tension in the human body.
In this study, in order to clarify empirically the physical and psychological burden experienced by patients during mammography positioning, basic data from the parasympathetic and sympathetic nerves were collected and variation in the R-R interval of an electrocardiogram (ECG), which was one of the cardiovascular autonomic function tests and was analyzed using as a means of evaluating autonomic nervous function.
2. METHODS
2.1. Subjects
The subjects were 34 women without heart disease, hypertension or skin disease. Their age was 28.5 ± 9.2 years (mean ± standard deviation, SD), height was 160 ± 0.1 cm, body weight was 54.6 ± 6.3 kg and body mass index (BMI) was 20.2 ± 6.3. The compression pressure was 122.3 ± 10.5 N. The number of mammography experiences was 0 for 12 women, 1 for 16 women, and 2 or more for 6 women.
2.2. Measurement Methods
2.2.1. Measurement of Autonomic Function Indices
The autonomic function indices measured in this study were heart rate, high-frequency component of the ECG R-R interval and low-frequency (LF) component/highfrequency (HF) component ratio. Each index is described below.
The heart beat is regulated by two nodes within the heart itself (the sinoatrial node and the atrioventricular node). The initial electrical excitation occurs in the sinoatrial node, and is conducted to the atrioventricular node, then via the bundle of His to the Purkinje fibers (impulse conducting system) to generate a regular rhythm. By this mechanism, contraction is regulated and conducted from the atria to the ventricles. In addition, the heart rate is affected by nerves outside of the heart. The heart rate is increased by the center of the sympathetic nervous system of the medulla, while the parasympathetic nerve (vagus nerve) reduces the heart rate [13,14]. As an example, the heart rate can reach approximately 180 beats/min the instant before bungee jumping, demonstrating that it can be influenced by mental stress. Because of this, the heart rate has previously been used as basic data to gauge the activity of the mind and body and to evaluate the living and working environment [15].
Even though the heart rate appears to be a regular sinus rhythm, it is influenced by autonomic nervous activity related to respiration and circulation and it fluctuates periodically. This fluctuation is known as heart rate variability (HRV) [16]. HRV is the coefficient of variation of the interval between R wave peaks on an electrocardiogram. Since the 1980s, HRV has been divided into the frequency components of the cardiac sympathetic and parasympathetic functions by spectral analysis. There have been many reports in which this was measured in a clinical setting as time-series data over a long duration (usually 24 hours). For example, the relationship between the onset of myocardial infarction and autonomic nervous activity has been studied by analyzing data recorded over a 24-hour period. On the other hand, when autonomic nervous activity is to be assessed before and after drug administration, a short-term analysis may also be used for comparison. The Japan Society of Neurovegetative Research has specified the use of short-term analysis and long-term analysis as separate methods of testing cardiovascular autonomic function [17].
It is said that cardiac vagal activity, which is parasympathetic, is dominant at rest or a state close to it and that cardiac activity is suppressed due to excitement of the vagus nerve. Additionally, frequency analysis of HRV has shown that a power spectrum HF component of 0.16 - 0.42 Hz in the high-frequency range reflects vagus nerve activity. Based on these concepts, the HF component has been reported in many studies to represent an index of parasympathetic activity. On the other hand, the ratio of the power spectrum LF component of 0.04 - 0.15 Hz of the low-frequency range to the high-frequency component power or the ratio of LF to the power of the total frequency range has been reported to be associated with sympathetic activity [16].
2.2.2. Measurement Equipment and Methods
HRV is measured as time-series data. For this study, measurement and analysis of the short period up to and during mammography imaging were required. Therefore, Activetracer (GMS Co. AC-301A, medical device license number: 13BZ6133), which has the ability to analyze short-term data collected over 2 - 5 minutes, was used. This device is able to measure and record Heart rate (HR), HF and LF/HF at regular time intervals. To carry out measurements, the device was attached around the subject’s waist by a belt. Measurements were performed in a manner similar to a 3-lead ECG (Figure 1).
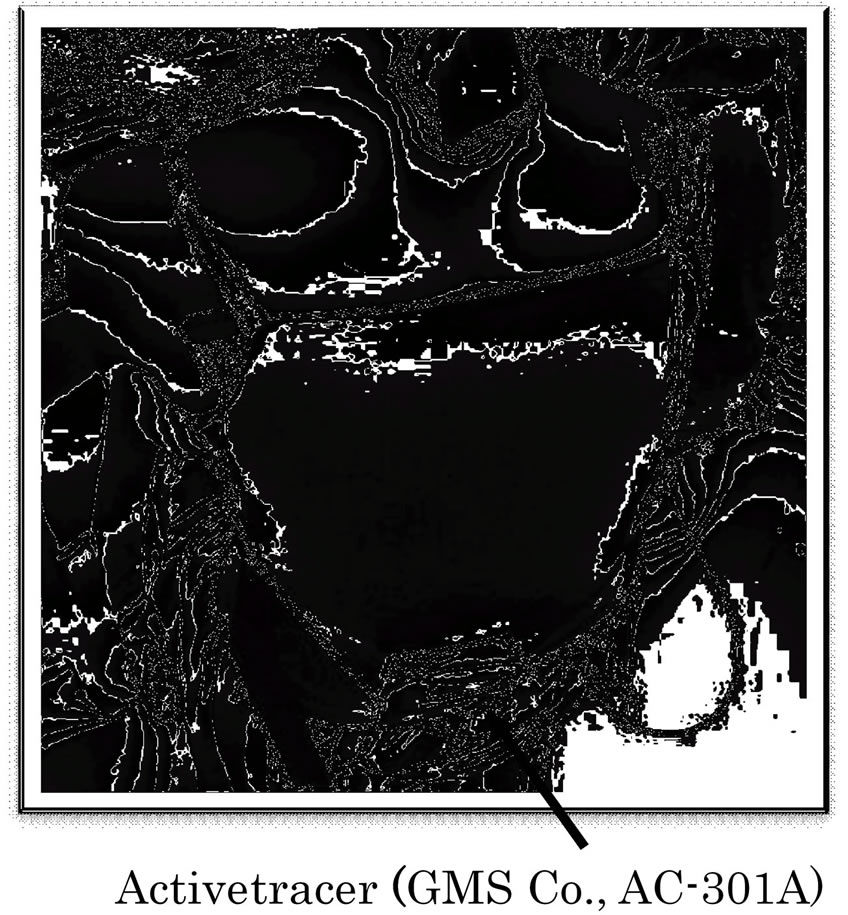
Figure 1. Actvivetracer for HRV measurement.
In this study, measurements were performed under conditions of mammography positioning. Therefore, the electrodes were attached to sites which would not interfere with breast compression during mammography but which allowed the ECG to be measured.
2.2.3. Analysis Methods
In this study, the R-R interval, which is the interval between R wave peaks on an ECG, was measured every 2 seconds and the HR, the HF component of HRV and the LF/HF ratio were analyzed. Data obtained were analyzed using the MemCalc/Tarawa heart rate variability real-time analysis program [GMS, Co., Tokyo].
LF and HF were calculated by determining the area under the power spectrum in the frequency range of interest. In other words, it was calculated by multiplying the sum of the power of the frequency range by the frequency division width. The standard unit of the ECG R-R interval is msec, which represent 1/1000 of 1 second. Therefore, the unit of both HF and LF is msec2.
Measurements were performed as described below. The Active tracer was attached and data were collected from the beginning of right mediolateral oblique (MLO) imaging to the end following a 10 minute seated rest period. Considering the stability of the data, for the data collected during resting, the 5 minutes beginning half way through the 10 minute rest period and ending just before imaging (“before imaging”) and between the start and end of right MLO imaging (“during imaging”) were analyzed. Experimental procedure is shown in Figure 2.
HR, HF and LF/HF values were obtained for each individual, all data were divided into “before imaging” and “during imaging” and the mean and standard deviation were calculated. The effects at rest and during imaging were analyzed.
As a reference value for each index, the standard value of HR at rest is 60 beats/min in adults [18]. As for HF
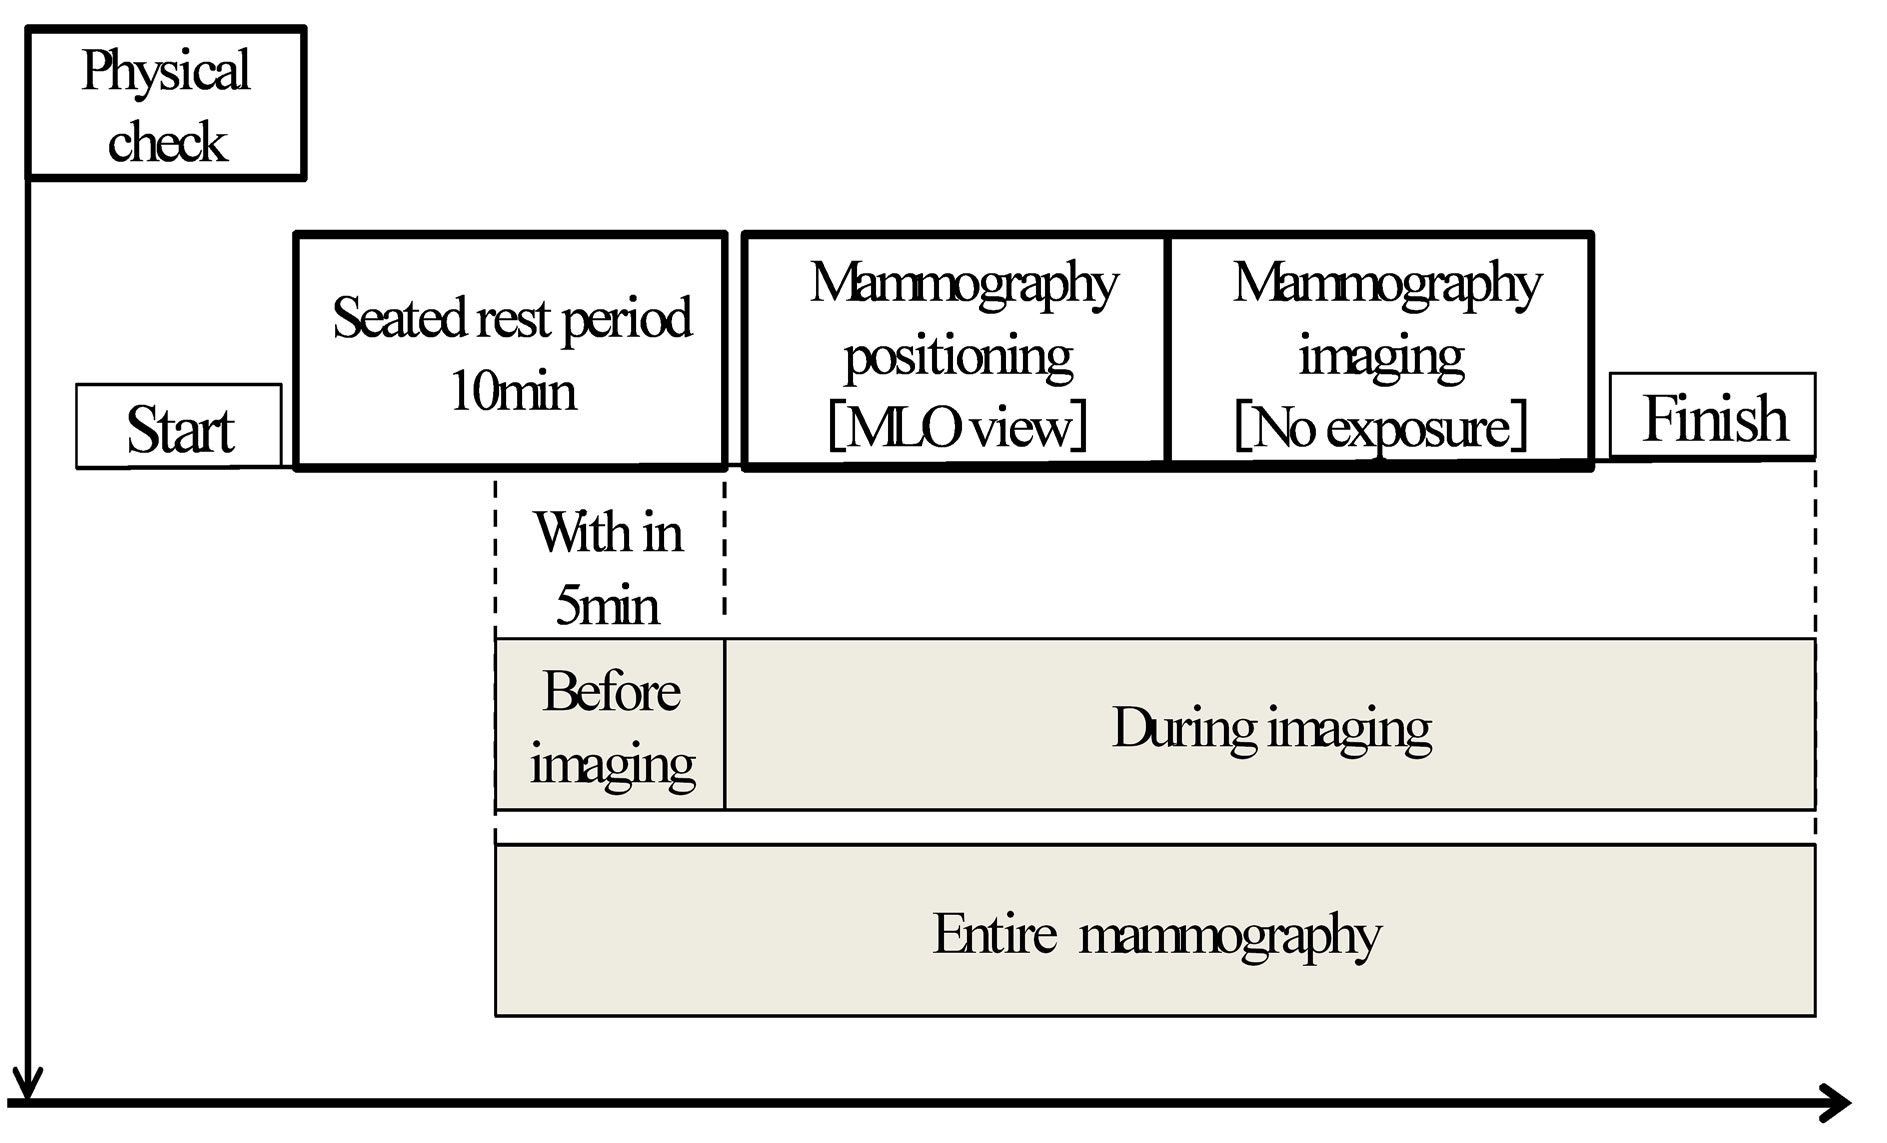
Figure 2. Experimental procedure for HRV measurement.
and LF/HF, the report on HRV standardization by the joint research group (task force) of the North American Society of Pacing and Electrophysiology and the European Society of Cardiology was adopted values for the short-term analysis of HRV at the Japan Society of Neurovegetative Research (HF: 975 (±203) msec2, LF/HF: 1.5 - 2.0) [19]. These were used as the reference values in this study.
Analysis was performed using the Mann-Whitney U test and the difference between values before and during imaging was compared. Statistical analyses were performed using SPSS 19J for Windows and the significance level was set at less than 0.05.
In order to observe the chronological changes during the course of mammography, HR, HF and LF/HF of the subjects were expressed by averaging the data over 30- second intervals.
2.3. Ethical Considerations
Prior to conducting this study, the research plan was submitted to and approved by the research ethics committee at Graduate school of Health Sciences, Niigata University (approval number 82).
3. RESULTS
3.1. Abbreviations and Acronyms
Table 1 summarizes the average values (±SD) of HR, HF and LF/HF of 34 subjects during the entire mammography procedure (including before and during imaging), as well as before imaging and during imaging.
HR was 81.12 (±12.03) beats/min. for the entire mammography procedure, 80.35 (±12.72) beats/min before imaging and 81.75 (±11.84) beats/min. during imaging. HF was 407.31 (±520.11) msec2 for the entire mammography procedure, 429.6 (±601.66) msec2 before imaging and 391.41 (±444.92) msec2 during imaging. LF/HF was 6.19 (±4.23) for the entire mammography procedure, 6.48 (±4.91) before imaging and 5.54 (±3.88) during imaging.
3.2. Comparison of the Average Values of HR, HF and LF/HF between Measurements before and during Imaging
The average values of HR, HF and LF/HF for the entire mammography procedure, before imaging and during imaging are shown in the figures (HR: Figure 3, HF: Figure 4, LF/HF: Figure 5). Comparison of average values before and during imaging showed no significant differences in HR, HF or LF/HF (HR: P = 0.640, HF: P = 0.767, LF/HF: P = 0.386).
Next, the “before imaging” data from this study were compared to reference values of HR, HF and LF/HF. The average value of HR before imaging was 1.3-fold higher than the reference value. The average value of HF, which is a parasympathetic index, before imaging was reduced to 0.4 times the reference value, while the average value of LF/HF, a sympathetic index, was increased 3.2-fold before imaging compared to the reference value.
3.3. Chronological Changes in HR, HF and LF/HF during Imaging
The average (±SD) duration of mammography imaging in this study was 170 (±35.0) seconds. With the start of imaging set at 0 seconds, measurements of HR, HF
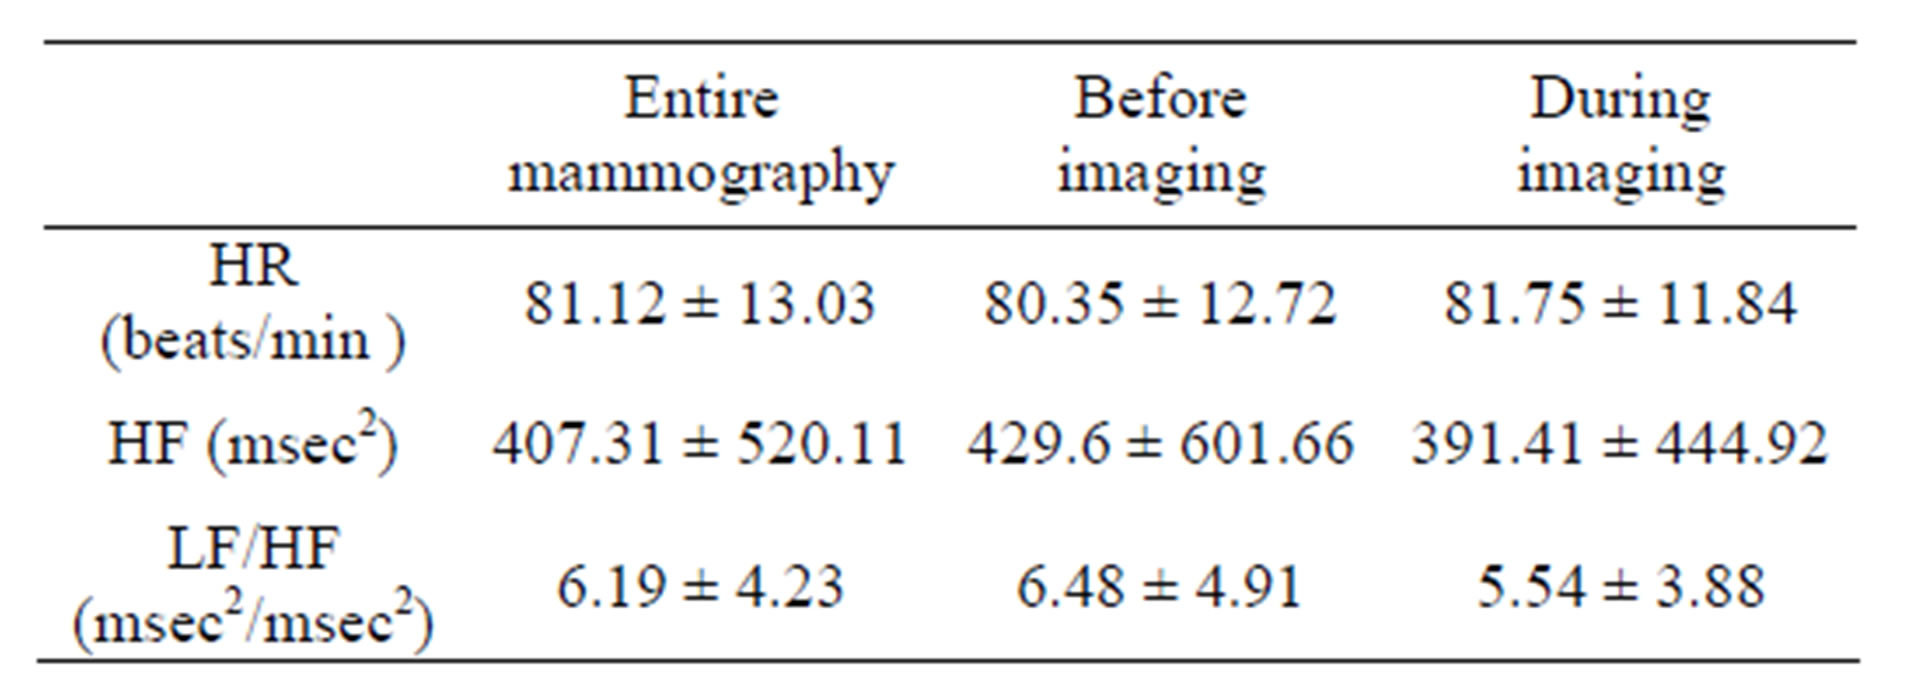
Table 1. Average values of HR, HF and LF/HF during mammography. N = 34 (Mean ± SD).
(HF: High frequency (0.16 - 0.42 Hz) component, LF/HF: Ratio of high frequency to low frequency (0.04 - 0.15 Hz) components, HR: Heart rate).
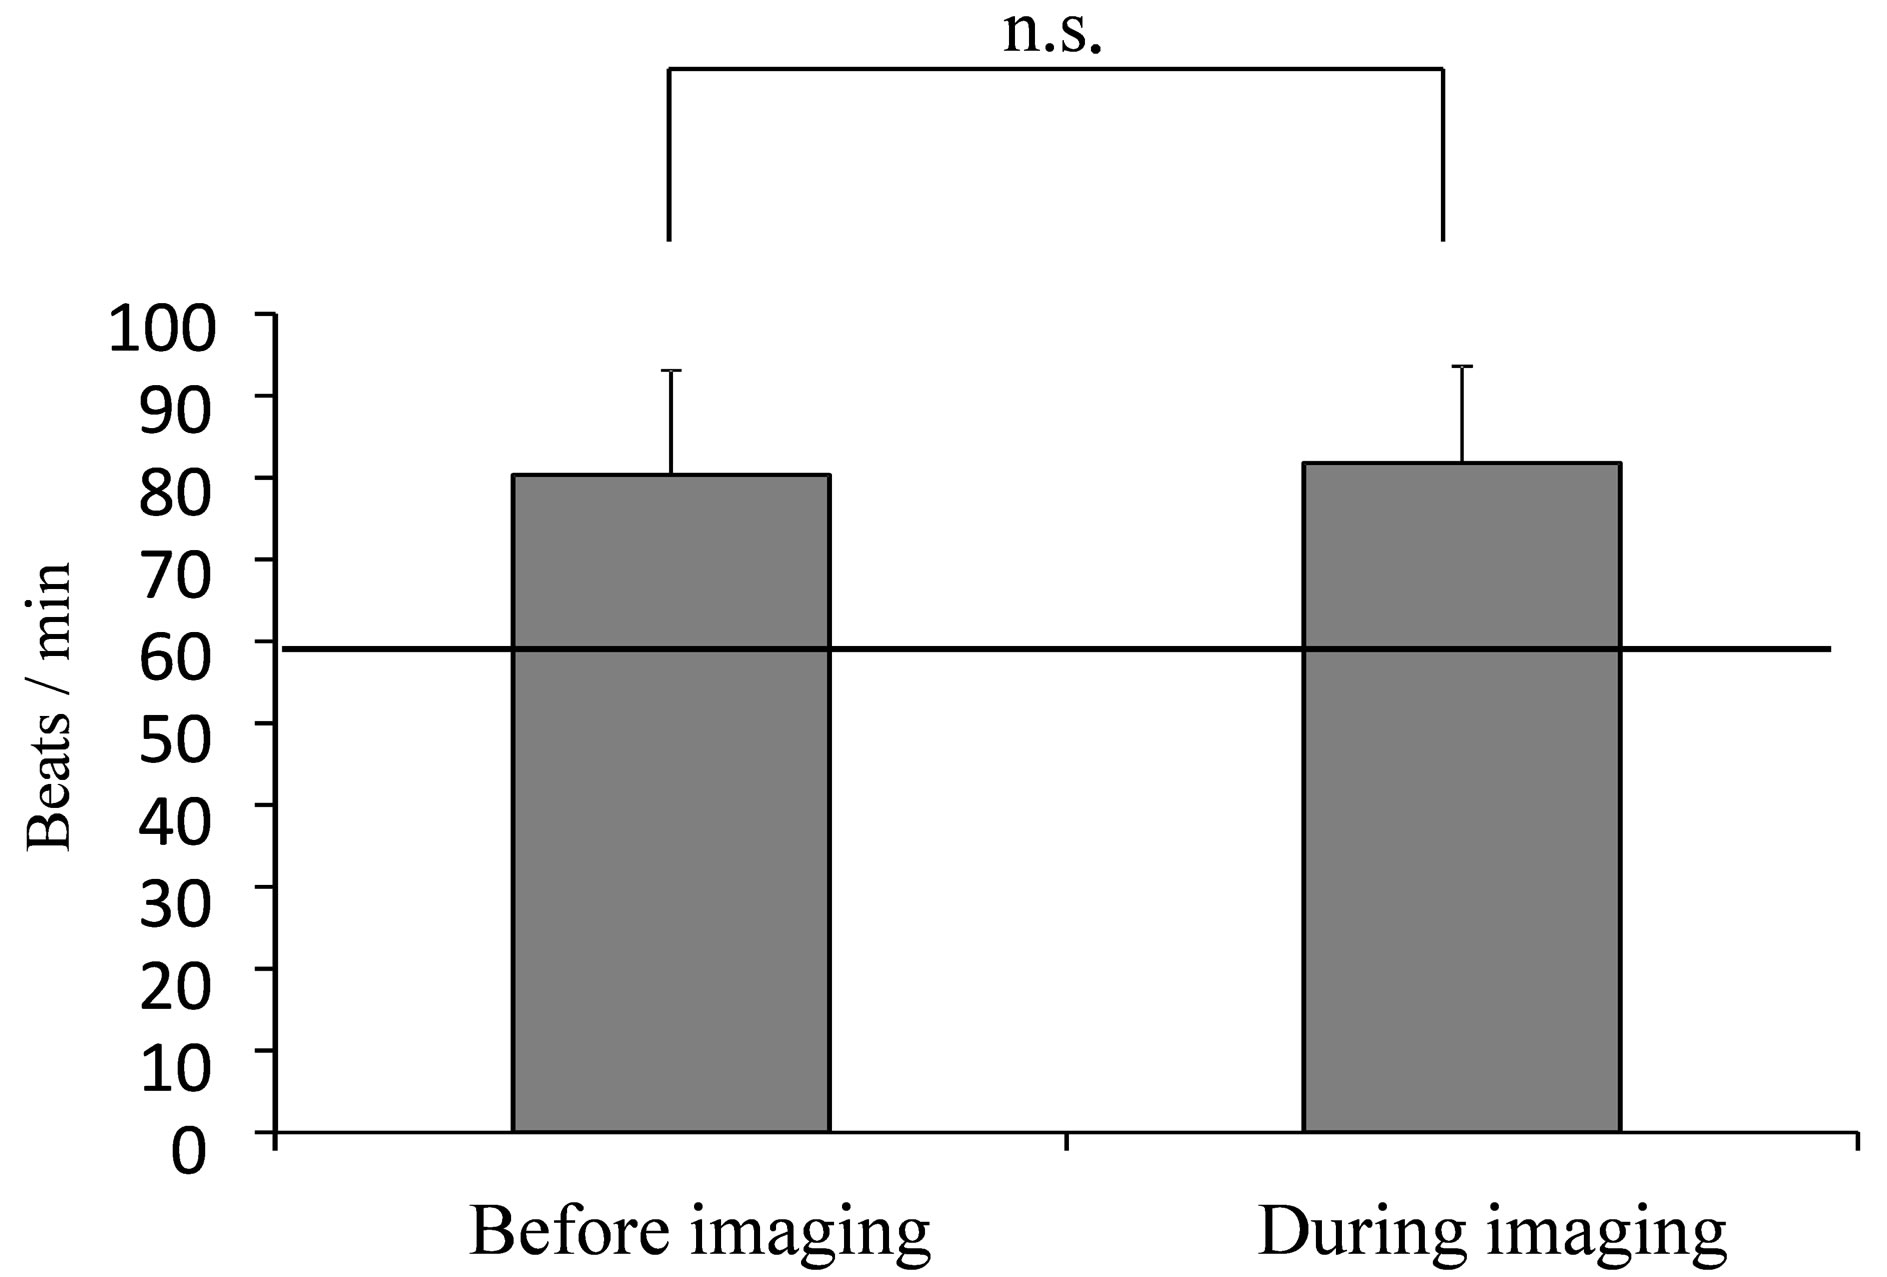
Figure 3. Average value of HR during mammography. (The line indicates the resting reference value at 60 beats/min [18] Mann-Whitney U test: n.s.).
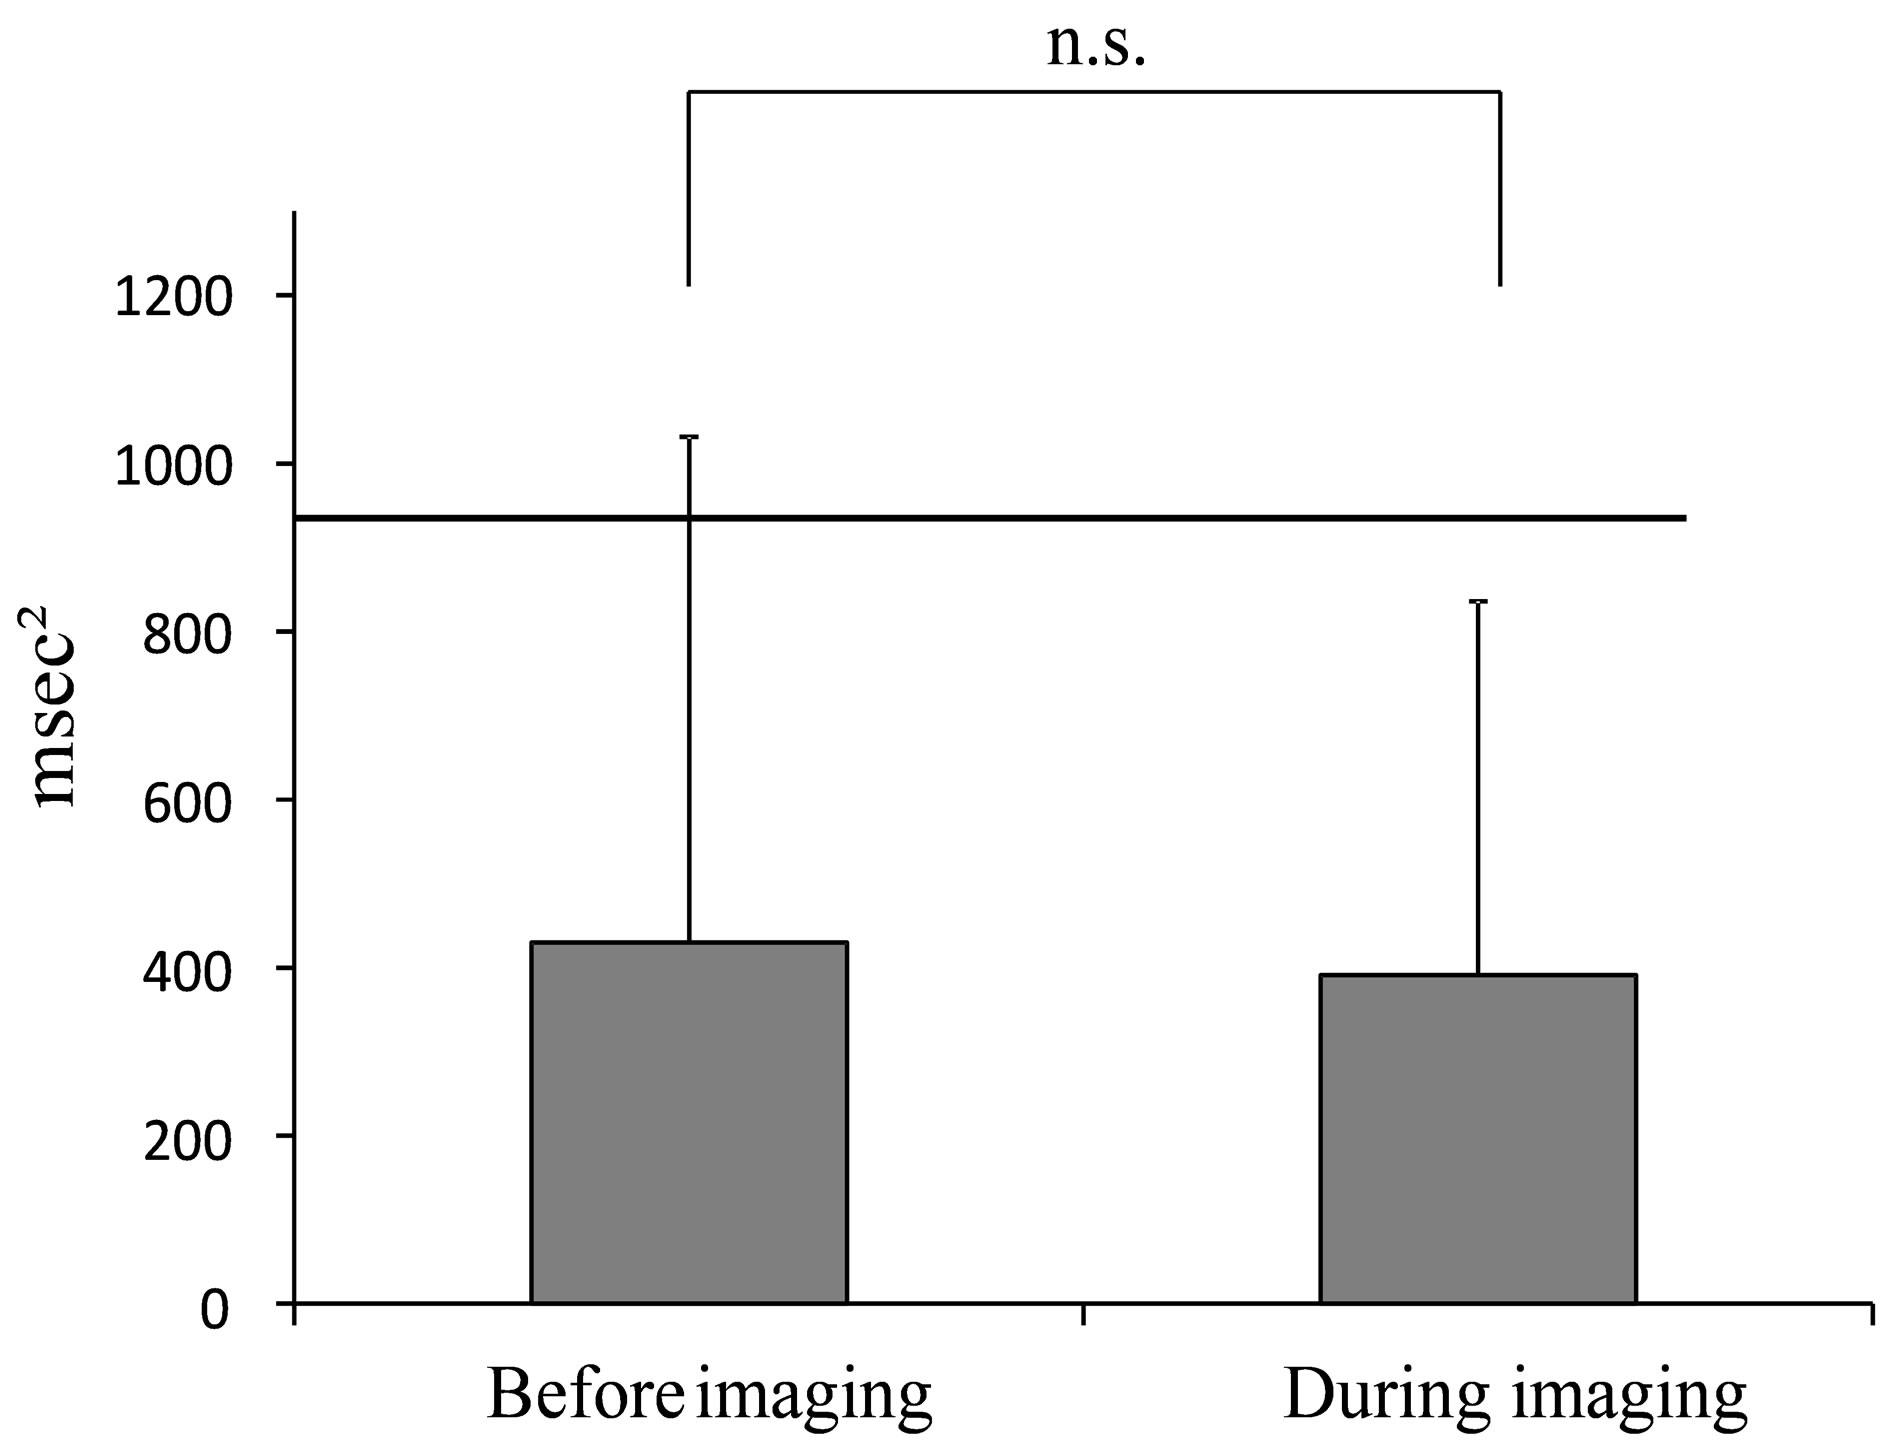
Figure 4. Average value of HF during mammography. (The line indicates the reported HRV standardization of the reference value of 975 msec2 (Task force) at rest in the supine position [19].).
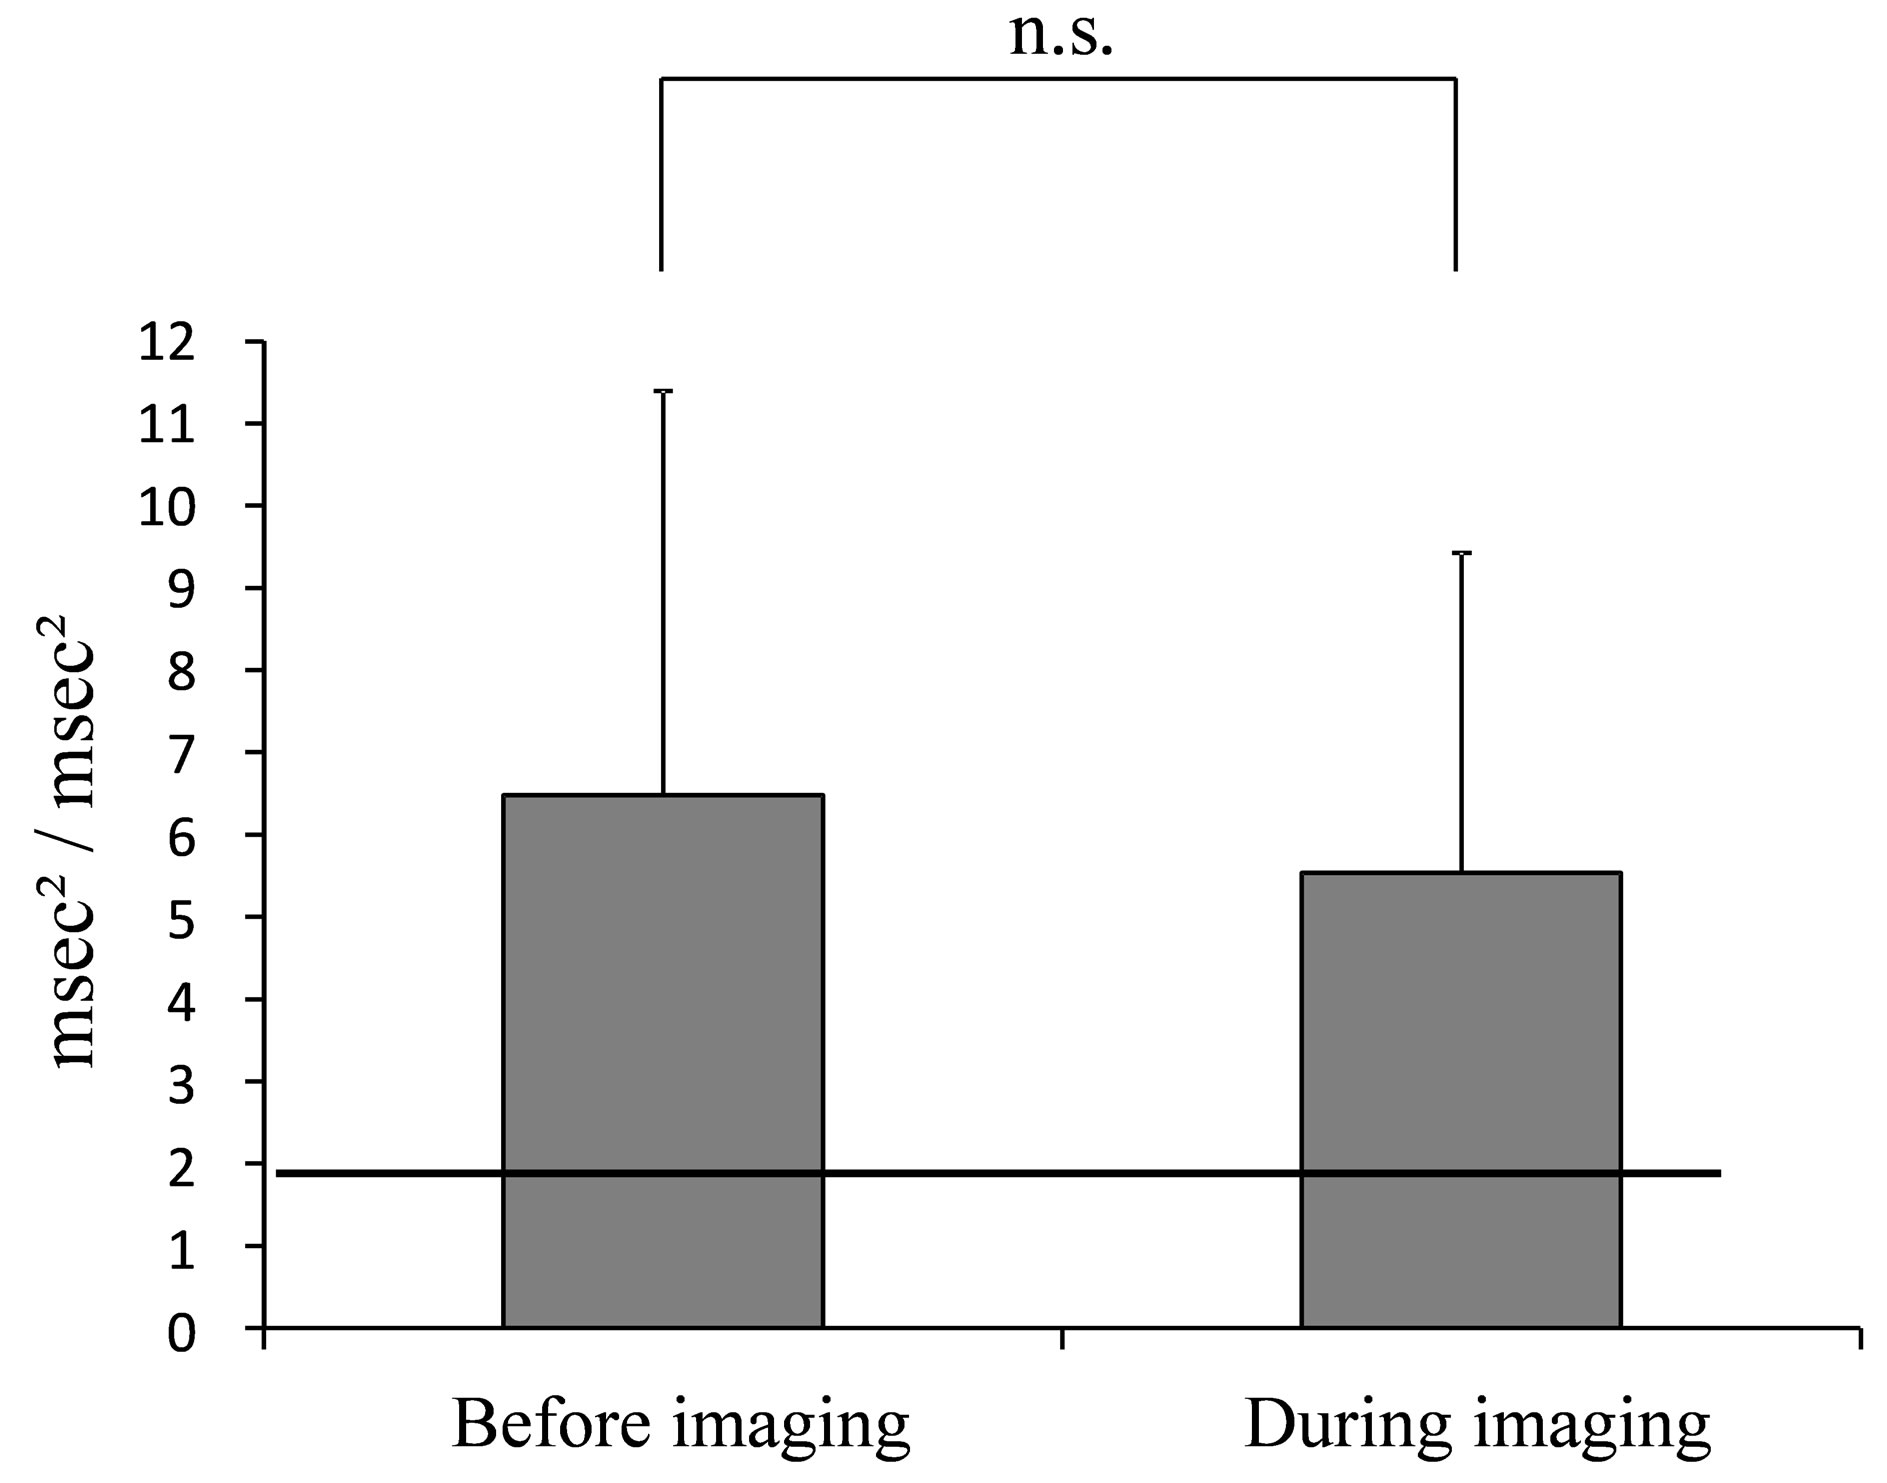
Figure 5. Average value of LF/HF during mammography. (The line indicates the reported HRV standardization of the reference value of 2.0 msec2/msec2 (Task force) at rest in the supine position [19].).
and LF/HF were obtained every 30 seconds up to 180 seconds.
The average (±SD) of HR was 88.66 (±4.58) beats/min between 0 - 30 seconds, 82.41 (±2.85) beats/min between 31 - 60 seconds, 82.21 (±3.47) beats/min between 61 - 90 seconds, 82.67 (±4.31) beats/min between 91 - 120 seconds, 78.49 (±3.13) beats/min between 121 - 150 seconds and 70.84 (±1.68) beats/min between 151 - 180 seconds. As shown in Figure 6, the chronological values of HR were consistently more than 80 beats/min up to 120 seconds, showing a tendency to decrease slightly at the end of the mammography imaging.
HF was 305.04 (±51.92) msec2 between 0 - 30 seconds, 256.16 (±42.19) msec2 between 31 - 60 seconds, 234.75 (±43.58) msec2 between 61 - 90 seconds, 408.62 (±69.94)
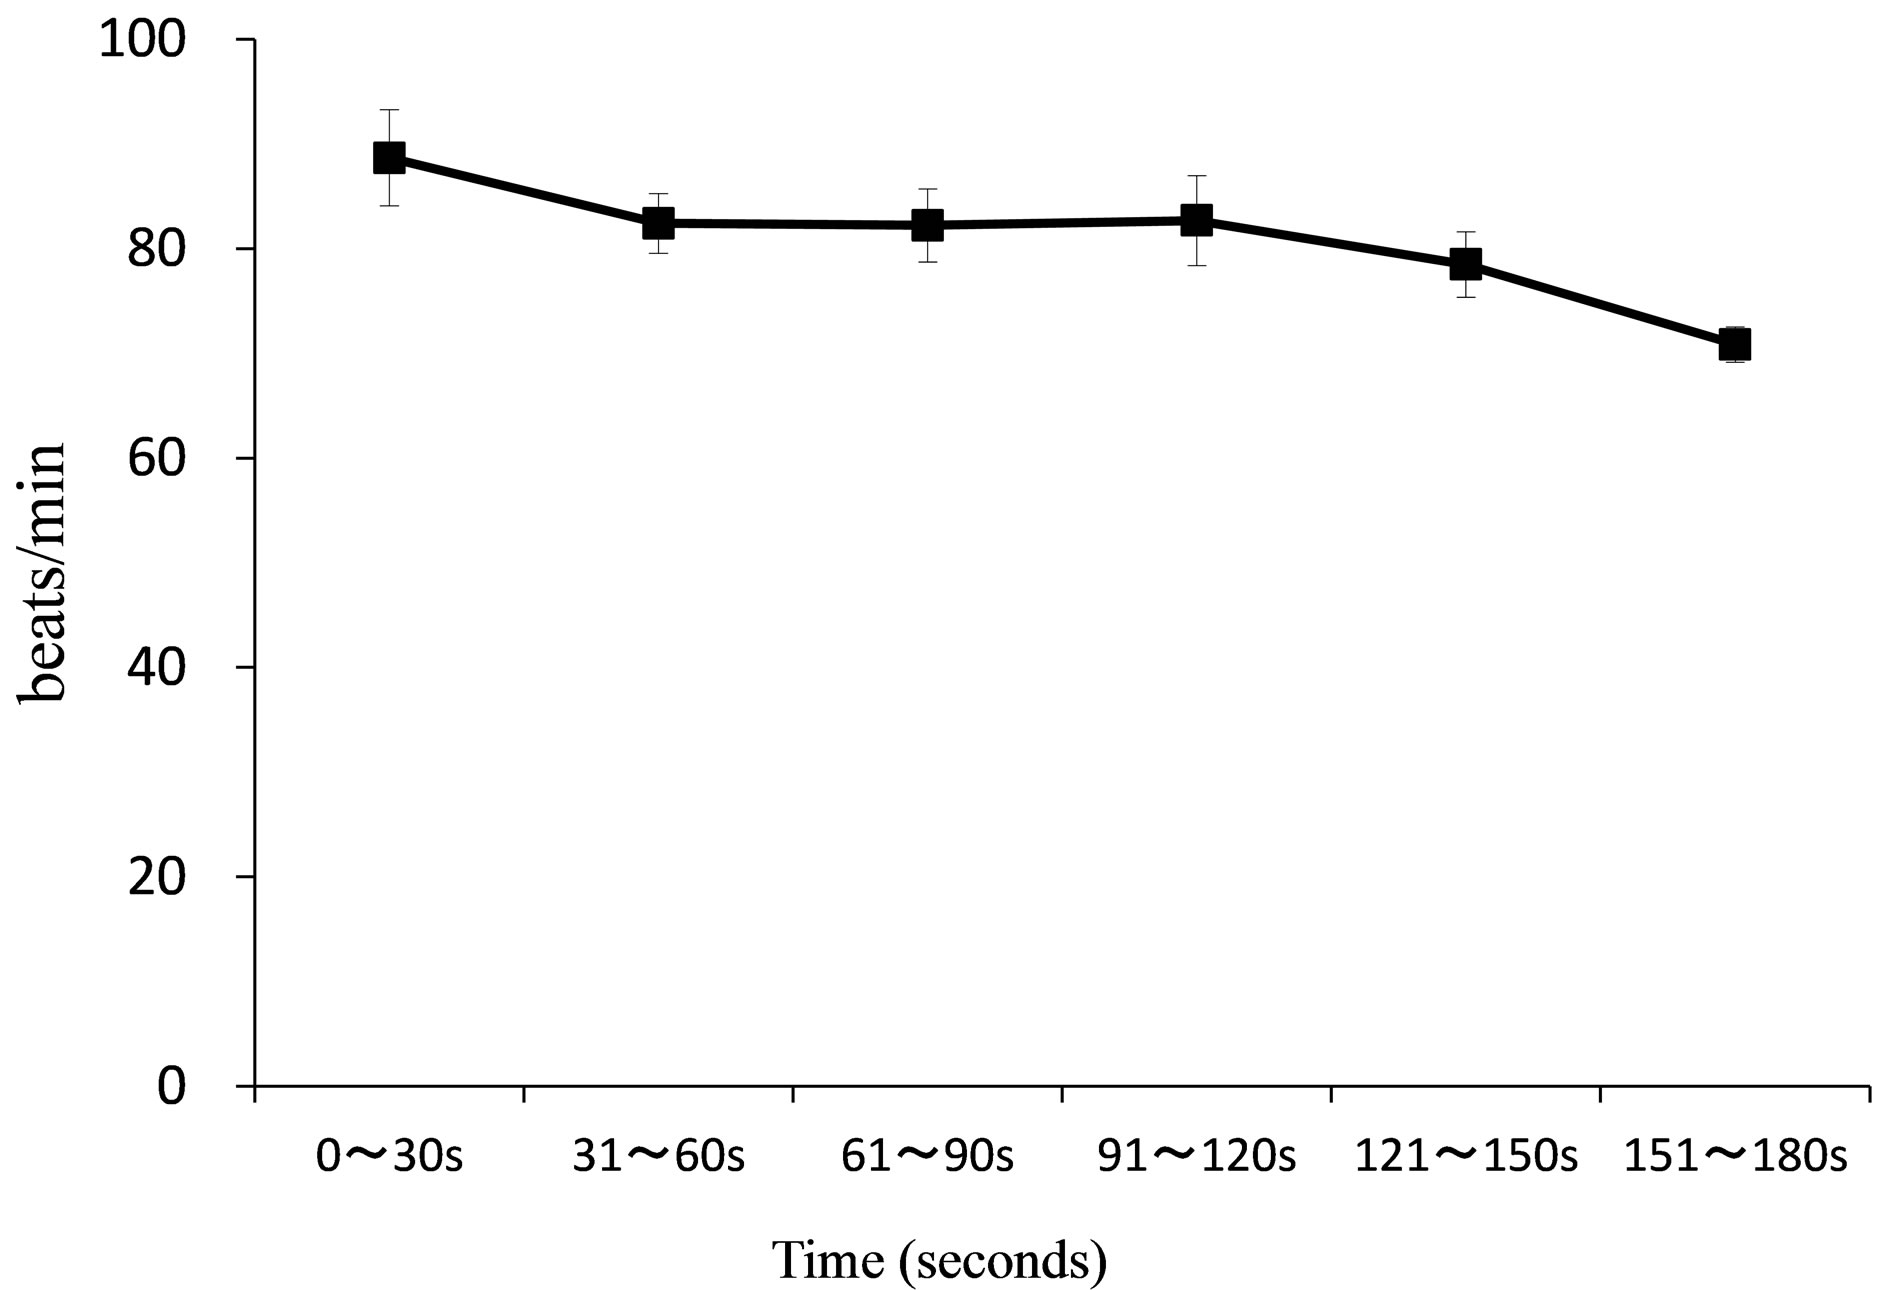
Figure 6. Chronological changes in HR during mammography. (SD values are shown in the vertical direction around the mean. 0 ~ 30 s indicates 0 ~ 30 seconds, 31 ~ 60 indicates 31 ~ 60 seconds, 61 ~ 90 s indicates 61 ~ 90 seconds, 91 ~ 120 s indicates 91 ~ 120 seconds, 121 ~ 150 s indicates 121 ~ 150 seconds, 151 ~ 180 s indicates 151 ~ 180 seconds.).
msec2 between 91 - 120 seconds, 492.15 (±113.58) msec2 between 121 - 150 seconds and 501.78 (±118.53) msec2 between 151 - 180 seconds. LF/HF was 7.10 (±1.35) msec2/msec2 between 0 - 30 seconds, 7.10 (±1.87) msec2/msec2 between 31 - 60 seconds, 5.62 (±1.68) msec2/msec2 between 61 - 90 seconds, 3.61 (±0.74) msec2/msec2 between 91 - 120 seconds, 3.85 (±0.86) msec2/msec2 between 121 - 150 seconds and 3.86 (±1.08) msec2/msec2 between 151 - 180 seconds. As shown in Figure 7, chronological changes of HF tended to increase and LF/HF tended to decrease from 91 - 120 secafter the start of imaging. Usually, most of the time required for mammography is the time required for positioning. Therefore, 91 - 120 seconds after the start of imaging is in the middle of positioning and a situation in which the breast is compressed. In that situation, we show that the parasympathetic index increases and the sympathetic index decreases.
4. DISCUSSION
The comparison of values obtained before and during imaging showed no significant differences in HR, HF or LF/HF in this study. However, when our data were compared with the generally used reference values, values of HR, HF and LF/HF before imaging were all found to be significantly different from the reference values at rest. In other words, even at rest before imaging, HF, which reflected parasympathetic activity, was lower than the reference value and LF/HF, which reflected sympathetic activity, was higher than the reference value. Regarding the autonomic nervous function in the body, it has been said that “when mental or physical stimulation (stressor) is applied to where homeostasis of the body is maintained, a warp (strain) is caused to the body and the
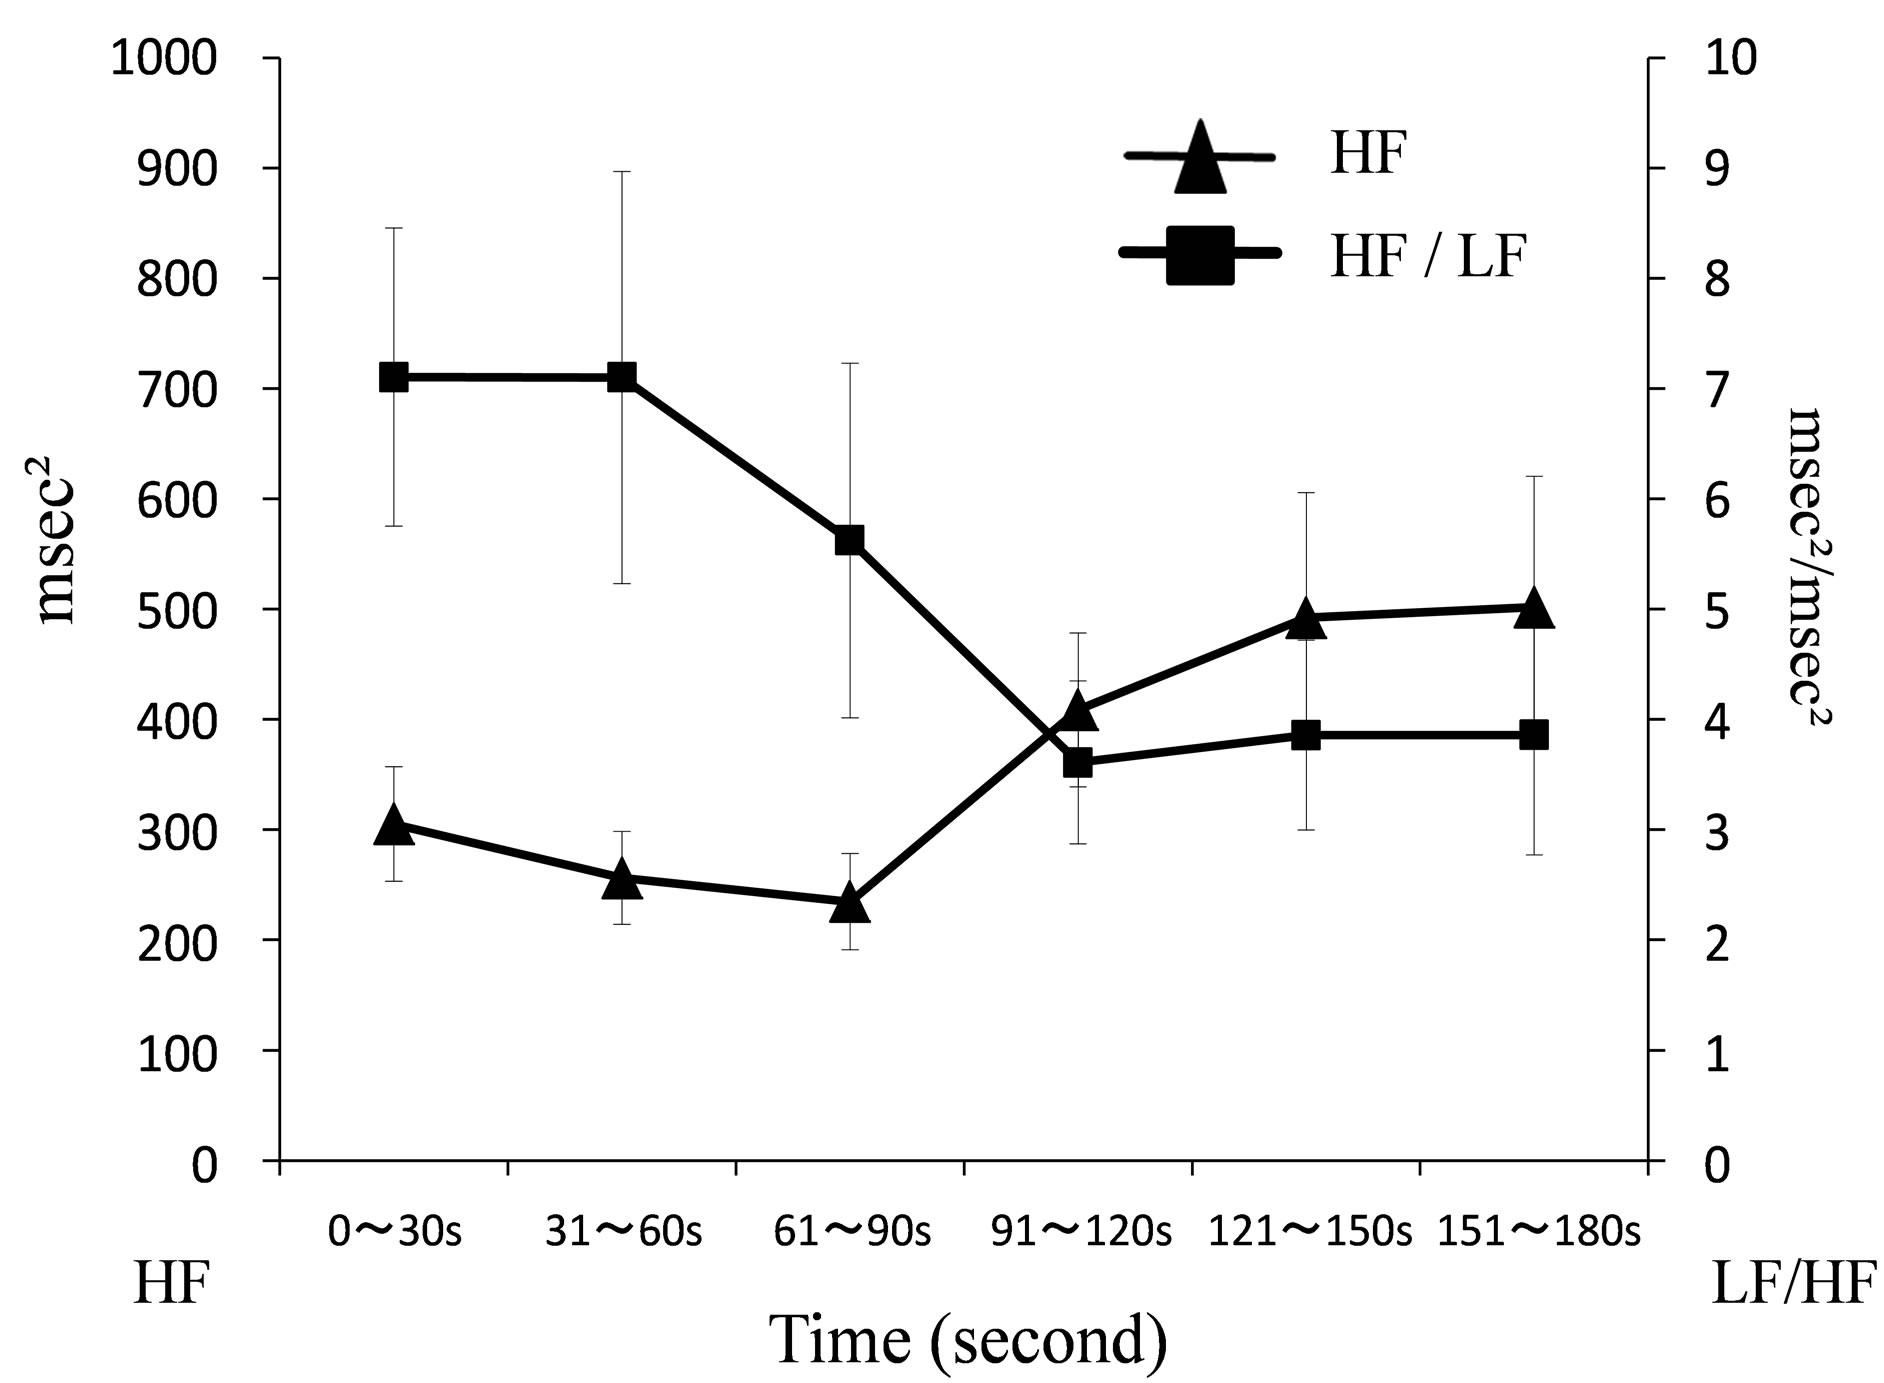
Figure 7. Chronological changes of HF and LF/HF during mammography.
body exhibits coping (stress) to correct the warp. The autonomic nervous system is involved in doing this, adaptive hormone is secreted and required energy is supplied to return to its original state” [20]. There is a possibility that psychological reaction, such as undergoing unfamiliar mammography and the expectation that it may be painful, may result in a situation in which sympathetic activity dominates.
From the results of the chronological changes, it was apparent that LF/HF, which reflected sympathetic activity, was increased before imaging compared to during imaging. HF, which reflected parasympathetic activity, showed the opposite trend. The autonomic nervous response to stress has been understood to involve stimulation of sympathetic activity and regression of parasympathetic activity. During mammography, since it is accompanied by pain and tension due to breast compression and immobilization, the state of tension is expected to increase with the physical burden. However, the data obtained in this study showed that HF, which reflected parasympathetic activity, showed a tendency to increase gradually starting before imaging.
At 91 - 120 seconds from the start of the imaging procedure, when a tendency towards an increase in HF and a decrease in LF/HF was observed, it coincided with the process of positioning and breast compression. During positioning, the examinees must sit close to the radiological technologist and the examinee must hold her body steady while the breast is compressed. In addition, it is a situation in which the pain intensifies. Under such circumstances, the sympathetic index decreases during imaging rather than at the start of imaging while the parasympathetic index begins to increase. In the course of mammography imaging, the time period of 91 - 120 seconds from the start of imaging is in the second half of the imaging procedure, close to the end of the imaging session. One possible reason for the observation in this study was that there was a trend during this time period for an increase in HF and decrease in LF/HF. The following point may be considered. Even in a situation in which there is a physical and psychological burden, there may be other associated psychological reactions, such as a sense of relief that the imaging is nearing an end.
These observations suggest that sympathetic nervous activity, which reflects tension, does not necessarily become dominant at the time-point associated with peak pain during mammography. In addition, it suggests that sympathetic nervous activity, which reflects tension, dominates when the examinee does not understand the situation and the reality of mammography. Therefore, we suggest that there is a need for data analysis on the physical and psychological burden during mammography to be carried out from the stage of preparation before positioning.
5. ACKNOWLEDGEMENTS
This work was supported by JSPS KAKENHI Grant Number 23593285.
REFERENCES
- Henrich, R.E., Baett, L., Botsco, M.A., Deibei, D., Feig, S. and Gray, J. (1999) Mammography quality control manual: Patient positioning and compression. American College of Radiology, 30-75.
- Montgomery, M. and McCrone, S.H. (2010) Psychological distress associated with the diagnostic phase for suspected breast cancer: Systematic review. Journal of Advanced Nursing, 9, 2372-2390. doi:10.1111/j.1365-2648.2010.05439.x
- Whelehan, P., Evans, A., Wells, M. and Macgillivray, S. (2013) The effect of mammography pain on repeat participation in breast cancer screening: A systematic review. The Breast, 28, 1-6.
- Uchiyama, M., Lee, Y., Kazama, K., Minagawa, Y., Tsai, D.Y., Sadakata, M. and Sayama, M. (2011) A preliminary study on measurement of muscle activity during mammography positioning. Japanese Journal of Radiological Technology, 67, 679-682. doi:10.6009/jjrt.67.679
- Uchiyama, M., Lee, Y., Sadakata, M., Sayama, M. and Tsai, D.Y. (2012) Measurement of muscle activities for evaluating physical burden and pain during mammography positioning. The Tohoku Journal of Experimental Medicine, 228, 53-58. doi:10.1620/tjem.228.53
- Uchiyama, M., Lee, Y., Kazama, K., Minagawa, Y., Tsai, D.Y., Sadakata, M. and Sayama, M. (2012) Quantitative assessment of muscle activity in mammography positioning. Proceedings of the XX IMEKO World Congress, Busan, 9-14 September 2012, 1-4.
- Shiro, Y., Arai, Y.C.P., Matsubara, T., Isogai, S. and Ushida, T. (2012) Effect of muscle load tasks with maximal isometric contractions on oxygenation of the trapezius muscle and sympathetic nervous activity in females with chronic neck and shoulder pain. Bio Medical Central Musculoskeletal Disorders, 13, 1-7.
- Mostoufi, S.M., Afari, N., Ahumada, S.M., Reis, V. and Wetherell, J.L. (2012) Health and distress predictors of heart rate variability in fibromyalgia and other forms of chronic pain. Journal of Psychosomatic Research, 72, 39- 44. doi: 10.1016/j.jpsychores.
- Hallman, D.M. and Lyskov, E. (2012) Autonomic regulation, physical activity and perceived stress in subjects with musculoskeletal pain: 24-hour ambulatory monitoring. International Journal of Psychophysiology, 86, 276- 282. doi:10.1016/j.ijpsycho.
- Chang, L.H., Ma, T.C., Tsay, S.L. and Jong, G.P. (2012) Relationships between pain intensity and heart rate variability in patients after abdominal surgery: A pilot study. Chinese Medical Journal, 125, 1964-1969.
- Streeter, C.C., Gerbarg, P.L., Saper, R.B., Ciraulo, D.A. and Brown, R.P. (2012) Effects of yoga on the autonomic nervous system, gamma-aminobutyric-acid, and allostasis in epilepsy, depression, and post-traumatic stress disorder. Medical Hypotheses, 78, 571-579.doi: 10.1016/j.mehy.
- Hatayama, T., Kitamura, S., Tamura, C., Nagano, M. and Ohnuki, K. (2008) The facial massage reduced anxiety and negative mood status, and increased sympathetic nervous activity. Biomedical Research, 29, 317-320. doi:10.2220/biomedres.29.317
- Berger, R.D., Saul, J.P. and Cohen, R.J. (1989) Transfer function analysis of autonomic regulation. I. Canine atrial rate response. The American Journal of Physiology, 256, 142-152.
- Berntson, G.G., Cacioppo, J.T. and Quigley, K.S. (1993) Respiratory sinus arrhythmia: Autonomic origins, physiological mechanisms, and psychophysiological implications. Psychophysiology, 30, 183-196. doi:10.1111/j.1469-8986.1993.tb01731.x
- Ajioka, M., Sugiyama, S., Ogawa, K., Satake, T. and Ozawa, T. (1986) Mechanism of cardiac arrhythmias induced by epinephrine in dogs with hypokalemia. American College of Cardiology Foundation, 8, 1373-1379. doi:10.1016/S0735-1097(86)80310-2
- Pomeranz, B., Macaulay, R.J., Caudill, M.A., Kutz, I., Adam, D., Gordon, D., Kilborn, K.M., Barger, A.C., Shannon, D.C., Cohen, R.J. and Benson, H. (2012) Assessment of autonomic function in humans by heart rate spectral analysis. American Journal of Physiology, 248, 151-158.
- Hayano, J., Taylor, J.A., Yamada, A., Mukai, S., Hori, R., Asakawa, T., Yokoyama, K., Watanabe, Y., Takata, K. and Fujinami, T. (1993) Continuous assessment of hemodynamic control by complex demodulation of cardiovascular variability. American Journal of Physiology, 264, 1229- 1238.
- Mason, J.W., Ramseth, D.J., Chanter, D.O., Moon, T.E., Goodman, D.B. and Mendzelevski, B. (2007) Electrocardiographic reference ranges derived from 79,743 ambulatory subjects. Journal of Electrocardiology, 40, 228-234. doi:10.1016/j.jelectrocard.2006.09.003
- Task Force of the European Society of Cardiology and the North American Society of Pacing and Electrophysiology (1996) Heart rate variability: Standards of measurement, physiologic interpretation and clinical use. Circulation, 93, 1043-1065. doi:10.1161/01.CIR.93.5.1043
- Gregg, D.J. (2001) The physiology of mind-body interactions: The stress response and the relaxation response. The Journal of Alternative and Complementary Medicine, 7, 83-92. doi:10.1089/107555301753393841