Health
Vol.5 No.3(2013), Article ID:29278,10 pages DOI:10.4236/health.2013.53067
Eating habits and lifestyle in a group Turkish primary education children
![]()
1Diet Department, Osmangazi University, Eskisehir, Turkey; nazanson@ogu.edu.tr
2Medico-Social Center, Osmangazi University, Eskisehir, Turkey; *Corresponding Author: ayranciunal@yahoo.com
3 Clinics of Endocrinology and Metabolism, Eskisehir Private Sakarya Hospital, Eskisehir, Turkey; osmanson@mynet.com
Received 31 October 2012; revised 1 December 2012; accepted 6 January 2013
Keywords: Eating Habits; Lifestyle; Obesity; Gender; Primary Education Children; Turkey
ABSTRACT
Background: The prevalence of child obesity is increasing rapidly worldwide as well as Turkey due to skipped main meals and increased snacking. The objectives were to study the prevalence rates of overweight and obesity in a group of Turkish children, and to analyze the relationship between eating habits and lifestyle and obesity. Methods: The study was carried out in 6 schools in urban regions in the city of Eskisehir, Western Turkey between February and May 2008. A total of 1421 students aged 7 - 14 years (708 boys and 713 girls) were examined. Eating habits and lifestyle were obtained by evaluation of a standard set of 15 questions prepared using the literature. Results: Most obese students reported having a snack in the afternoon, not spending at least five hours of leisure time per week in physical activities, being high income level, that their mother’ education level was university, eating less fruits, eating less vegetables, having more dessert after any meal, eating more potato chips, watching television more, living a physically active life less, less breast feeding, that their father consumed alcohol, that their father was overweight/ obese, their mother wase overweight/obese (statistically important relationships for each one). Conclusions: A small portion of 7 - 14-year-old Turkish children are at increased health risk owing to overweight and obesity in an urban population in a developing country.
1. BACKGROUND
In the past few decades a great deal of attention has been focused on the relationships between body weight, lifestyle, eating habits and behaviors. The prevalence of obesity has increased worldwide and it is common held that understanding the correlations between food intake, lifestyle and overweight could lead to improvement in preventing weight gain or in treating obesity [1].
The prevalence of child obesity is increasing rapidly worldwide [2]. This phenomenon is often reflected in skipped main meals and increased snacking. These changing food-related behaviors may cause concern for health if the foods usually consumed during meals are different from those consumed during snacks, so that unhealthy changes in food quality and quantity, daily energy and nutrient intake might occur [3]. In the past few decades there have been increases in the consumption of fast foods, pre-prepared meals, soft drinks, and candy [4]. At the same time, physical activity patterns have changed as a result of an increase in time spent watching television, the advent of video games and the internet, and a decrease in the opportunities for physical activity in schools and communities [5]. Put it differently, exogenous obesity is due to an increase in food intake, a decrease in total or resting expenditure, or some combination maintained over time [6,7].
Within a population, different factors have been shown to influence eating and health behavior: for instance age, gender, body weight, dieting, eating, drinking, parents’ education status, socio cultural and economic level [8]. According to traditions, cultures, and countries, people have different beliefs about the role of food as a means of protecting or promoting health [9].
Overweight in children is an antecedent of adult obesity. The increase in body mass index (BMI) in children and adolescents is associated with a higher risk of chronic-transmissible illnesses in adulthood. Therefore, the need to estimate overweight in children has been recognized as a step towards identifying high risk groups and to evolve preventive strategies for diseases associated with overweight or obesity by many countries [10-12]. BMI is a good indicator of nutritional status, especially for field evaluations, because up to 90% of its variations are due to corporal fat. It is relatively consant in adults but changes with age in children [13].
The growth of children, namely BMI, is genetically determined and is fully expressed if the environmental conditions are adequate and provide all the necessary nutrients [14,15]. Racial and ethnic differences in BMI values in childhood and adolescence have also been reported [16].
In recent years, Turkey has undergone characteristic improvements in its epidemiologic profile due to the facts that a significant decrease in infant mortality rate, a decline in undernutrition, and a sustained economic development that has increased food availability, changes in nutritional trends, and amount of physical activity in the population. The social, economic, cultural intervenetions by the Turkish governments during the last 40 years had important consequences on the nutritional status of the population or children.
Relationships between lifestyle and eating habits, and obesity can work together, the connections between them can confound and do not necessarily remain constant over longer periods of time, and it is important to repeatedly monitor these associations.
The major objectives of this investigation were to study the prevalence rates of overweight and obesity in a group of Turkish children, to analyze the relationship between eating habits and lifestyle and obesity, to examine how certain food habits, lifestyle were related to gender and to provide some helpful suggestions for lifestyle and eating changes.
2. METHODS
The study was carried out between February and May 2008. A total sample of 6 schools was selected by random sampling method from about 100 primary education schools situated in urban regions in the city of Eskisehir, Western Turkey. Within each region, schools were selected to represent distributions of schools by size, location, and student population. The schools were selected from different zones in the city to get an equal distribution of children. School authorities were requested to provide a list of children attending first to eight standards. We aimed to screed 750 boys and 750 girls between 7 and 14 years with an equal distribution. When selected the study schools, private and special needs schools were excluded. Also, subjects were randomly selected among pupils in those primary education schools. Some questionnaires which were missing were excluded (n = 23). Of the total populations of these schools, a total of 1421 students aged 7 - 14 years (708 boys and 713 girls) were examined. The questionnaire was proposed to random classes of the children from the pool available, after the end of a short lecture. Participation was not compulsory. Between 95% - 98% of the children in a class volunteered to complete the survey, which took between 10 - 20 minutes. The questionnaires were completed by children and their parents in which sociodemographic characteristics of children and their parents, the children’s eating habits and life styles were recorded. 1421 questionnaires were completed by all the children under the children’s parents’ supervision. The children were advised to take home the questionnaire to their parents to fill in the details regarding the some parameters which they do not know or understand. The questionnaires were delivered to the children’s parents with the help of the children together with the invitation letter. The parents reported sociodemographic characteristics of children and themselves, and also the children’s eating habits and life styles.
3. BODY MASS INDEX MEASUREMENT AND CLASSIFICATION
For determining of overweight and obesity, a body mass index (BMI) was used. BMI, computed as weight in kilograms divided by the square of height in meters (body mass/height 2 = kg/m2), is widely used in research and clinical practice [17]. The international ageand gender-specific BMI cut points for children that were developed by the Childhood Obesity Working Group of the International Obesity Task Force were used to define weights of the subjects [18]. Children with BMI values that corresponded to an adult BMI of ≤24.99 kg/m2 were classified as normal weight, children with BMI values that corresponded to an adult BMI of 25.0 - 29.9 kg/m2 were classified as overweight (preobese), and children with BMI values that corresponded to an adult BMI of ³30.0 kg/m2 were classified as obese. In our statistical analysis, the obese group included overweight group.
4. DIETARY VARIABLES
The children were asked to answer whether they usually consume each of the following food items or main meals: fruits, vegetables, sweets, potato chips, cake or pastries, nondiet soft drinks/beverages, breakfast, lunch and also snacks. They were asked to answer the questions as yes or no.
5. LEISURE ACTIVITIES
The children were asked to answer whether they usually do physically active sport for 60 minutes or more, watch television, use computer, and live active at home or at school.
6. THE CONTENT AND RELIABILITY OF THE QUESTIONNAIRE
Basic socio-demographic information about the children and their parents was obtained. This included the students’ age, height, weight, birth weight, number of children in family, breast-feeding, household income level, illnesses history in childhood, and parents’ education level, height, weight, bad habits. This was then followed by evaluation of a standard set of 15 questions prepared using the literature [19-21] by the researchers concerning diet, eating and drinking habits, and lifestyle (Table 1). The assessment of eating and drinking habits and lifestyle included questions pertaining to such habits as having breakfast, eating fruits and vegetables, drinking beverages. In this section, eating/drinking habits and lifestyle were assessed on a yes/no answer. The details and reliability of the questionnaire were tested in an initial sample group of 59 students. The Alpha coefficient for internal consistency was found to be 0.816 for all the 15 items. We were then able to ascertain that the questionnaire was valid and consistent.
7. ETHICAL CONSENT
Local authorities, such as the health and education authorities in the city concerned as well as the head teachers of the schools concerned approved the study. Students and teachers were told that the survey concerned activities related to eating and drinking habits. They and
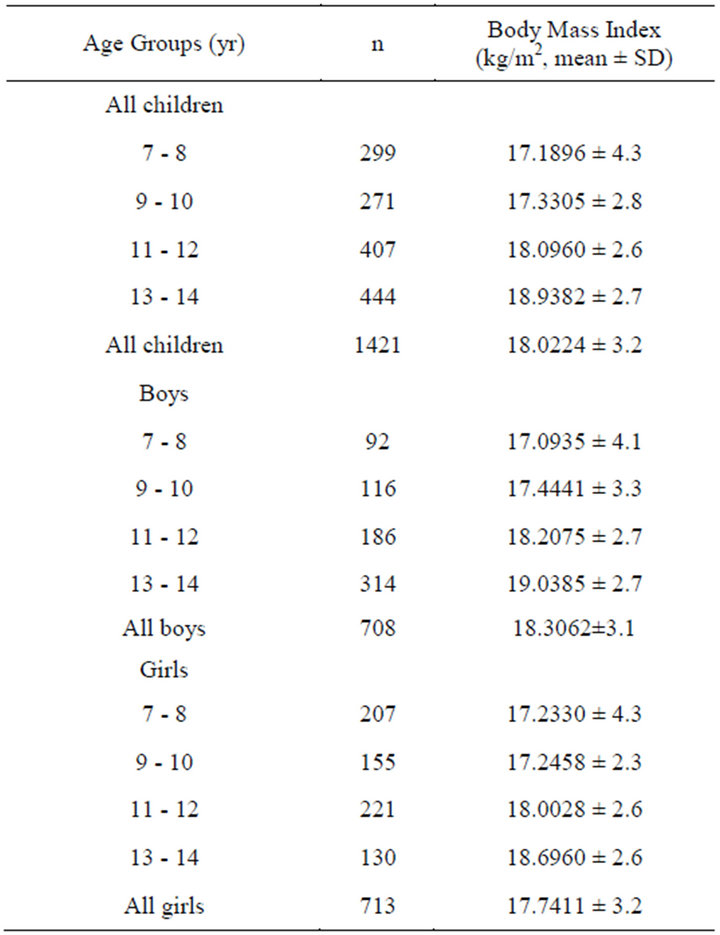
Table 1. Sample sizes and descriptive characteristics according to gender and age.
their teachers were assured of complete anonymity.
8. STATISTICAL ANALYSIS
The data collected was processed using a SPSS 10.0 packet program (SPSS Inc., Chicago, IL). Responses were analyzed using Chi-square (x2), student’s t test and percent (%) ratios according to gender and weight. Furthermore, reliability analysis was employed to test the reliability of the questionnaire scale. Differences were significant for p < 0.05. Differences in mean BMI values were determined using t test. One more statistical analysis was carried out using Chi-square (x2) test for categorical variables.
9. RESULTS
Mean age of the children was 10.9 ± 2.3 (min: 7-max: 14). There was an important difference between mean ages of boys and girls (10.88 ± 2.2 and 10.92 ± 2.3, respectively, p < 0.001). Mean height of all the children was 144.4 ± 14.9 (min: 110-max: 178), 144.5 ± 14.8 for boys and 144.3 ± 14.9 for girls, with an importance difference (p < 0.001). The children’s mean weight was 38.2 ± 10.9 (min = 20-max = 75), which was greater in boys than girls (38.3 ± 10.9 and 38.1 ± 10.9, respectively) (p < 0.001). Their mean BMI was 18.02 ± 3.2 (min: 9.3- max: 36.1), revealing an important connection between boys and girls (18.03 ± 2.9 and 18.01 ± 3.3, respectively), namely being greater in boys than girls (p < 0.001). For the comparisons of male age groups in terms of BMI, there were significant connections between all the age groups (p < 0.001, for each age groups), in which with increasing age the children’s mean BMIs showed increase, with a positive relationship, as well as the girls. The detailed data are presented in Table 2.
The background characteristics of the male and female students are presented in Table 3. There were no difference between boys and girls in terms of their background characteristics except for BMI values and birth weights of the children that showed statistically meaningful difference (p < 0.05 and p < 0.001, respectively). Most of the children were normal weight (96.9%), followed by overweight (2.3%) and obese students (0.8%). The proportion of obesity was only 3.1%, being much more in girls compared to boys (75.0% versus 25.0%, respectively) (p < 0.05). In parallel with obesity, overweight prevalence rates were greater in girls than boys (67.7% versus 32.3%, respectively) (p < 0.05). The children showed an approximate equal distribution in terms of age groups. The prevalence of the students whose mothers smoked was lower than that of their fathers (33.1% versus 60.2%). The proportion of students whose mothers consumed alcohol was only 1.5%, with the figure of 10.8% reported for students’ fathers. Birth weights
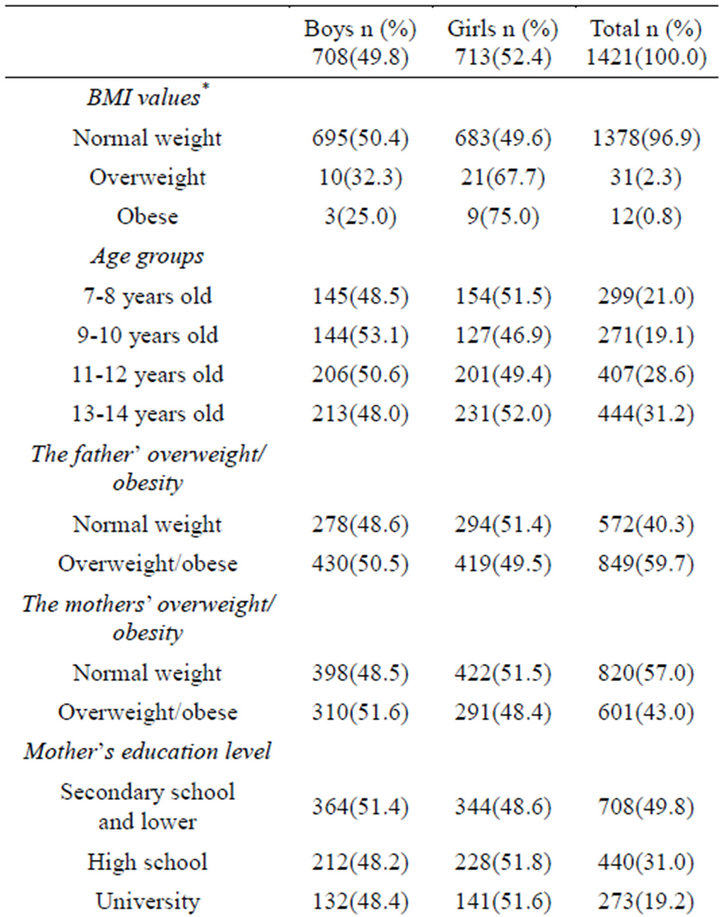
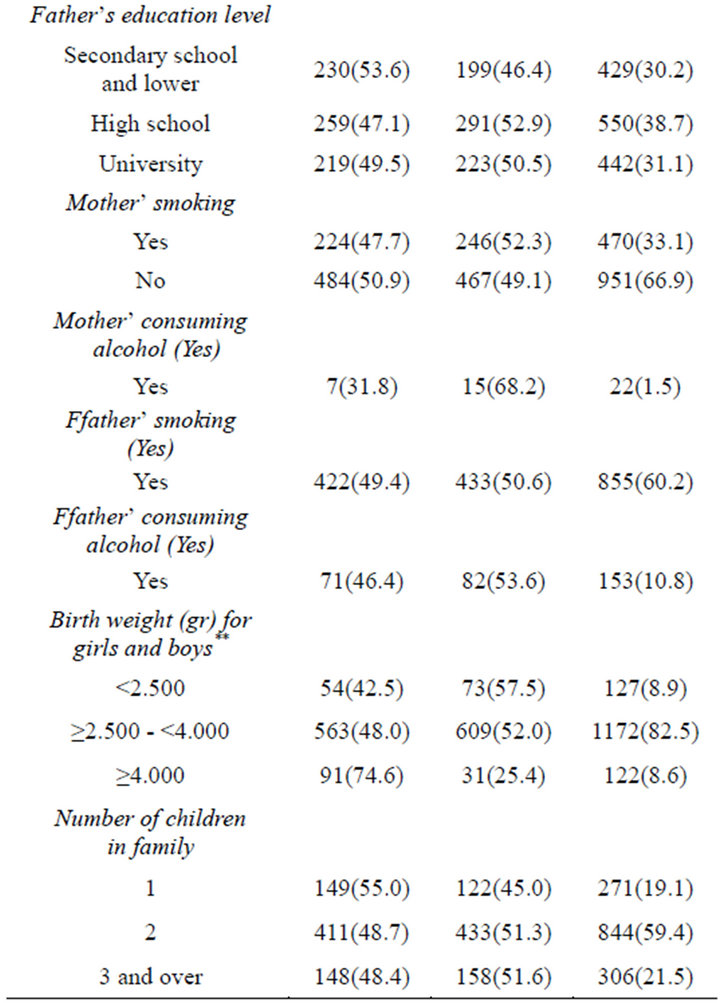
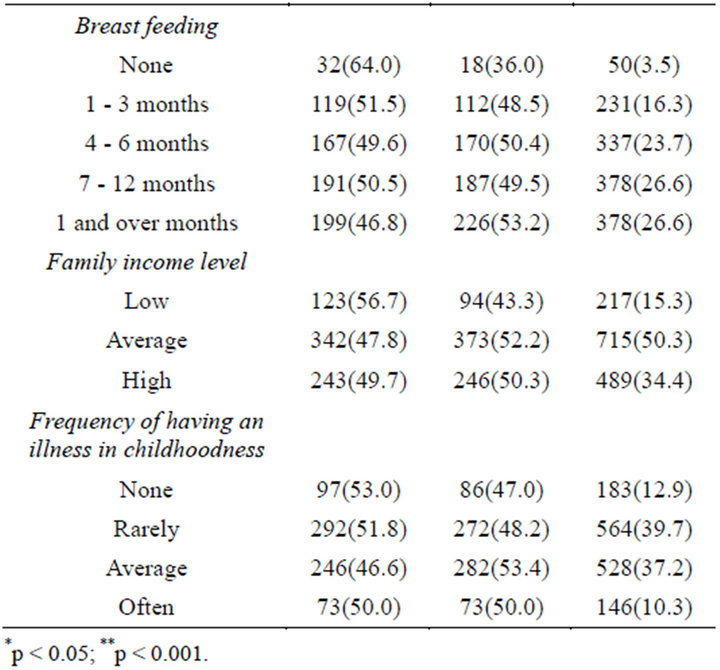
Table 2. The background characteristics of the male and female students
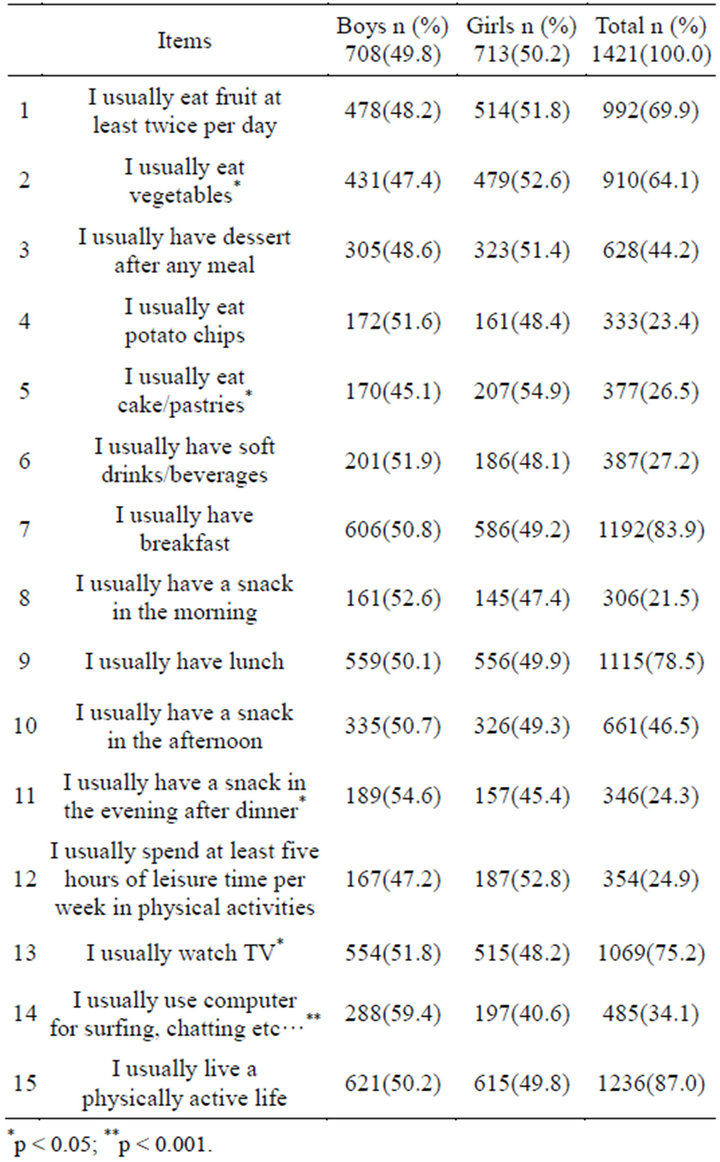
Table 3. Self-administrated questionnaire under supervision of guardians of the children to evaluate lifestyle and eating habits in a sample of 1421 school children.
showed significant differences between girls and boys; the prevalences of children whose birth weights were less than 2500 gr and whose birth weights were in normal range were higher in girls, whereas the prevalence of children whose birth weights were more than 4000 gr was higher in boys (p < 0.001). Number of children in family including themselves was 2 or more (80.9%, n = 1144). 3.5% of children were reported to have not breastfed. The proportion of those breastfeeding for four months and more was 76.9%. Family income level was mostly average or lower (65.6%). 52.6% children had not experienced any illness in childhood or had experienced rarely.
The yes response rates that subjects gave to the questionnaire items by gender were shown in Table 1. There were no difference between boys and girls in terms of their lifestyle and eating habits except for the items 2 (p < 0.05), and 5 (p < 0.05) in which the proportions of girls were higher, and the items 11 (p < 0.05), 13 (p < 0.05), and 14 (p < 0.001) in which the proportions of boys were higher compared to the other gender.
Table 4 evaluates the children’s lifestyle and eating habits by obesity status. Most of the students (over 50%) reported eating fruit at least twice per day (68.2%), having breakfast (83.9%), having lunch (78.5), watching TV (75.2%), living a physically active life (87.0%), breast feeding (96.5%), being children more than one in their family (80.9%). In addition most indicated that their fathers smoked (60.1%), and that their father was overweight/obese (59.3%).
It revealed significant connections between obese/ overweight children and normal weight children in respect to lifestyle and eating habits with the except of the items 9, 11, 14, 16, 20, 22, 24, 25, and 26.
Most of the nonobese students reported that they usually had soft drinks/beverages when compared to the obese students (27.6% vs 14.0, respectively) (p < 0.05). As compared with obese students, most nonobese students reported having a snack in the morning (9.3% vs 21.9%, respectively), and being children more than one in their family (81.3% vs 69.8%, respectively) (p < 0.05, for each one). On the other hand, as compared with nonobese students, most obese students reported having a snack in the afternoon (46.0% vs 62.8%, respectively), not spending at least five hours of leisure time per week in physical activities (11.6% vs 25.3%, respectively), being high monthly household income level (34.0 vs 48.8%, respectively), that their mother’ education level was university (18.8% vs 32.6%, respectively), eating less fruits (56.1% vs 70.3%, respectively), eating less vegetables (30.2% vs 65.1, respectively), having more dessert after any meal (74.4% vs 43.3%, respectively), eating more potato chips (37.2% vs 23.0%, respectively), watching more television (93.0 vs 74.7, respectively), living a physically active life less (81.4% vs 87.2%, respectively), less breast feeding (90.7% vs 96.7%, respectively), their father consuming more alcohol (20.9% vs 10.4%, respectively), their father being more overweight/ obese (76.7% vs 59.2%, respectively), their mother being overweight/obese (69.8% vs 42.2%, respectively) (statistically important relationships for each one).
10. DISCUSSION
The purpose of this study was to provide recent estimates of the prevalence rates of overweight/obesity in a group of Turkish children and link to overweight/obesity in Turkish primary education students with eating and lifestyle habits. Our findings indicate that only 2.3% of Turkish students were overweight or 0.8% were obese. In this analysis, we used the following BMI values for calculation weight: ³25 kg/m2 - <30 kg/m2 for overweight, ³30 kg/m2 for obesity. There is a likelihood of an underestimation of overweight in this study, since lower BMI values may be more appropriate for this group of Turkish children.
In this sample, with the prevalence rates being higher in girls than boys, overweight/obesity were associated with decreased physical activity participation and increased television viewing time. This finding consistent with some reports indicating that there is a positive relationship between physical inactivity or watching TV and obesity [22]. In addition, these results support the growing body of evidence implicating television viewing as a leading factor in childhood obesity consistent with studies that found a cause-and-effect relationship between television viewing and obesity younger persons [23,24]. Increased dietary intake from eating during viewing or from the effects of food advertising, decreased energy expenditure during viewing, and reduced energy expenditure from television viewing displacing physical activity may be an explanation for this [24]. These results emphasize the importance that leisure-time physical activity or athletic movement and watching TV less play in the childhood obesity epidemic. We determined that both boys and girls were physically inactive in a proportion of about 90% and our findings support the hypothesis that physical inactivity is implicated in obesity, as there was a trend for increased overweight and obesity with decreasing physical activity participation in boys and girls [25]. In similar, some studies reported that a strong association of physical inactivity and obesity is well recognized, especially in school children [10,26]. These results suggest that the overweight factor might be another important cause for girls’ physical inactivity. Since it is important to encourage children to participate in physical activity, its relationship with overweight or obesity should be closely monitored, especially for girls.
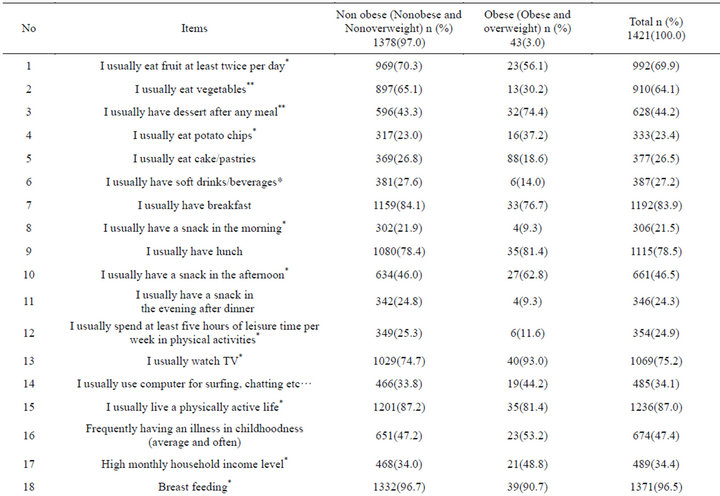
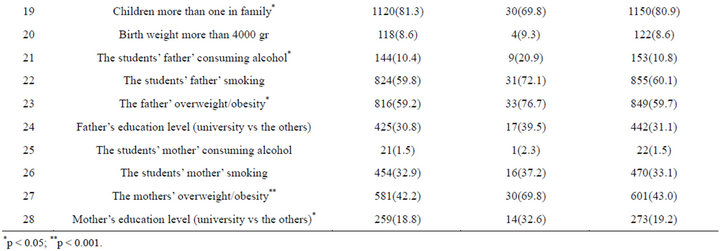
Table 4. Self-administrated questionnaire under supervision of guardians of the children to evaluate lifestyle and eating habits in a sample of 1421 school children.
In a study by Wang et al. (2002) [27], it was indicated that school girls were more likely to be overweight or obese compared with boys, supporting our study finding; the proportions of overweight/obesity were higher in girls than boys (p < 0.05). For this gender difference, one biological explanation could be that boys are more active, and when the calorie load increases, maybe girls are more affected [28]. Thus, he advised that it is crucial to help girls who are obese because they suffer more under the pressure of modern beauty ideals. In addition, Lovejoy and Sainsbury (2008) indicated that sex differences in obesity can be explained in part by the influence of gonadal steroids on body composition and appetite; however, behavioral, socio-cultural and chromosomal factors may also play a role [29].
In a study on body mass index references for 2119 Turkish children aged 6 to 18 y [30], the prevalence of overweight is 15% - 25% and obesity 1% - 4% in children. Another survey concerning the height and weight of 989 adolescents in Turkey [31] demonstrated that the prevalence of overweight and obesity among adolescent girls was 10.6% and 2.1%, respectively, while it was 11.3% and 1.6% for adolescent boys. Another Turkish study reported that the prevalence of obesity in school children was 2.8% [32]. In a study conducted out in another city in Turkey, Antalya, the overall prevalence of obesity was 3.6% while overweight was 14.3% [33] and an obesity prevalence of 7.8% in Iranian children [34]. The rising trend of overweight and obese children in advanced countries [35] are not consistent with the results reported here, especially for ours. Our findings, which are based on children’s or their guardians’ self-reports of eating habits and lifestyle and our measurement of weight and height of children, and which was conducted in a urban area, suggest that the prevalence rates of overweight and obesity are much more lower than those previously reported in younger children. These findings suggest that the childhood obesity in our city is not as serious as expected. Given the magnitude and direction of the biases observed for self-reported height and body mass in youth in prior studies [30,31], we believe that the overweight and obesity prevalence rates presented in those studies were overestimated, which merits further research. In parallel, a detail might be that a wide variety of definitions of child obesity are in use, and no commonly accepted standard has yet emerged. However, the BMI is widely used in populations, especially older persons, and a cut off point of 30 kg/m2 is recognized internationally as a definition of adult obesity [36].
Overweight and obesity are caused by an imbalance between energy intake and expenditure, but the exact reasons behind this phenomenon are unclear. Changes in dietary patterns in the past few decades, such as an increase in the consumption of high fat and sugar foods, have been implicated in the increase in obesity [4,37]. Similarly, in our study, the prevalences of those who were nourished with high fat and sugar foods such as “having dessert after any meal”, “eating potato chips”, “having a snack in the afternoon” were higher in obese students than nononbese students. On the other hand, this study showed that the reported intake of healthy foods was rather high for children in this school. For example, in similar to the guidelines recommending at least 5 servings of fruits and vegetables per day [38], more than half of the children reported eating fruits and vegetables. At the same time, less than half of the children reported having dessert after any meal, eating potato chips, and eating cake/pastries, and this rather low rates could be an explanation for being low of overweight and obesity prevalences. Because these unhealthy foods made up a small portion of the total diet.
This study found that the proportions of those eating fruits and vegetables were lower in the obese students compared to the nonobese (p < 0.05 and p < 0.001, respectively), being supported by many study results [39,40]. This shows that interventions targeting intake of healthier alternatives for low-nutrient dense foods may have increased preference for healthier foods for our study children [41]. Importance of eating fruit and vegetable results from the fact that increasing carbohydrate and fiber intake by eating more fruits and vegetables may enhance satiation, reducing caloric and fat intake [42].
The close relationship between adiposity of parents and their children reflects both genetic and cumulative environmental factors including behavioral ones [43]. In the current sample parental obesity was one of the most significant risk factors for obesity of the children; 76.7% and 69.8% of the obese children had one obese father and mother, respectively, in line with some researchers’ findings [44]. Although obesity is associated with genetic factors [45], the trend of the increasing obesity is due, above all, to the changing nutritional and physical activeity pattern of the population [46]. Mainly social, environmental and psychological reasons can explain such changes in the lifestyle of parents, and thus also children.
In a research on protective effect of breast-feeding in Czech children aged 6 - 14-year-old, it was found that the overall prevalence of overweight and obesity was lower in breast-fed children, indicating that a reduced prevalence of overweight/obesity was associated with breast-feeding [47]. Many studies support this important result [48,49] in line with our findings reporting that obesity was lower in those breast-feeding compared to those not (90.7% vs 96.7%, respectively). These results expose that breastfeeding is a protective factor against obesity, and also that all the babies during first months of life, especially at least first 6 months, should be breastfed, being emphasized that breastfeeding exclusively to six months of age is the most appropriate way to feed infants.
In this study, the children of father or mother whose educational level were university were more obese compared to the other educational levels (39.5% vs 30.8% and 32.6% vs 18.8%, respectively) in line with some researchers’ results showing an positive association between the parents’ higher education level and the bodily development of the child [19,21,50,51]. One explanation for this reason could be that higher education of the parents has a positive effect on the general lifestyle of the children-their physical activity, leisure time activity, dietary habits [45]. However some researchers found that this positive relationship was not acceptable indicating that children of parents with a lower educational level are twice as likely as to be obese compared to children of parents with a higher educational level [21]. As an explanation for these differences, it may be said that due to contradictory results, further study needs to be conducted.
Our study findings showed that when compared to only one child in family, in children more than one in family the proportion of obesity was lower (81.3% vs 69.8%, respectively) (p < 0.05). One reason of this might be the case that families with one child can afford to spend more on calorie-rich food per child than households with more than one child [21].
In the present study, in children with high household income, the prevalence of those who are obese was significantly higher when compared to those who are not (48.8% vs 34.0%, respectively). This is consistent with some studies [33], whereas it is not consistent with some study results indicating the opposite [27], necessitating further studies to make clearer these contradictory results.
Actually, for nearly half of the items, we did not observe significant associations among dietary habits, lifestyle, and obesity. It is possible that lack of consistent associations is explained by the fact that overweight and obese students are more likely than normal weight students to misreport unhealthy food intake [52]. In addition to this fact, we could say that the portion sizes of unhealthy foods were greater in the overweight and obese students, which would not have been reflected in their questionnaire responses.
Although a cross sectional survey does not allow drawing any causal conclusion, this study provides information about the relationship between obesity, eating habits and life style. Despite using self-reported data, we still found associations among obesity, physical activity and television viewing that were consistent, and in the expected direction.
11. CONCLUSIONS
In this studied Turkish sample of the school children, a small portion of 7 - 14-year-old Turkish children are at increased health risk owing to overweight and obesity in an urban population in a developing country. However, our data indicate that television viewing and physical inactivity are strongly associated with overweight and obesity. Thus, public or school health campaigns aimed at increasing physical activity participation and decreasing sedentary behaviors should be implemented, although it was found rather low in this study. In addition, breastfeeding reduced the prevalence of obesity. Thus, breastfeeding promotion should become a part of public health programmes for the prevention of obesity.
In conclusion, education about eating habits and physical activities for school-age children are important behaviors of generating solutions towards obesity that should be considered in national programs aimed at promoting healthy eating and life styles. They should be included in the school curricula for children and teachers and organized according to governmental alimentary guides.
12. ACKNOWLEDGEMENTS
We thank the authorities of the school and the participant children and their guardians, and the teachers of the classes, who helped us to collect the data.
REFERENCES
- Swinburn, B. and Egger, G. (2010) Preventive strategies against weight gain and obesity. Obesity Reviews, 3, 289- 301. doi:10.1046/j.1467-789X.2002.00082.x
- World Health Organization (1998) Obesity: Preventing and managing the global epidemic. Report of a WHO consultation, Geneva, 3-5 Jun 1997. Geneva.
- Bartkiw, T.P. (1993) Children’s eating habits: A question of balance. World Health Forum, 14, 404-406.
- French, S.A., Story, M. and Jeffery, R.W. (2001) Environmental influences on eating and physical activity. Annual Review of Public Health, 22, 309-335. doi:10.1146/annurev.publhealth.22.1.309
- Shields, M. (2008) Tremblay MS: Sedentary behaviour and obesity. Health Reports, 19, 19-30.
- Roberts, S.B., Savage, J., Coward, W.A., Chew, B. and Lucas, A. (1998) Energy expenditure and intake in infants born to lean and overweight mothers. The New England Journal of Medicine, 318, 461-466.
- Kourlaba, G., Panagiotakos, D.B., Mihas, K., Alevizos, A., Marayiannis, K., Mariolis, A. and Tountas, Y. (2008) Dietary patterns in relation to socio-economic and lifestyle characteristics among Greek adolescents: A multivariate analysis. Public Health Nutrition, 9, 1-7.
- Al Sabbah, H., Vereecken, C., Kolsteren, P., Abdeen, Z. and Maes, L. (2007) Food habits and physical activity patterns among Palestinian adolescents: Findings from the national study of Palestinian schoolchildren (HBSCWBG2004). Public Health Nutrition, 10, 739-746. doi:10.1017/S1368980007665501
- Dean, K. (1989) Self-care components of lifestyles: The importance of gender, attitudes and the social situation. Social Science & Medicine, 29, 137-152. doi:10.1016/0277-9536(89)90162-7
- Moussa, M.A., Shaltout, A.A., Nkansa-Dwamena, D., Mourad, M., Alsheikh, N., Agha, N. and Galal, D.O. (1999) Factors associated with obesity in Kuwaiti children. European Journal of Epidemiology, 15, 41-49. doi:10.1023/A:1007556608104
- Kromeyer-Hauschild, K., Zellner, K., Jaeger, U. and Hoyer, H. (1999) Prevalence of overweight and obesity among school children in Jena (Germany). International Journal of Obesity and Related Metabolic Disorders, 23, 1143-1150. doi:10.1038/sj.ijo.0801044
- Chinn, S. and Rona, R.J. (2001) Prevalence and trends in overweight and obesity in three cross sectional studies of British children, 1974-1994. British Medical Journal, 322, 24-26. doi:10.1136/bmj.322.7277.24
- Dietz, W.H. and Robinson, T.N. (1998) Use of the body mass index (BMI) as a measure of overweight in children and adolescents. Journal of Pediatrics, 132, 191-193. doi:10.1016/S0022-3476(98)70426-3
- Daniels, S.R., Khoury, P.R. and Morrison, J.A. (1997) The utility of body mass index as a measure of body fatness in children and adolescents: Differences by race and gender. Pediatrics, 99, 804-807. doi:10.1542/peds.99.6.804
- Puder, J.J. and Kriemler, S. (2008) Can we stop the epidemic of childhood obesity? Praxis, 97, 17-23.
- Cali, A.M. and Caprio, S. (2008) Obesity in children and adolescents. The Journal of Clinical Endocrinology & Metabolism, 93, 31-36. doi:10.1210/jc.2008-1363
- Cole, T.J., Flegal, K.M., Nicholls, D. and Jackson, A.A. (2007) Body mass index cut offs to define thinness in children and adolescents: international survey. British Medical Journal, 335, 194.
- Cole, T.J., Bellizzi, M.C, Flegal, K.M. and Dietz, W.H. (2000) Establishing a standard definition for child overweight and obesity worldwide: International survey. British Medical Journal, 320, 1240-1243. doi:10.1136/bmj.320.7244.1240
- Koziel, S., Kolodziej, H. and Ulijaszek, S.J. (2000) Parental education, body mass index and prevalence of obesity among 14-year-old boys between 1987 and 1997 in Wrocław, Poland. European Journal of Epidemiology, 16, 1163-1167. doi:10.1023/A:1010924511774
- Vignerová, J., Bláha, P., Osancová, K. and Roth, Z. (2004) Social inequality and obesity in Czech school children. Economics & Human Biology, 2, 107-118. doi:10.1016/j.ehb.2003.12.004
- Kobzová, J., Vignerová, J., Bláha, P., Krejcovský, L. and Riedlová, J. (2004) The 6th nationwide anthropological survey of children and adolescents in the Czech Republic in 2001. Cent Central European Journal of Public Health, 12, 126-130.
- Janssen, I., Katzmarzyk, P.T., Boyce, W.F., King, M.A. and Pickett, W. (2004) Overweight and obesity in Canadian adolescents and their associations with dietary habits and physical activity patterns. Journal of Adolescent Health, 35, 360-367.
- Robinson, T.N. (1999) Reducing children’s television viewing to prevent obesity: A randomized controlled trial. Journal of the American Medical Association, 282, 1561- 1567. doi:10.1001/jama.282.16.1561
- Robinson, T.N. (2001) Television viewing and childhood obesity. Pediatric Clinics of North America, 48, 1017- 1025. doi:10.1016/S0031-3955(05)70354-0
- Lahti-Koski, M., Pietinen, P., Heliövaara, M. and Vartiainen, E. (2002) Associations of body mass index and obesity with physical activity, food choices, alcohol intake, and smoking in the 1982-1997 FINRISK studies. The American Journal of Clinical Nutrition, 75, 809-817.
- Franzini, L., Elliott, M.N., Cuccaro, P., Schuster, M., Gilliland, M.J., Grunbaum, J.A., Franklin, F. and Tortolero, S.R. (2009) Influences of physical and social neighborhood environments on children’s physical activity and obesity. American Journal of Public Health, 99, 271-278. doi:10.2105/AJPH.2007.128702
- Wang, Z., Patterson, C.M. and Hills, A.P. (2002) Association between overweight or obesity and household income and parental body mass index in Australian youth: Analysis of the Australian National Nutrition Survey, 1995. Asia Pacific Journal of Clinical Nutrition, 11, 200- 205. doi:10.1046/j.1440-6047.2002.00291.x
- Flodmark, C.E. (2005) Management of the obese child using psychological-based treatments. Acta Paediatrica, 94, 14-22. doi:10.1080/08035320510035591
- Lovejoy, J.C., Sainsbury, A. and the Stock Conference 2008 Working Group (2009) Sex differences in obesity and the regulation of energy homeostasis. Obesity Reviews, 10, 154-167. doi:10.1111/j.1467-789X.2008.00529.x
- Bundak, R., Furman, A., Gunoz, H., Darendeliler, F., Bas, F. and Neyzi, O. (2006) Body mass index references for Turkish children. Acta Paediatrica, 95, 194-198. doi:10.1080/08035250500334738
- Oner, N., Vatansever, U., Sari, A., Ekuklu, E., Güzel, A., Karasalihoğlu, S. and Boris, N.W. (2004) Prevalence of underweight, overweight and obesity in Turkish adolescents. Swiss Medical Weekly, 134, 529-533.
- Coskun, Y. and Bayraktaroglu, Z. (1997) Coronary risk factors in Turkish school children—Report of a pilot study. Acta Paediatrica, 86, 187-191. doi:10.1111/j.1651-2227.1997.tb08866.x
- Turkkahraman, D., Bircan, I., Tosun, O. and Saka, O. (2006) Prevalence and risk factors of obesity in school children in Antalya, Turkey. Saudi Medical Journal, 27, 1028-1033.
- Kelishadi, R., Ardalan, G., Gheiratmand, R., Majdzadeh, R., Hosseini, M., Gouya, M.M., Razaghi, E.M., Delavari, A., Motaghian, M., Barekati, H., Mahmoud-Arabi, M.S., Lock, K. and Caspian Study Group (2008) Thinness, overweight and obesity in a national sample of Iranian children and adolescents: CASPIAN study. Child: Care, Health and Development, 34, 44-54.
- Jebb, S.A. and Lambert, J. (2000) Overweight and obesity in European children and adolescents. European Journal of Pediatrics, 159, 2-4. doi:10.1007/PL00014362
- WHO World Health Organization (1995) Physical status: The use and interpretion of anthropometry. WHO, Geneva.
- Prentice, A.M. and Jebb, S.A. (1995) Obesity in Britain: Gluttony or sloth? British Medical Journal, 311, 437-439. doi:10.1136/bmj.311.7002.437
- CDC (2005) 5 A day works! US Department of Health and Human Services, Atlanta. http://www.cdc.gov/nccdphp/dnpa/nutrition/health_professionals/programs/5aday_works.pdf
- van Sluijs, E.M., Skidmore, P.M., Mwanza, K., Jones, A.P., Callaghan, A.M., Ekelund, U., Harrison, F., Harvey, I., Panter, J., Wareham, N.J., Cassidy, A. and Griffin, S.J. (2008) Physical activity and dietary behaviour in a population-based sample of British 10-year old children: The SPEEDY study (Sport, physical activity and eating behaviour: Environmental determinants in young people). BMC Public Health, 8, 388.
- Lemon, S.C., Zapka, J., Li, W., Estabrook, B., Magner, R. and Rosal, M.C. (2009) Perceptions of worksite support and employee obesity, activity, and diet. American Journal of Health Behavior, 33, 299-308. doi:10.5993/AJHB.33.3.8
- Birch, L.L., McPhee, L., Steinberg, L. and Sullivan, S. (1990) Conditioned flavor preferences in young children. Physiology & Behavior, 47, 501-505. doi:10.1016/0031-9384(90)90116-L
- Rolls, B.J. (1995) Carbohydrates, fats, and satiety. The American Journal of Clinical Nutrition, 61, 960-967.
- Komlos, J., Smith, P.K. and Bogin, B. (2004) Obesity and the rate of time preference: Is there a connection? Journal of Biosocial Science, 36, 209-219. doi:10.1017/S0021932003006205
- Mazur, A., Klimek, K., Telega, G., Hejda, G., Wdowiak, L. and Malecka-Tendera, E. (2008) Risk factors for obesity development in school children from south-eastern Poland. Annals of Agricultural and Environmental Medicine, 15, 281-285.
- Maffeis, C. (2000) Aetiology of overweight and obesity in children and adolescents. European Journal of Pediatrics, 159, 35-44. doi:10.1007/PL00014361
- WHO (2000) Technical Report Series, Obesity: Preventing and managing the global epidemic. World Health Organization, Geneva.
- Toschke, A.M., Vignerova, J., Lhotska, L., Osancova, K., Koletzko, B. and Von Kries R. (2002) Overweight and obesity in 6- to 14-year-old Czech children in 1991: Protective effect of breast-feeding. Journal of Pediatrics, 141, 764-769. doi:10.1067/mpd.2002.128890
- Binns, C., Lee, M.K. and Oddy, W. (2003) Breastfeeding and the prevention of obesity. Asia-Pacific Journal of Public Health, 15, 22-26.
- Kreichauf, S., Pflüger, M., Hummel, S. and Ziegler, A.G. (2008) Effect of breastfeeding on the risk of becoming overweight in offspring of mothers with type 1 diabetes. Deutsche Medizinische Wochenschrift, 133, 1173-1177. doi:10.1055/s-2008-1077234
- Vignerová, P., Bláha, P. and Lhotská, L. (1998) Physical growth of Czech children and some socio-economic factors. Journal of Human Ecology, 9, 227-231.
- Maddah, M. (2009) Risk factors for overweight in urban and rural school girls in Iran: Skipping breakfast and early menarche. International Journal of Cardiology, 136, 235-238. doi:10.1016/j.ijcard.2008.04.046
- Garaulet, M., Martinez, A., Victoria, F., Perez-Llamas, F., Ortega, R.M. and Zamora, S. (2000) Differences in dietary intake and activity level between normal-weight and overweight or obese adolescents. Journal of Pediatric Gastroenterology and Nutrition, 30, 53-258.