International Journal of Geosciences
Vol.4 No.10(2013), Article ID:41574,10 pages DOI:10.4236/ijg.2013.410146
Allowable Bearing Capacity for Shallow Foundation in Eket Local Government Area, Akwa Ibom State, Southern Nigeria
1Department of Physics, University of Uyo, Uyo, Nigeria
2Department of Physics, Akwa Ibom State University, Ikot Akpaden, Nigeria
Email: nyaknojimmyg@yahoo.com, nyaknojimmyg@gmail.com
Copyright © 2013 Joseph Gordian Atat et al. This is an open access article distributed under the Creative Commons Attribution License, which permits unrestricted use, distribution, and reproduction in any medium, provided the original work is properly cited. In accordance of the Creative Commons Attribution License all Copyrights © 2013 are reserved for SCIRP and the owner of the intellectual property Joseph Gordian Atat et al. All Copyright © 2013 are guarded by law and by SCIRP as a guardian.
Received October 25, 2013; revised November 23, 2013; accepted December 15, 2013
Keywords: Allowable Bearing Pressure; Ultimate Failure; P-Wave Velocity; S-Wave Velocity; Shear Modulus
ABSTRACT
P-wave and S-wave velocities were obtained from seismic refraction survey in the foundation layer of Eket, the study area. The Tezcan’s approach discussed extensively in the work was used in conjunction with the existing mathematical relations between elastic parameters and seismic refraction velocities for the study of foundation layers in the study area. Based on the results, the elastic constants, allowable bearing pressure/capacity, ultimate bearing capacity and other parameters in Table 1 were determined. The result shows that allowable bearing pressure increases with increase in shear modulus and shear wave velocity. The empirical relation between allowable bearing capacity and shear modulus shows that the allowable bearing capacity increases with depth. Comparing our findings with some ranges of safe allowable bearing capacities of similar non cohesive/granular soils in literatures, the second layer with allowable bearing capacity range of 72.56 - 206.63 kN∙m−2 (average = 154.78 kN∙m−2) has been considered to be the safe shallow engineering foundation in the study area. The empirical relations between allowable bearing capacities shear modulus and shear wave velocity, in conjunction with the inferred maps, which serve as our findings, will be used as guide in the location of foundations. The inferred ultimate and allowable capacities correlate maximally for the two shallow foundations penetrated by the seismic waves. This perfect correlation reflects the uniqueness of the method.
1. Introduction
In order to determine the allowable bearing pressure for shallow foundations, a reliable and fast Non Destructive Testing (NDT) capable of measuring the thickness and stiffness (bearing capacity) is desirable. This is based on refraction method that allows the propagation of compressional and shear waves into the layered earth profiles. This method calculates the time-depth plot intercept of refracted P-wave and S-wave in order to find their velocities. The P-wave velocity combined with S-wave velocity is an effective parameter for determining the stiffness or bearing capacity of materials [1-14]. These measured and calculated parameters relate with elastic parameters like Young’s modulus, Bulk modulus, shear modulus, Poisson’s ratio, Oedometric modulus and others, leading to the determination of allowable bearing pressure for shallow foundations according to [15] approach.
A foundation is the supporting base of a structure which forms the interface across which the loads are transmitted to the underlying soil or rock. If the structural loads are transmitted to the near-surface soil, then it is referred to as shallow foundation. Shallow foundations include spread footing and mat foundations. Failure of a foundation could occur due to inadequate bearing capacity of the soil beneath the foundation (leading to shear failure), overturning or sliding of the foundation. Ground shear failure occurs when the soil divides into separate blocks or zones, which move along slip surfaces. A continuous slip surface occurs up to ground level; soil above failure surface in state of plastic equilibrium, with heaving on either side. Failure is sudden, catastrophic and accompanied by tilting of the footing-associated with low compressibility soils which include dense sand or stiff over-consolidated clays. Shear failure may be local if the significant compression under footing causes only a partial development of plastic equilibrium. Failed surface is not continuous, not catastrophic and is associated with some minor heaving at the ground level. This occurs in moderately compressible soils—medium dense/compact sands. Punching shear failure characterized by vertical slip surfaces, large vertical displacements with no heaving, tilting or catastrophic failure is also obvious in soils. Compression increases the density of the soil. Weak, highly compressible soil-loose sands, partially saturated clays and peats. Soil is therefore a natural unconsolidated mineral and organic matter occurring above bedrock which can be classified as loose, soft, deformable material.
Therefore, it is important to know the allowable bearing capacity (the bearing pressure that will cause acceptance settlement of the structure) so as to avoid high/ extreme ultimate bearing capacity which is the intensity of bearing pressure at which the supporting ground is expected to fail in shear (that is, a building will collapse). [15,16] have used the P-wave velocities to determine the unconfined compressive strengths and modulus of elasticity of soil samples. [17] established the relations between the shear wave velocities, void ratio and shear rigidity of soils based on extensive experimental data.
Various expressions relating the seismic wave velocities to weight density permeability, water content, unconfined compressive strength and modulus of elasticity have been studied by [17].
However, many have studied the use of geophysical methods in foundation engineering [18-21]. Going by typical empirical expressions proposed for the rapid determination of the allowable bearing pressures in soils, in “soft” rocks by [15], which was an extension of [22], a geophysical refraction seismic survey method was carried out to measure compressional and shear wave velocities in Eket, the location of the study area. This shear wave velocity enables the determination of the allowable bearing capacity.
2. Site Location and Geology
Eket, one of the oil producing zones in Nigeria, is located within latitudes 4˚00'N to 4˚30'N and longitudes 7˚45'E to 8˚00'E. It occupies the south central portion of Akwa Ibom State territorial expanses, spanning northwards between latitudes 4˚33' and 4˚45' and Eastwards between longitudes 7˚52' and 5˚02'. Eket is bounded on the north by Nsit Ubium Local Government Area, on the east by Esit Eket, on the West by Onna and on the south by Ibeno Local Government Area/Bight of Bonny (Figure 1).
Forest resources include timber, palm produce while
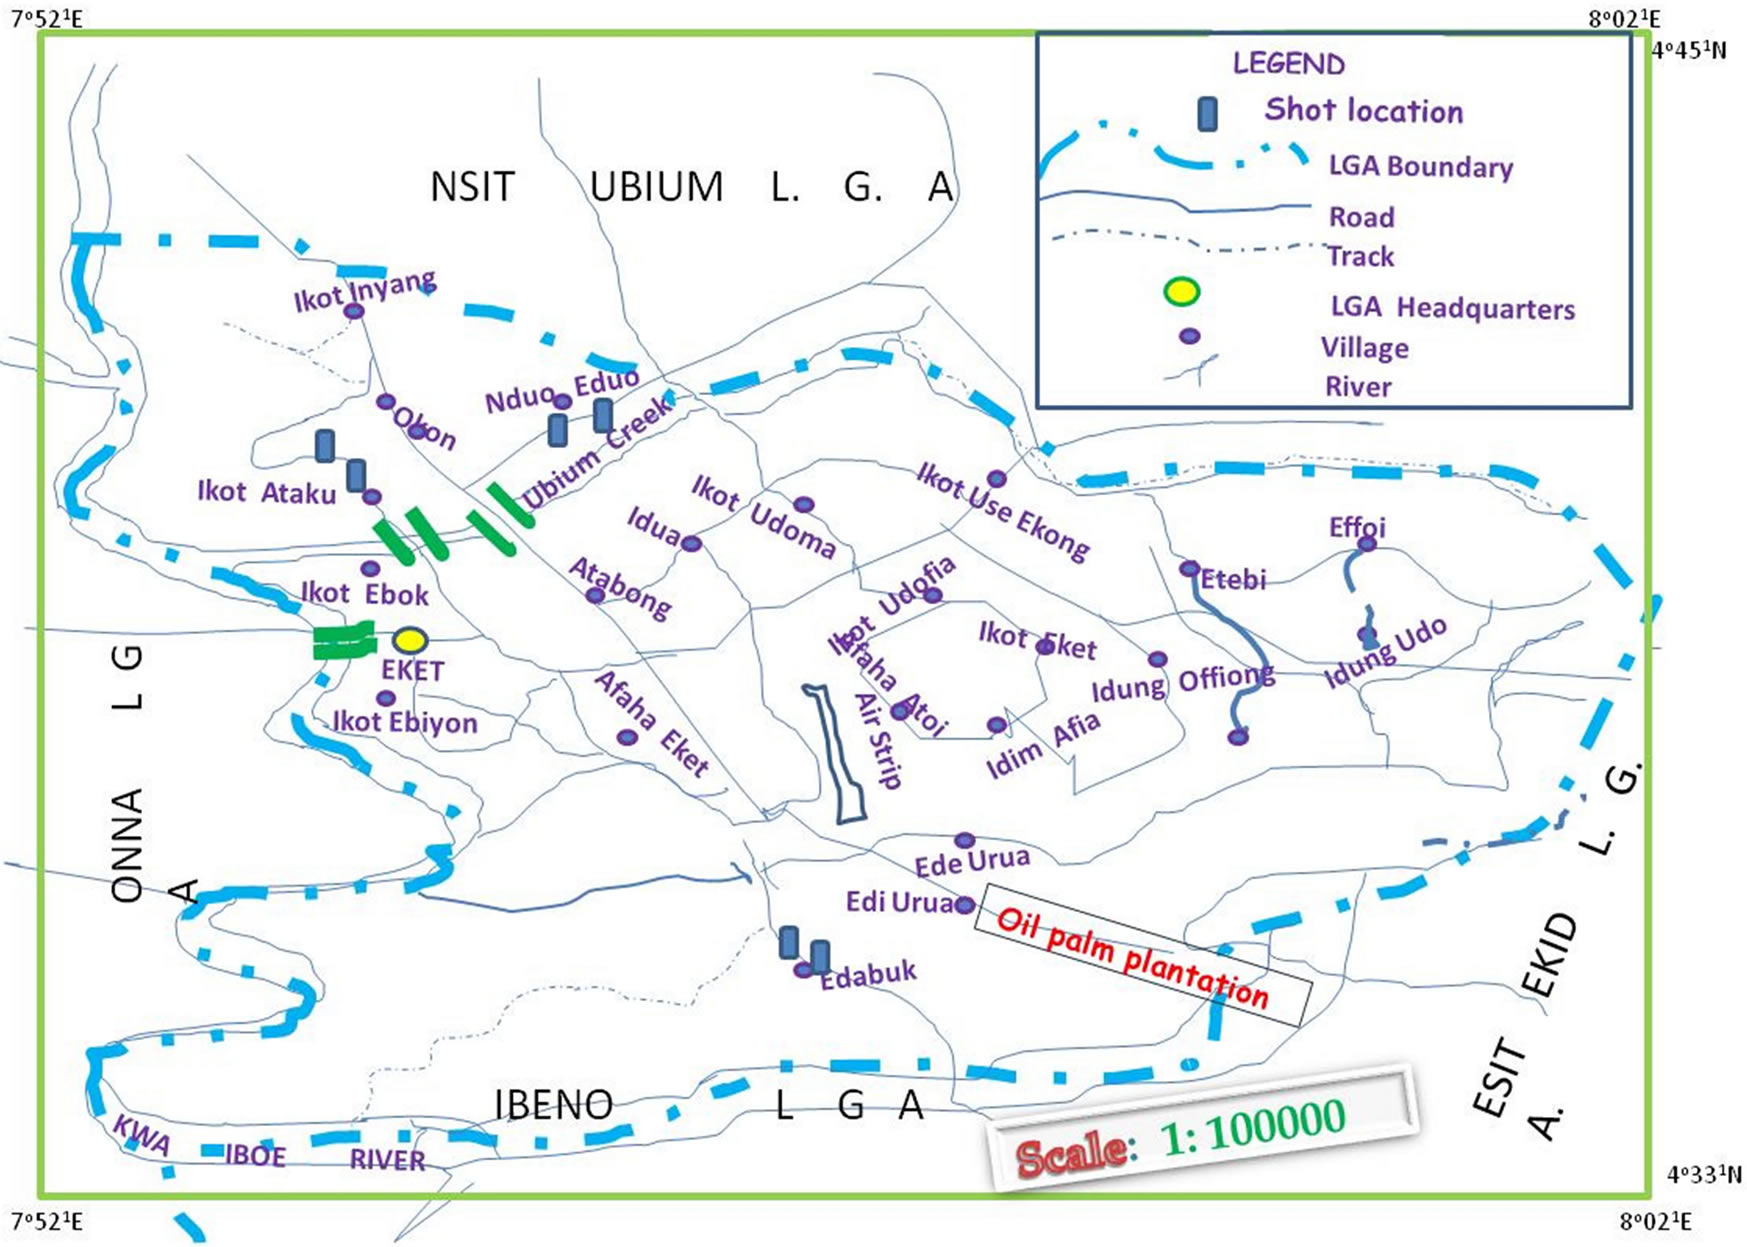
Figure 1. Map showing the shot locations in the study area.
the area is also noted for sea food production. Farm crops range from yam, cassava, coco-yam, plantain to maize and vegetables. Abundant deposit of natural resources: crude oil and clay are available. The physical relief of Eket is relatively flat, though with some marshy riverwashed soils around the banks of Qua Iboe River. It falls within the tropical zone where in its dominant vegetation is the green foliage of trees/shrubs and the oil palm tree belt. The Local Government Area has two seasons: the wet season and the dry season. Geologically, the area is underlain by Sedimentary Formation of late Tertiary and Holocene ages. Deposits of recent alluvium and beach ridge sands occur along the coast and the estuaries of the Imo River and Qua Iboe River and also along the floodplains of creeks. No portion exceeds 175 m above sea level. Mangrove swamps are extensively developed in the coastal and estuarine areas.
3. Theory
The P and S-wave velocities are usually denoted by Vp and Vs respectively. Once the seismic wave velocities are measured, shear modulus (µ), Bulk modulus (K), Young’s modulus or modulus of elasticity (E), Poisson’s ratio (σ), Oedometric modulus (Ec) and other elastic parameters may be obtained from the Equations (1)-(8) below. These expressions make the determination of the allowable bearing pressure possible.
1) Shear modulus (µ) relates with shear wave velocity as expressed in Equation (1):
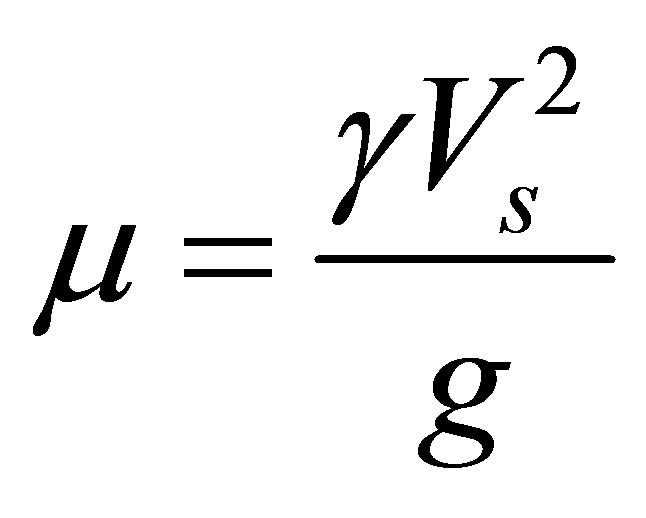 (1)
(1)
Where g is the acceleration due to gravity which is give 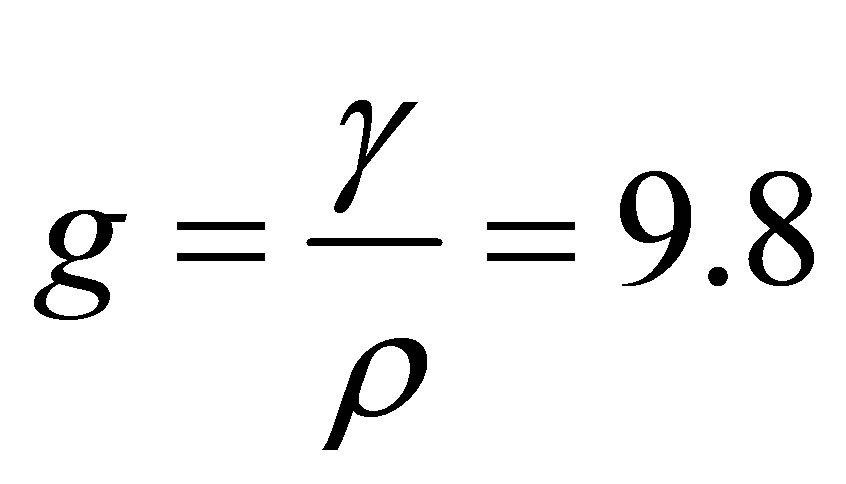 m.s2. γ is the unit weight of the soil and ρ is the mass density. The unit mass density relates with P-wave velocity Vp as shown in Equation (2)
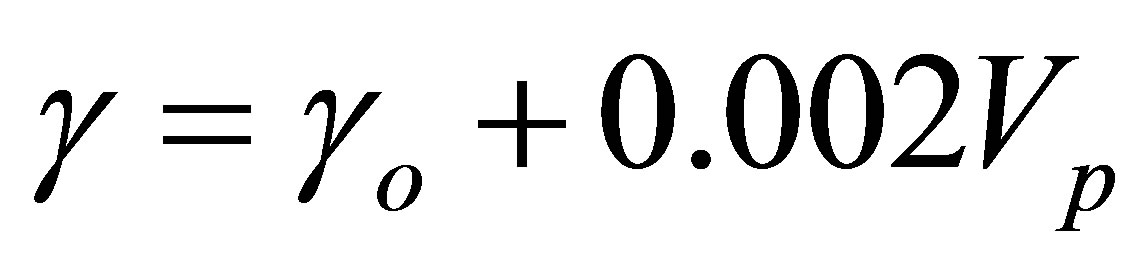 (2)
(2)
[15] defines γo as the reference unit weight value in KN/m3.γo = 16 for loose, sandy and clayey soil. According to [22], some elastic parameters were defined in Equations (3)-(9):
2) Young’s modulus/modulus of elasticity (E)
 (3)
(3)
µ is shear modulus and σ is the Poisson’s ratio.
3) Oedometric modulus (Ec) given by Equation (4)
 (4)
(4)
E is modulus of elasticity 4) Bulk modulus (K) is expressed in Equation (5) as
 (5)
(5)
5) Poisson’s ratio (σ) is given as in Equation (6) as
 (6)
(6)
Where 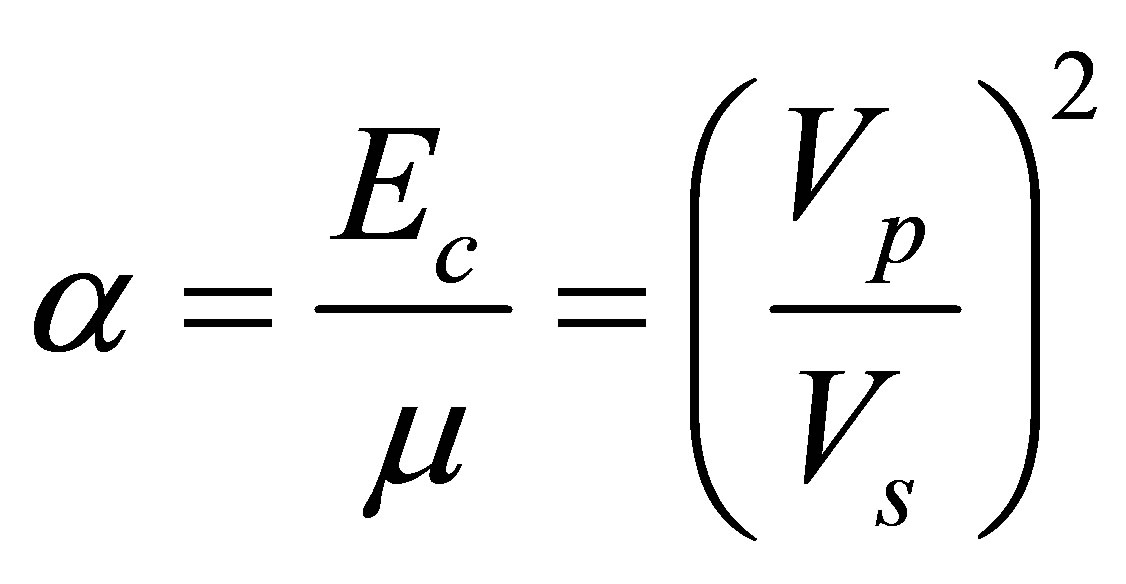 (7)
(7)
6) Subgrade Coefficient (Ks), ultimate bearing capacity qf and allowable bearing pressure are given by Equations (8)-(10) according [23,24] as,
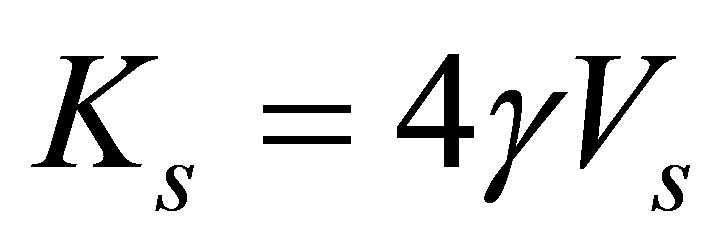 (8)
(8)
7) Ultimate Failure [Ultimate Bearing Capacity (qf)]
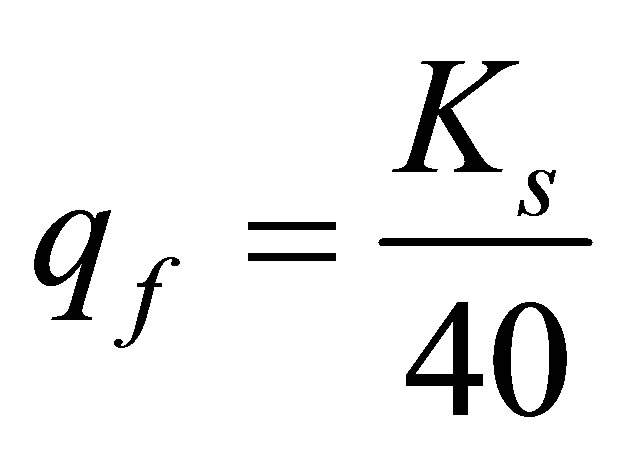 (9)
(9)
for shallow foundation [23]
8) Allowable Bearing Pressure (qa)
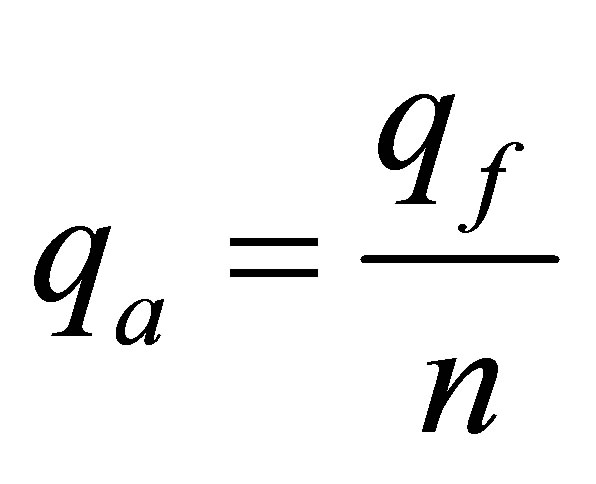 (10)
(10)
Where n is the factor of safety (n = 4.0 for soils)
What is needed in construction or foundation sites is low compressibility and compliance and high bearing capacity which can be estimated from the reciprocal values of bulk modulus (K) and Young’s modulus (E) respectively [25]. Shear modulus and shear wave velocity of the soil layer is reduced with increasing shear strain [26].
4. Material and Method of Data Analysis
The various elastic parameters were calculated using Equations (1) to (10) after a proper linear array of geophones at 5 m interval spacing connected to a seismometer which was set up to transform seismic energy generated into an electrical voltage on the surface. Other equipment used include: a sledge hammer, metal plates, electrical cables and so on. The arrival times of recorded signal (seismogram) were picked using IX Refrax and Pickwin software and plotted as T-X graph showing two velocity layers. The spread line employed was 60 m based on 5 m geophones spacing.
The decrease of shear travel time (increase of Vs) is due to the decrease of density of the formation and the absorption of deformation by free fluid/gas in pores [26] S-wave is unable to propagate through a fluid or gas because fluid/gases cannot transmit shear stress. The increase of compressional travel time (decrease of Vp) is due to the decrease of the bulk modulus of reservoir rocks which compensate for the decrease of rock density. Low values correspond to wave speed in loose, unconsolidated sediment (Vp/Vs say 1.5672 and 1.5631).
In an isotropic solid including single crystals and fibrous composites, physical properties, including Poisson’s ratio depend on direction. Poisson’s ratio can have positive or negative values of arbitrarily large magnitude in an isotropic material [24]. The region where negative Poisson’s ratio is possible is due to anisotropy. Considering σ of 0.2391, the reason for positive value is that inter-atomic bonds realign with deformation. For a material to be stable, the stiffness must be positive. Bulk modulus and shear modulus stiffnesses are interrelated by formulae which incorporate Poisson’s ratio and object constrained at the surface can have Poisson’s ratio outside −1 to 0.5 and be stable. However, Poisson’s ratio of a stable, isotropic, linear elastic material cannot be less than −0.1 or greater than 0.5 for Young’s modulus, Shear modulus and Bulk modulus to be positive [27].
5. Results and Discussion
Equations (1)-(8) have been used to establish the interrelationships between physical properties and the elastic properties and the relationships among the elastic properties. These relationships finally lead to the determination of ultimate bearing capacity and allowable bearing capacity shown in Equations (9) and (10). Table 1 shows the computations of the parameters. Allowable bearing pressure (qa), computed in Table 1 has been the major aim of this article. We are interested in the span of distribution of allowable bearing pressure for shallow foundation which between layers one and two because of the extant foundation challenging risk associated with the study area. The dependence of allowable pressure with elastic parameter has been envisaged through the plots of allowable pressure qa and shear modulus µ for the foundation layers 1 and 2 as shown in Figures 2(a) and (b). Since the coefficient of subgrrade ks depends on Vs and qf depends on the qa, graphs of qa against Vs for the first and second layers have also been drawn to see their relationships as shown in Figures 3(a) and (b). From Figures 2(a) and (b), allowable bearing capacity is plotted in each case against the shear modulus for the first and second layers respectively. In layer one, a quadratic function in Equation (11) results while in layer 2, the function approximates to liner function in Equation (13).
 (11)
(11)
 (12)
(12)
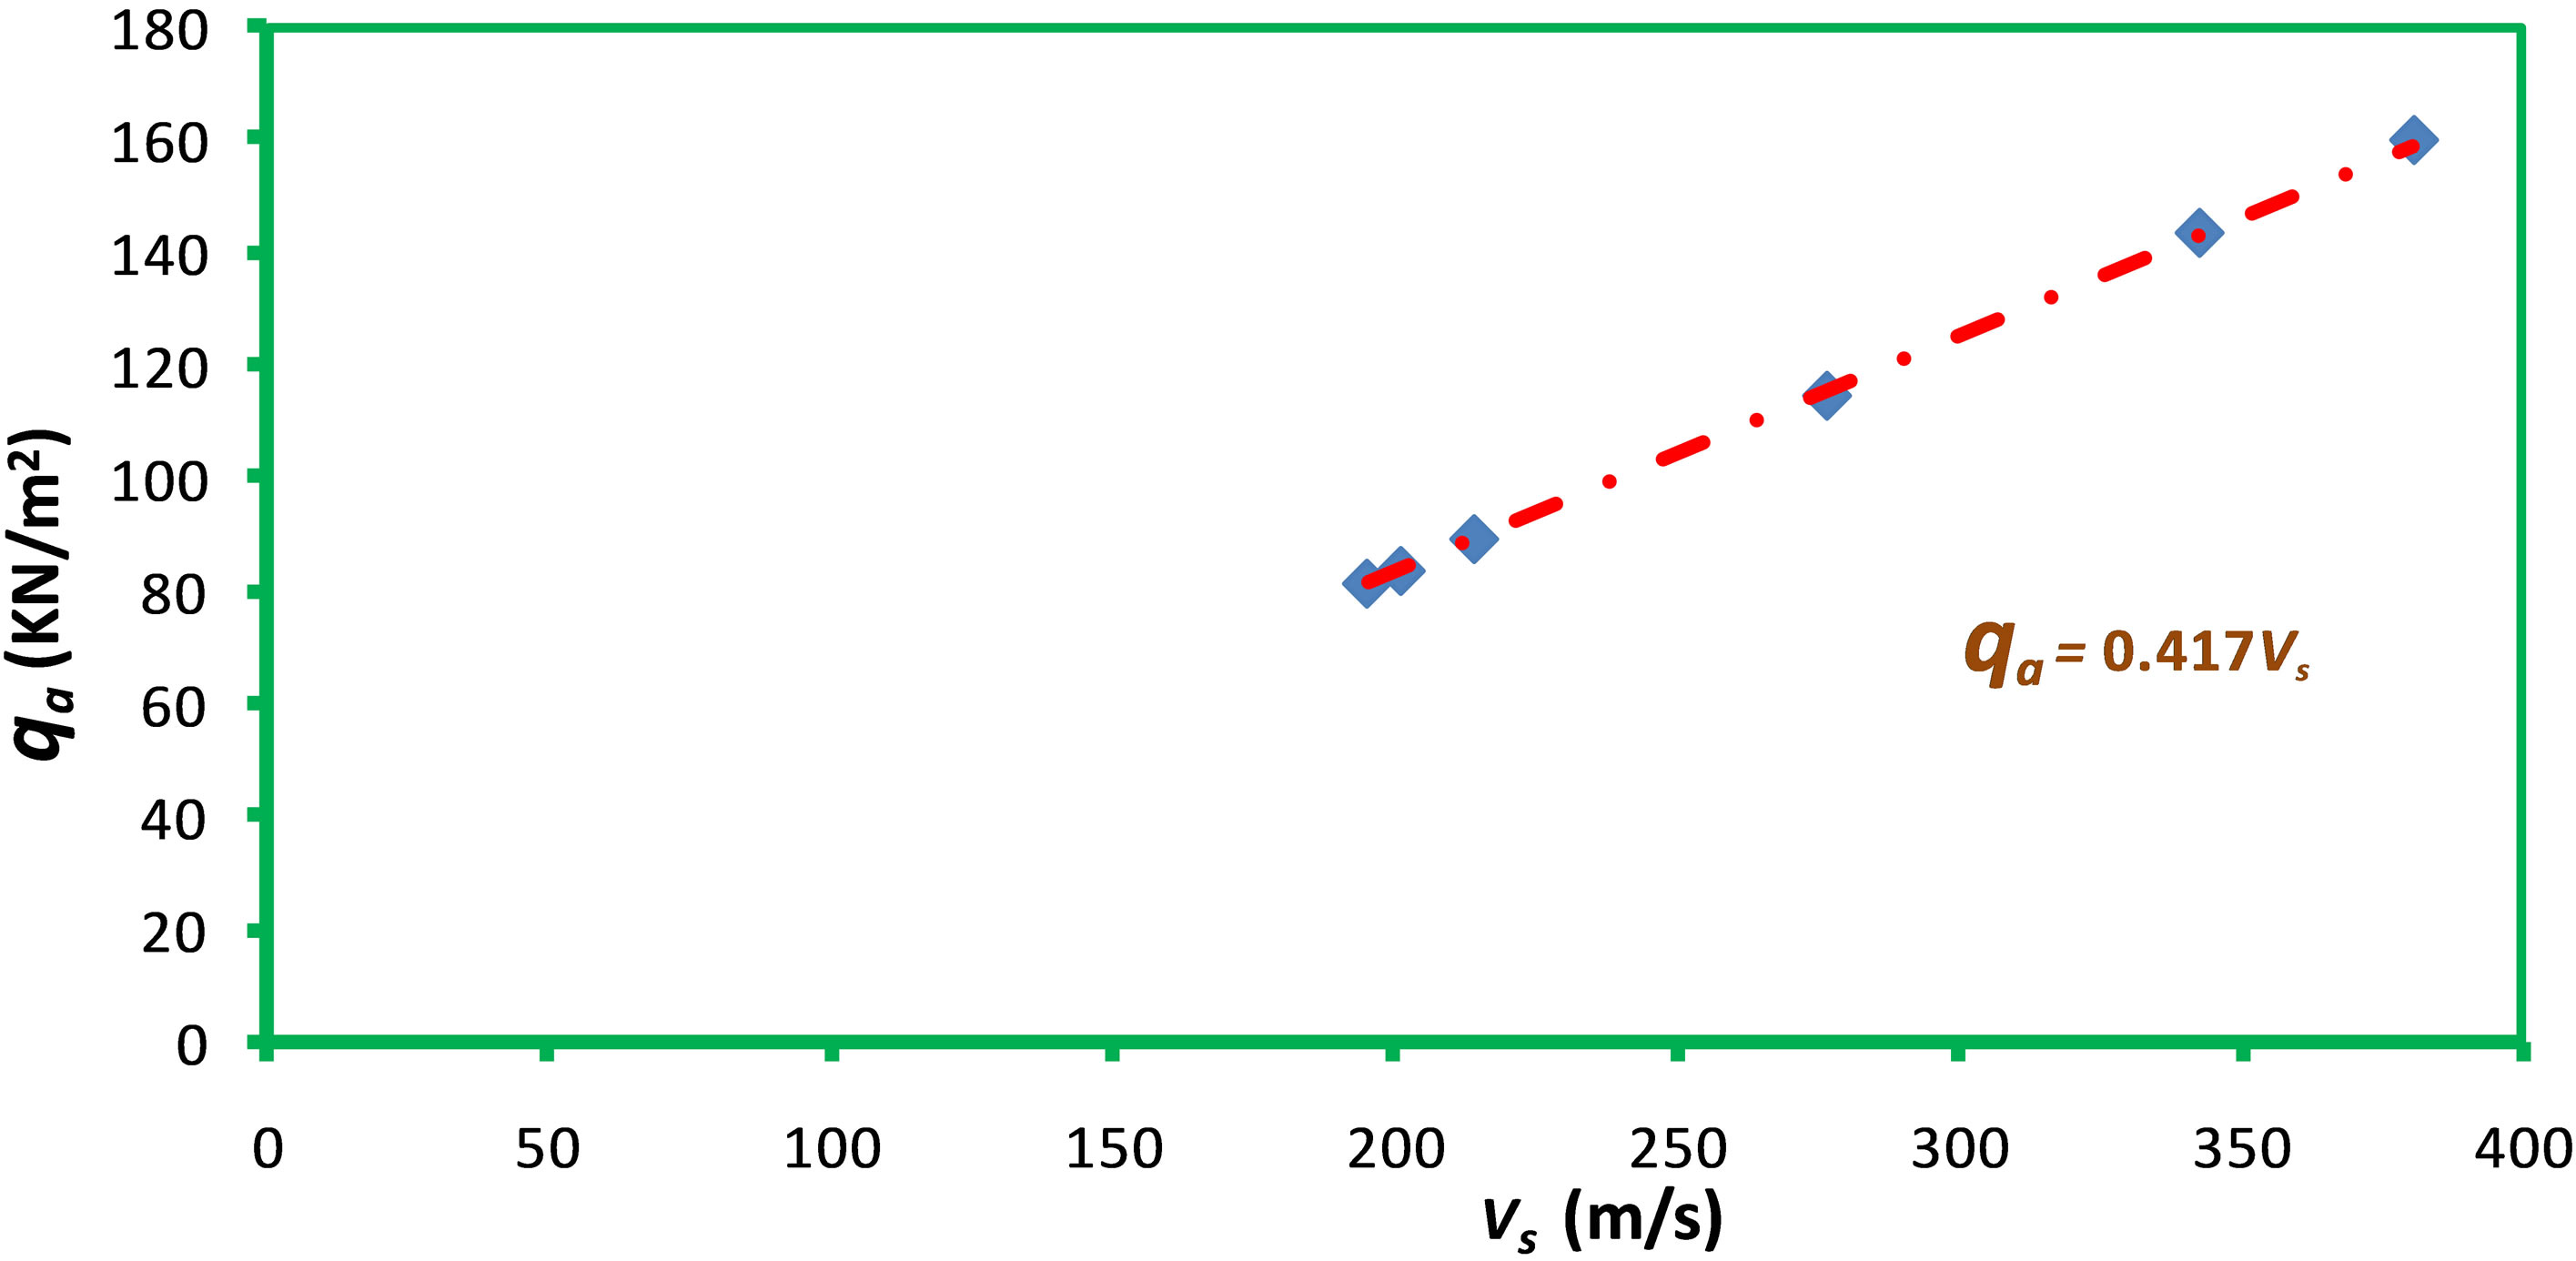
The slopes in the above equations are dimensionless constants which give the coefficients of elastic deformability of shallow foundation geomaterial caused by the load imposed on the considered shallow foundations. From Equation (11), layer 1 is more relatively susceptible to deformation than layer 2 based on the magnitude of the deformation constants of layer 1. As the constant increases, the degree of elastic deformation increases. Therefore, layer 1 with 1.46 × 10⁻² elastic deformation constant is more liable to deformation than layer 2 with 4.00 × 10⁻⁶ elastic deformation constant. Although consolidation of subsurface increases with depth due to compaction, other tectonically induced secondary structures like divide, fault lineament and fold within the sedimentary facies could cause voids in the subsurface thereby leading to elastic deformation of subsurface. Figures 3(a) and (b) also show linear empirical relationships between the allowable bearing capacity and the shear wave velocity. This is demonstrated in Equations (13) and (14) for layers 1 and 2 shown below respectively;
Table 1. Summary of seismic and elastic parameters in the study area.
 (a)
(a)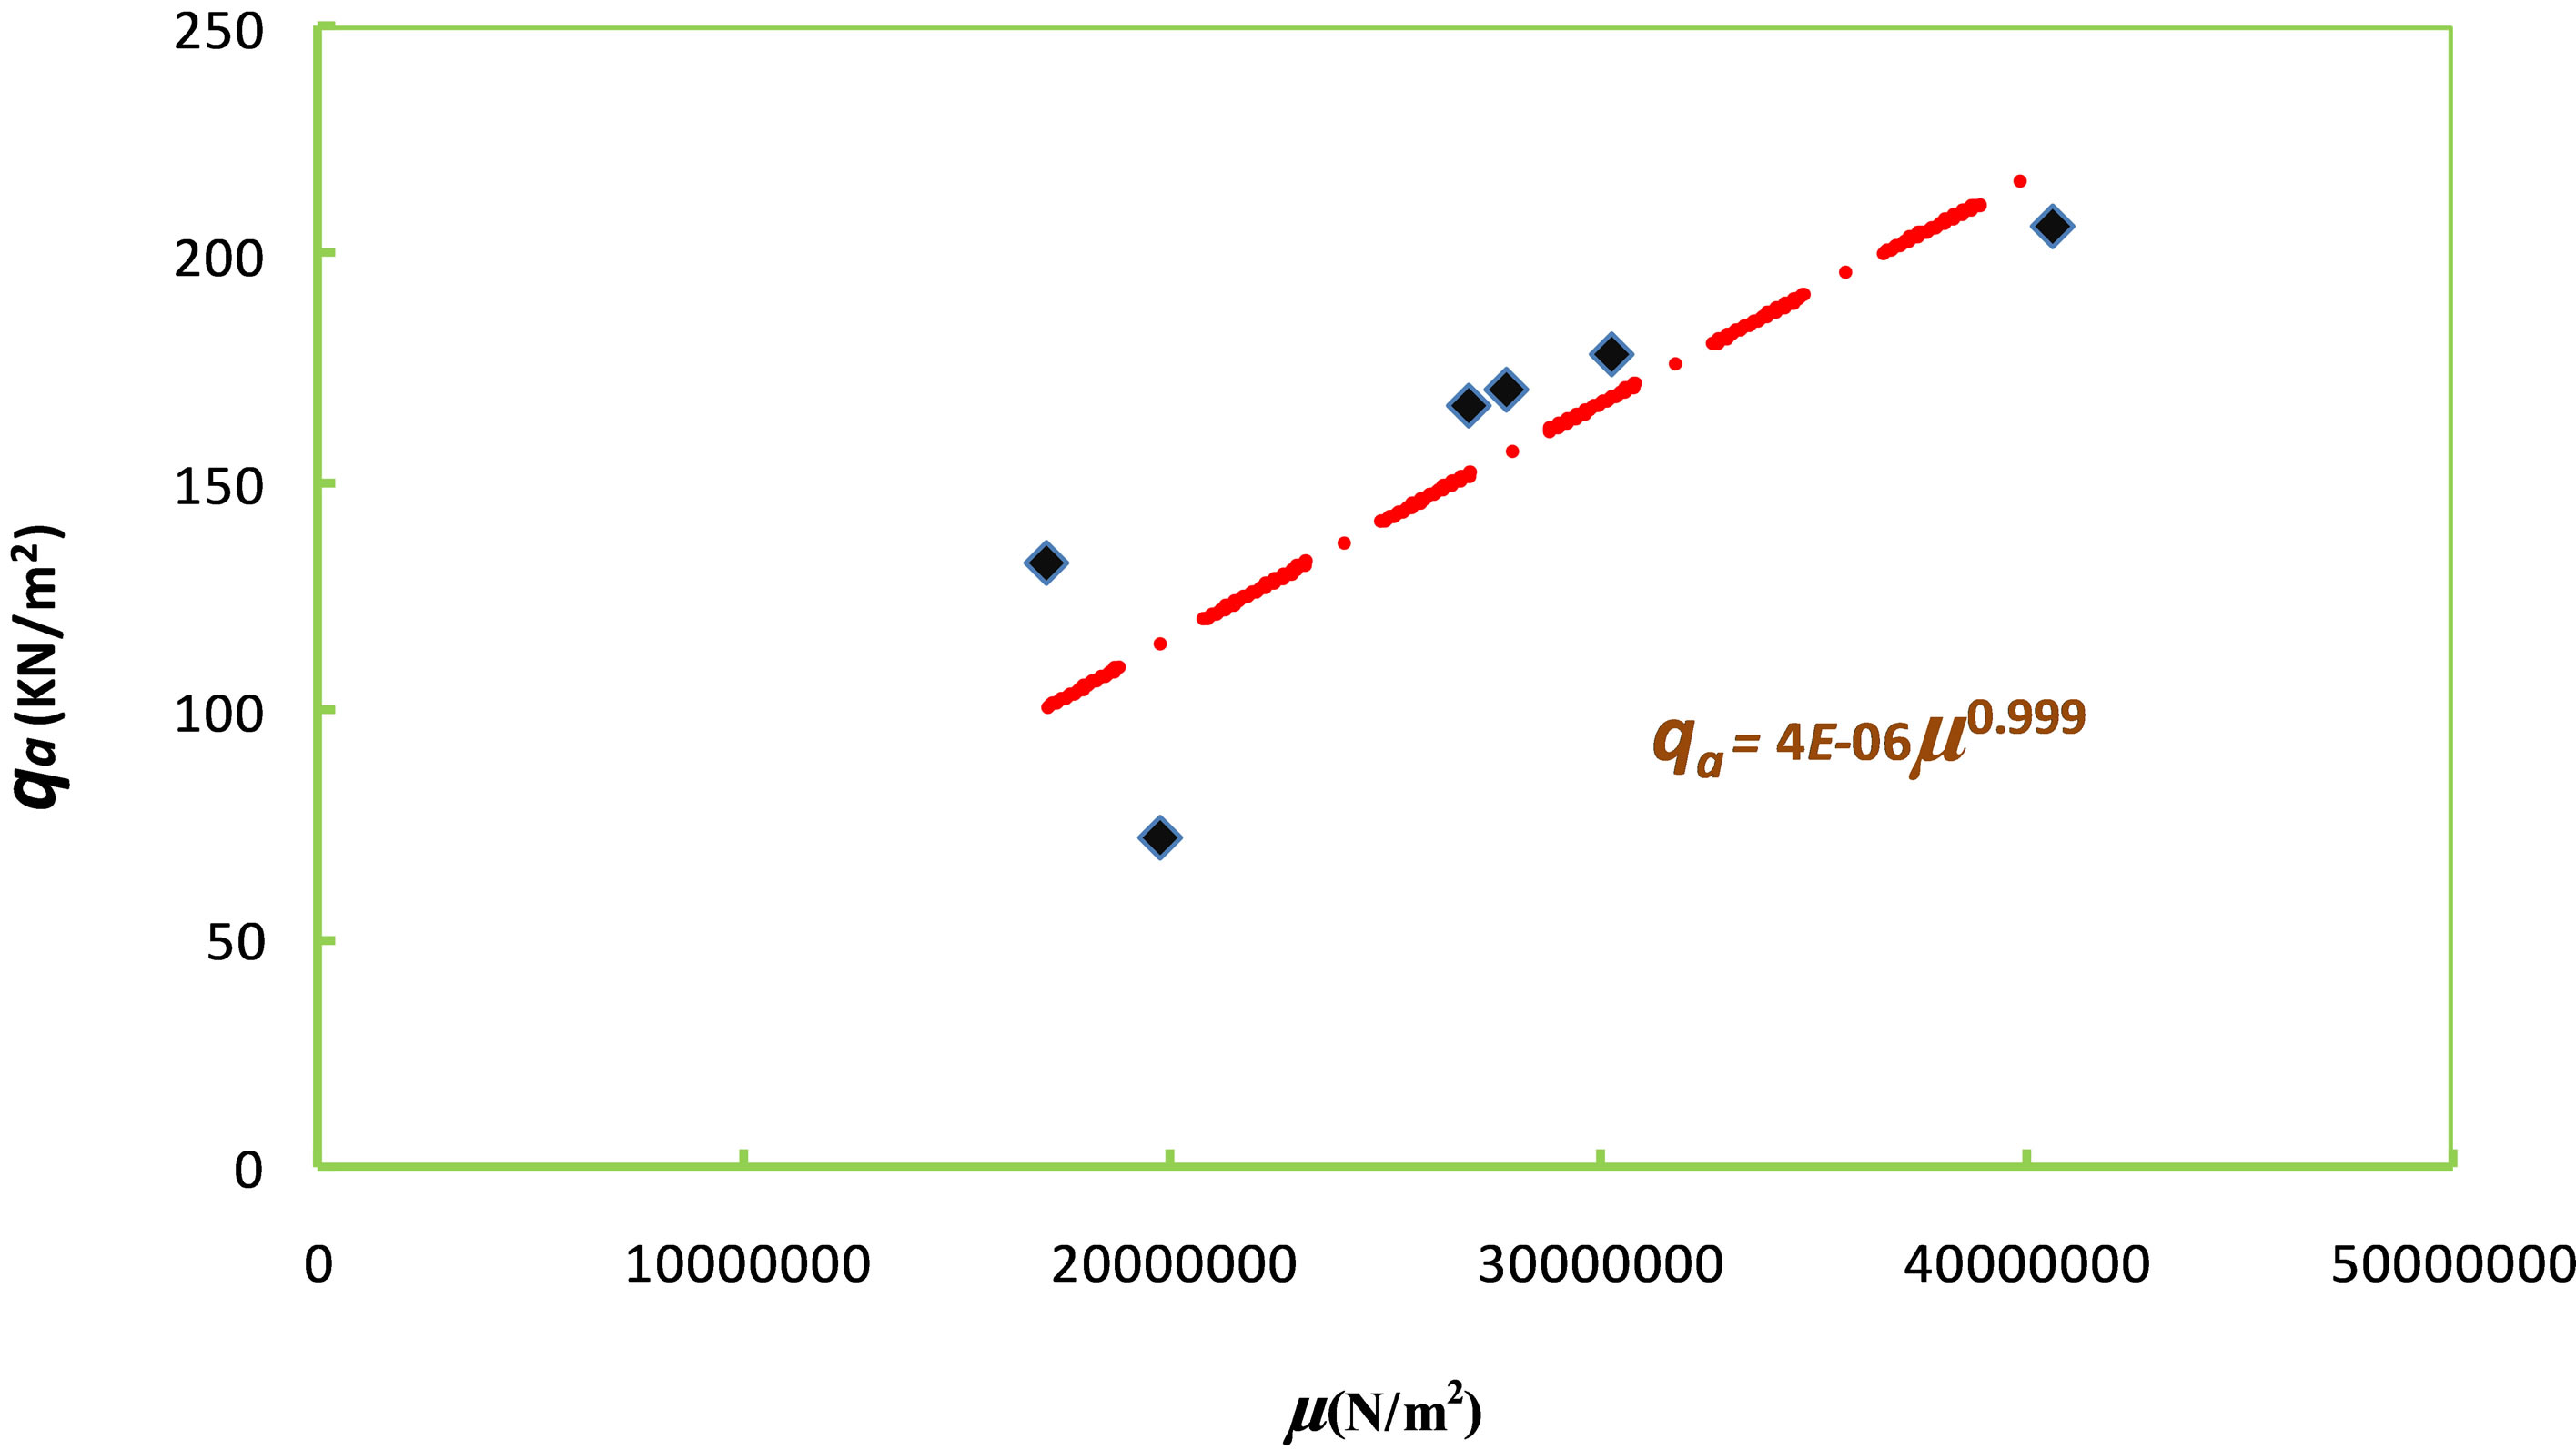 (b)
(b)
Figure 2. (a) A plot of allowable bearing capacity against shear modulus for the first layer; (b) A plot of allowable bearing capacity against shear modulus for the second layer.
 (13)
(13)
 (14)
(14)
The two layers show linear relationship between qa and Vs. The slope reflecting the impulse/driving force producing the deformability of a layer per cubic meter of the foundation layer is 0.417 Ns∙m−3 and 0.4004 Ns∙m−3 for layer 1 and 2 respectively. The variation in the slope between the first and second layers considered indicates that layer 1 is 0.0166 Ns∙m−3 greater than layer 2. This difference is about 4% of the slopes (impulse per cubic meter) in layers 1 and 2 and it suggests that there is no significant difference between layers 1 and 2 in terms of variability between allowable pressure/capacity and shear wave velocity. However, the significant alteration noticed in the slope of the relation between allowable pressure and shear modulus may be due to layer facies change, uneven saturation in the shallow foundation layers and changes in unit weight of the soil (γ) determined by the p-wave velocity. The unit weight of the soil layer also determines the shear modulus and S-wave velocity in Equation (1) constitutes the significant variation noticed in layers 1 and 2 in the relation between allowable bearing capacity (qa) and shear modulus (µ). Pronounced outliers noticed in the plot between allowable bearing capacity and shear modulus, and the plot between the allowable bearing capacity and the shear wave velocity of layer 2 in Figures 2(b) and 3(b) are due to hiatus and the associated unconformities in the shallow foundation.
The pictorial distribution of the allowable and ultimate bearing capacities for layers 1 and 2 are respectively shown in Figures 4(a), (b) and 5(a), (b) using. These
 (a)
(a)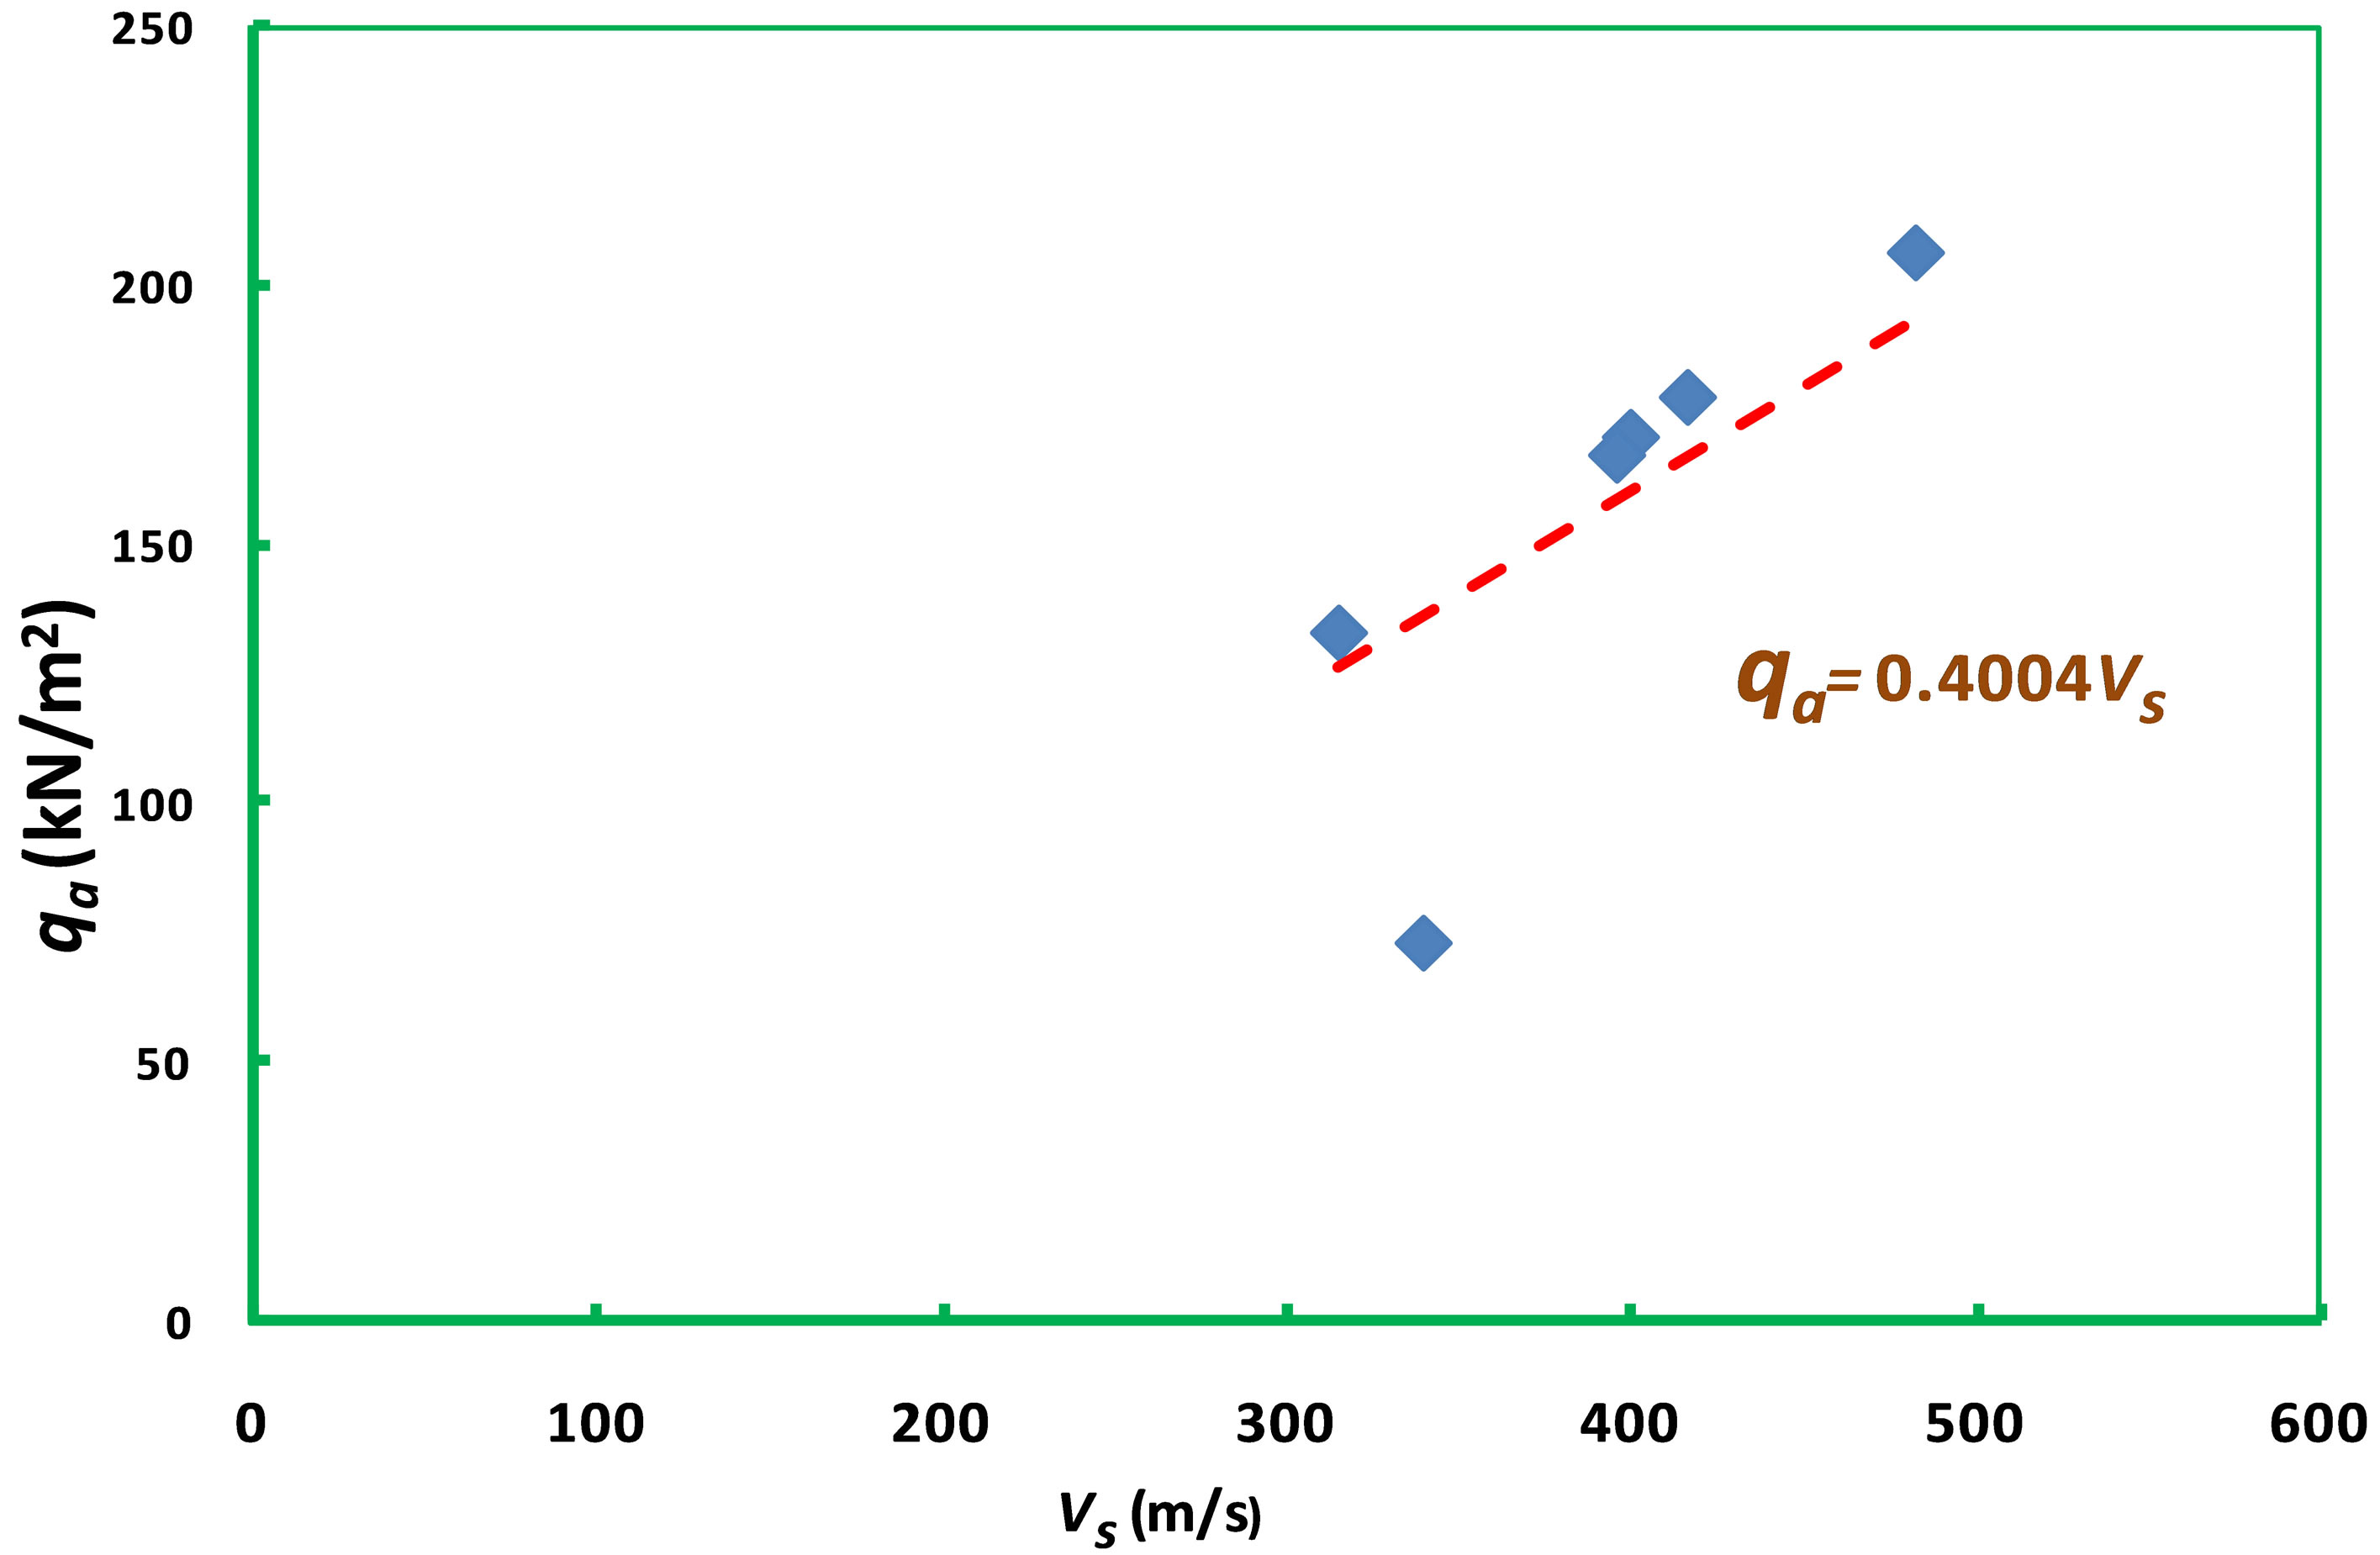 (b)
(b)
Figure 3. (a) A plot of allowable bearing capacity against shear wave velocity for the first layer; (b) A plot of allowable bearing capacity against shear wave velocity for the first layer.
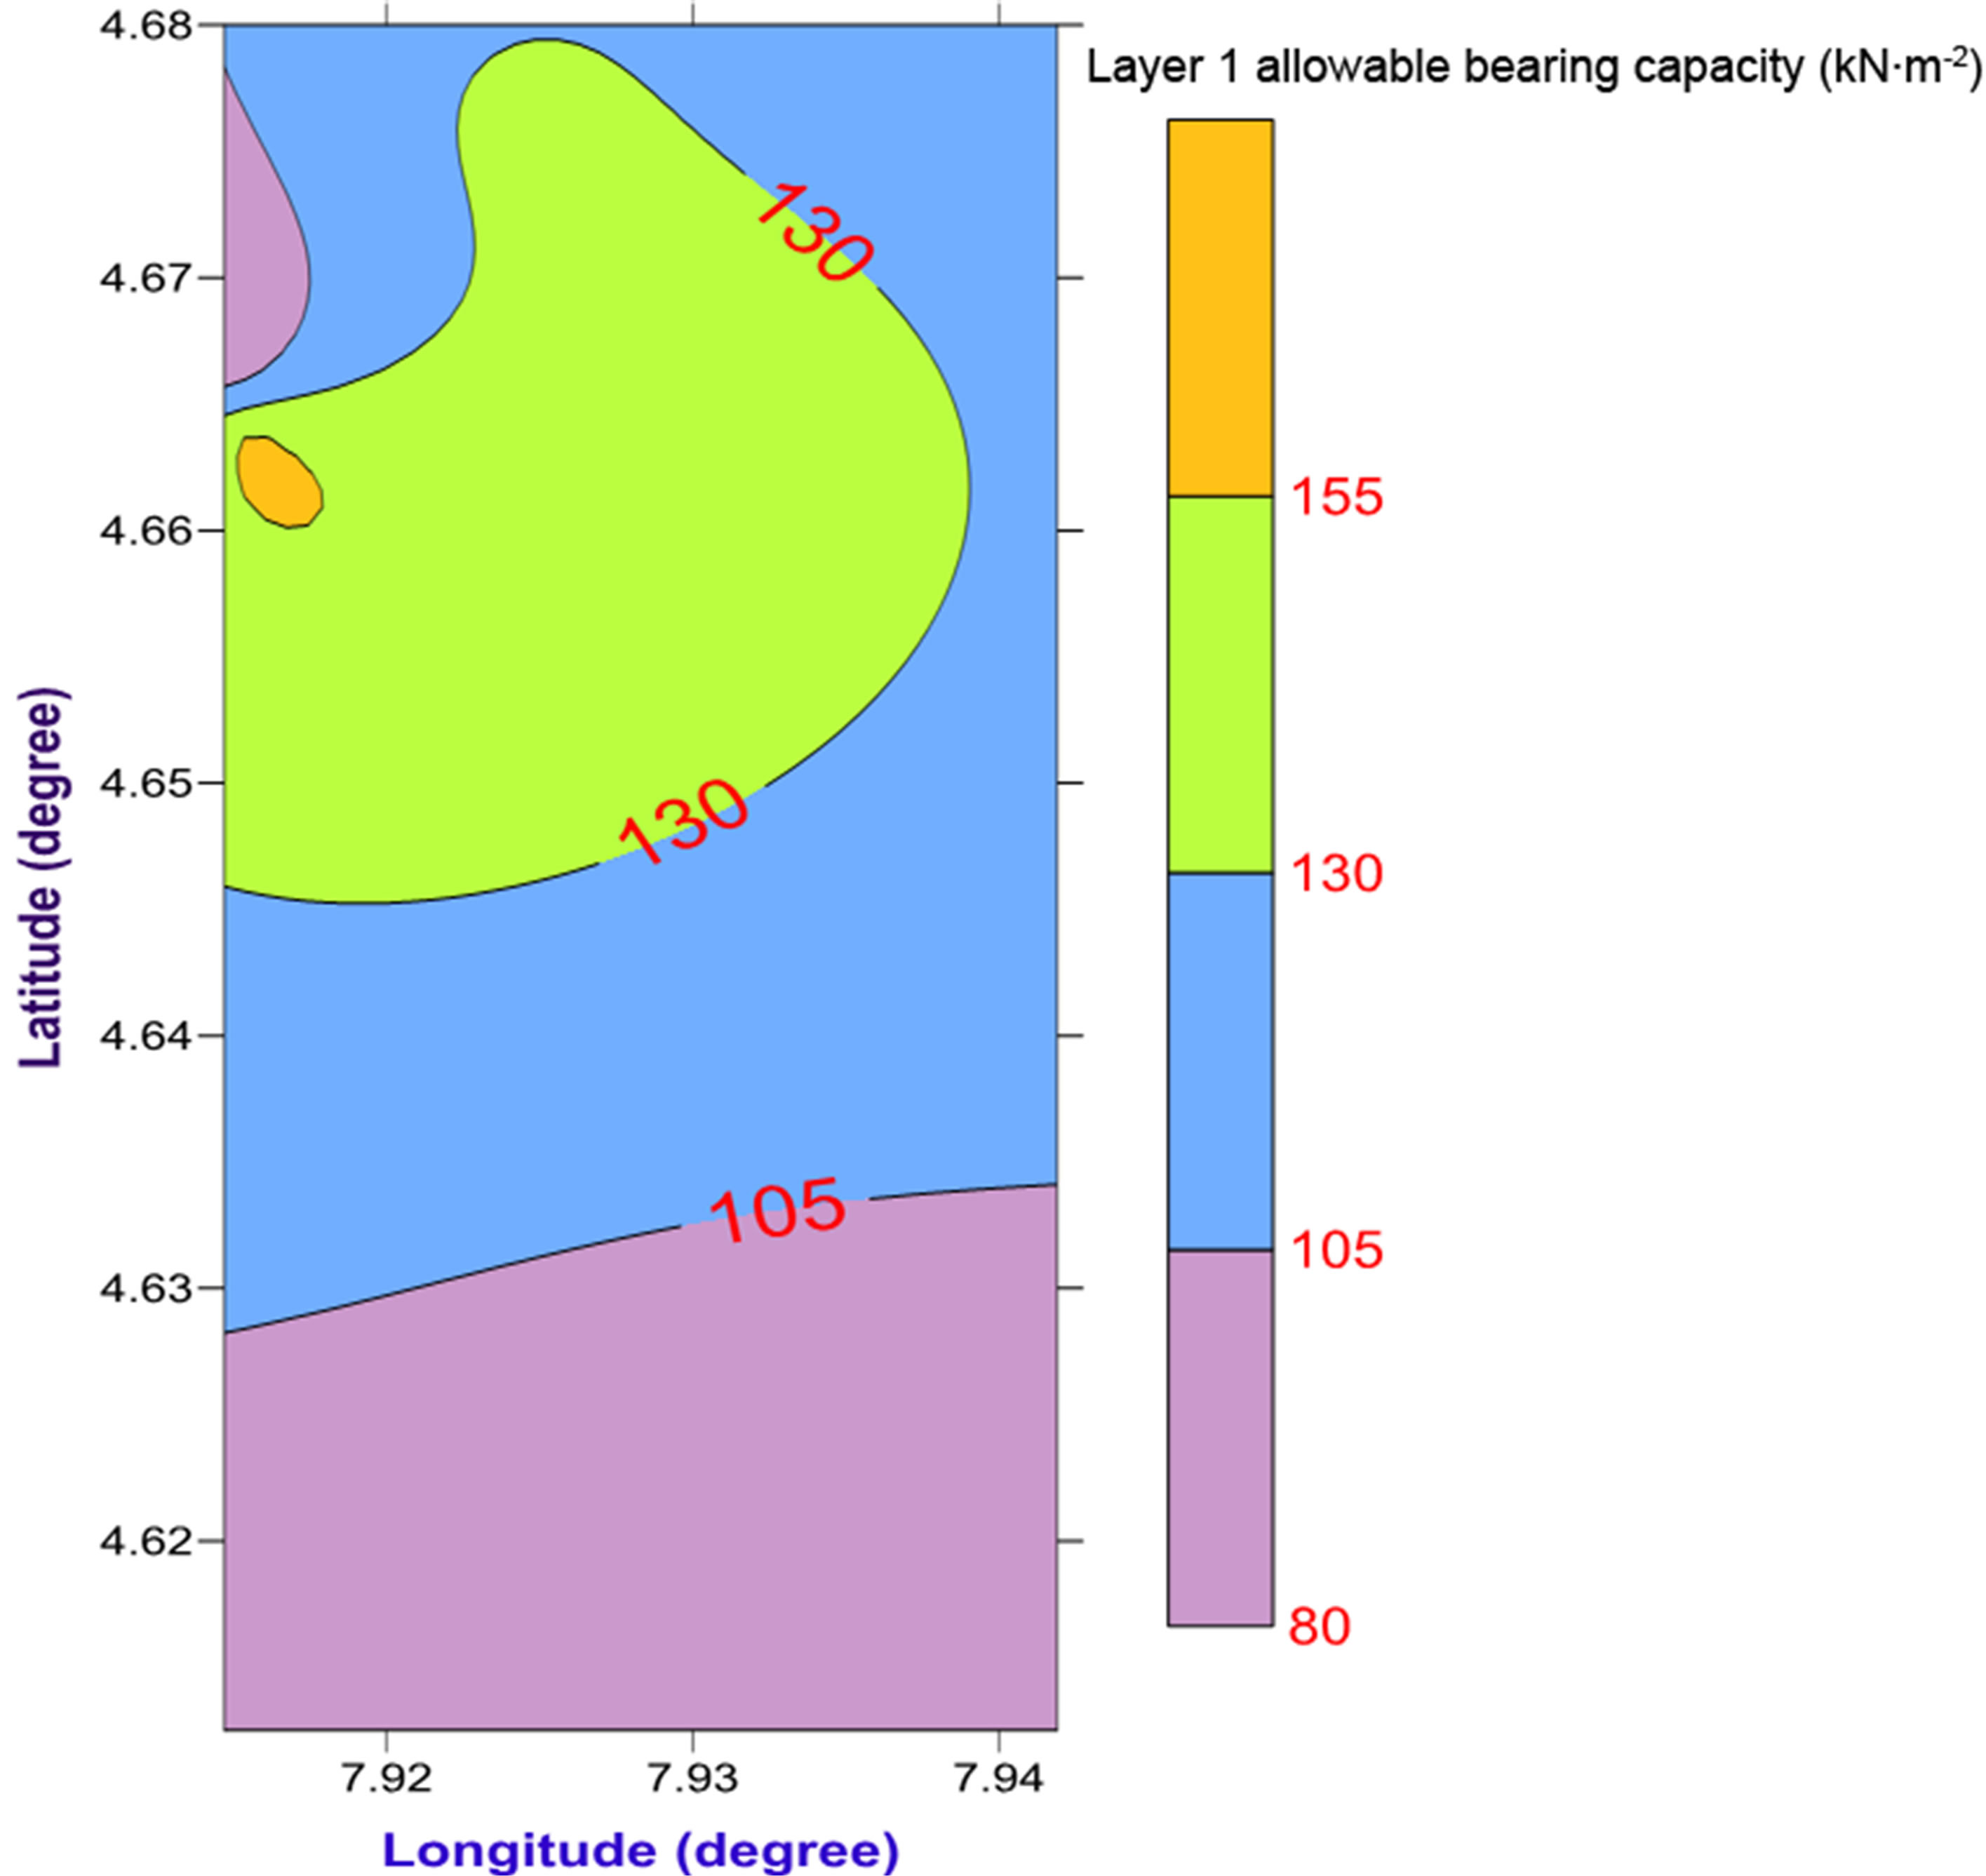
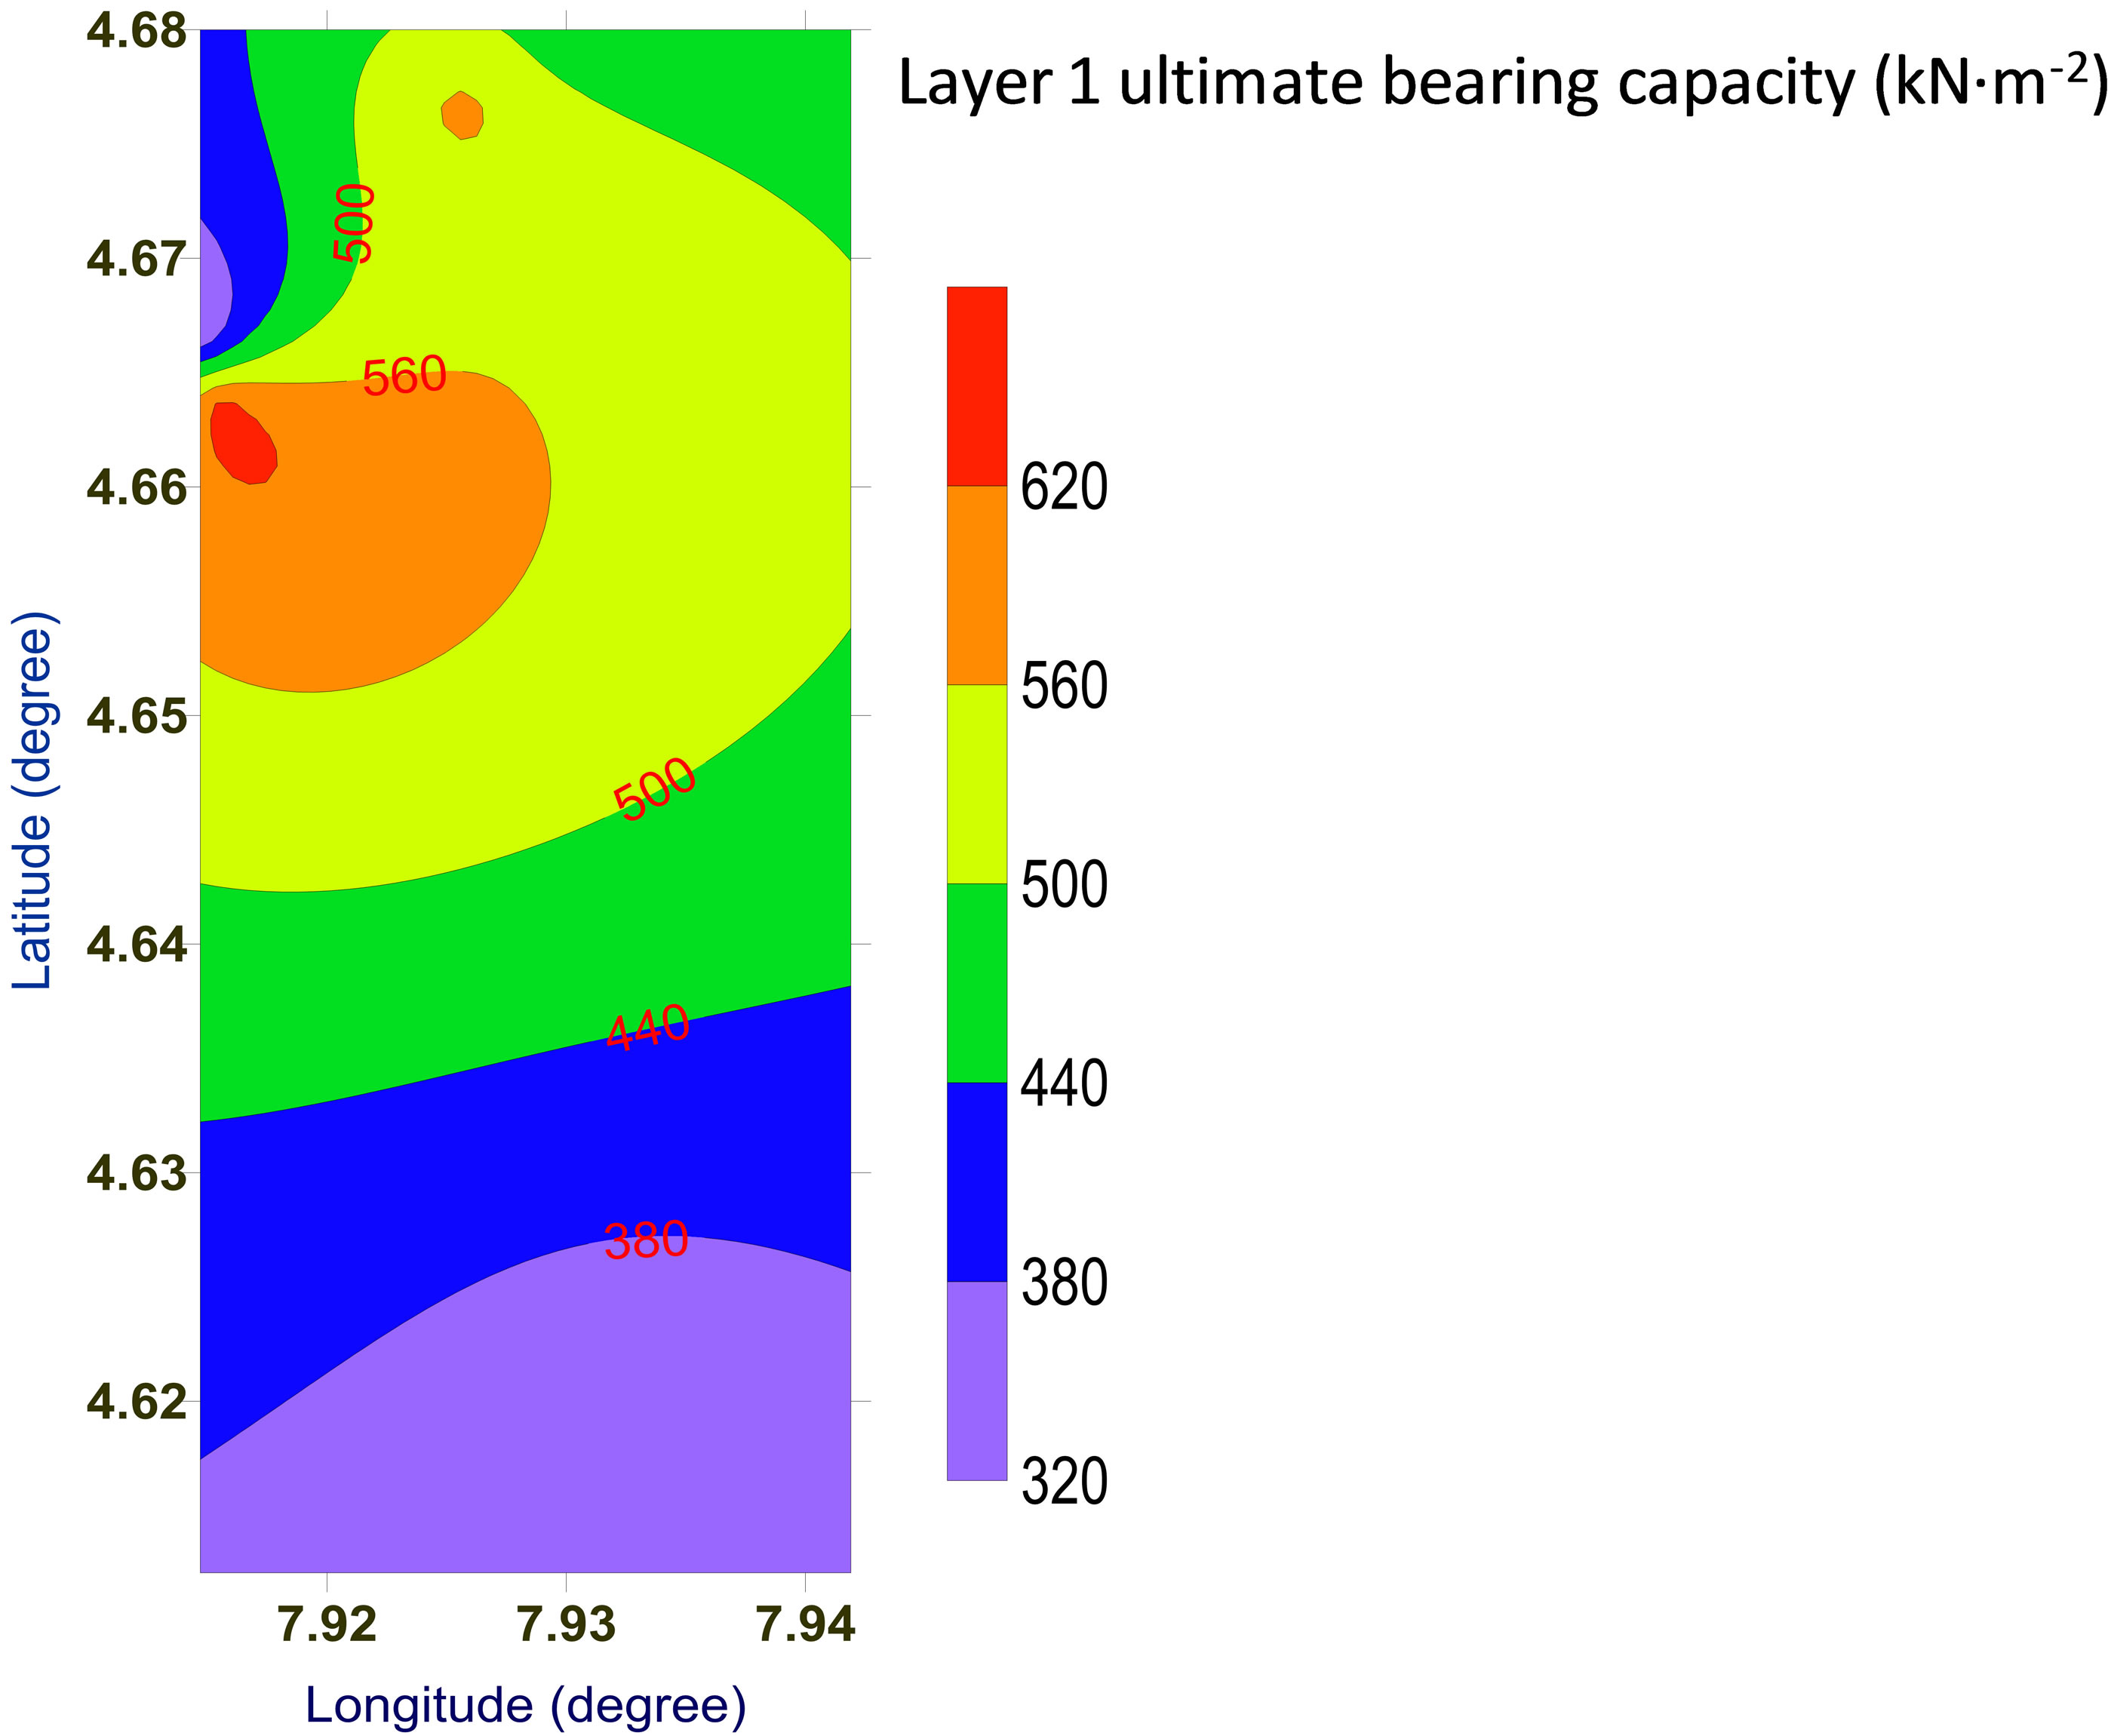
figures are presented in 2-D contour maps. The contour elevations represent the allowable bearing capacity and ultimate bearing capacity in Figures 4(a), (b) and 5(a), (b) respectively. The 2-D map in Figure 4(a) representing layer 1 shows a continuous increment in the allowable bearing capacity in a north-south trend. The highest value is seen on the map in Lat. 4.6636˚N and Long. 7.9156˚N. This trend shows that low allowable bearing capacity is associated with zones that are highly drained with water while the high bearing capacity is associated with zones that are unsaturated with water. In the second layer represented by Figure 4(b), The 2-D contour map shows a reverse in the trend of the allowable bearing capacity distribution as the trend is northeast-southwest. Noticeably, the location of high values of allowable bearing capacity in the second layer also conform to the location noticed in layer one. This observation reflects uniform consolidation between layer 1 and 2. The observed transition in magnitude of allowable bearing capacity from low to high value with depth (layer1 to layer 2) is due to cementation/compaction which increases with depth. The ultimate bearing capacity which determines the allowable bearing capacity was also contoured for layers 1 and 2 as shown in Figures 5(a) and (b). The trend of spatial distribution of ultimate bearing capacity is in analogy with the trend of spatial distribution of allowable bearing capacity see Figures 5(a) and (b). This conformity shows the uniqueness of the method used in determining the allowable bearing capacity.
The results show that the allowable bearing capacity in the study area ranges between 81.31 - 159.81 kN∙m−2 and has an average value of 111.97 kN∙m−2 for layer 1. In
 (a)
(a)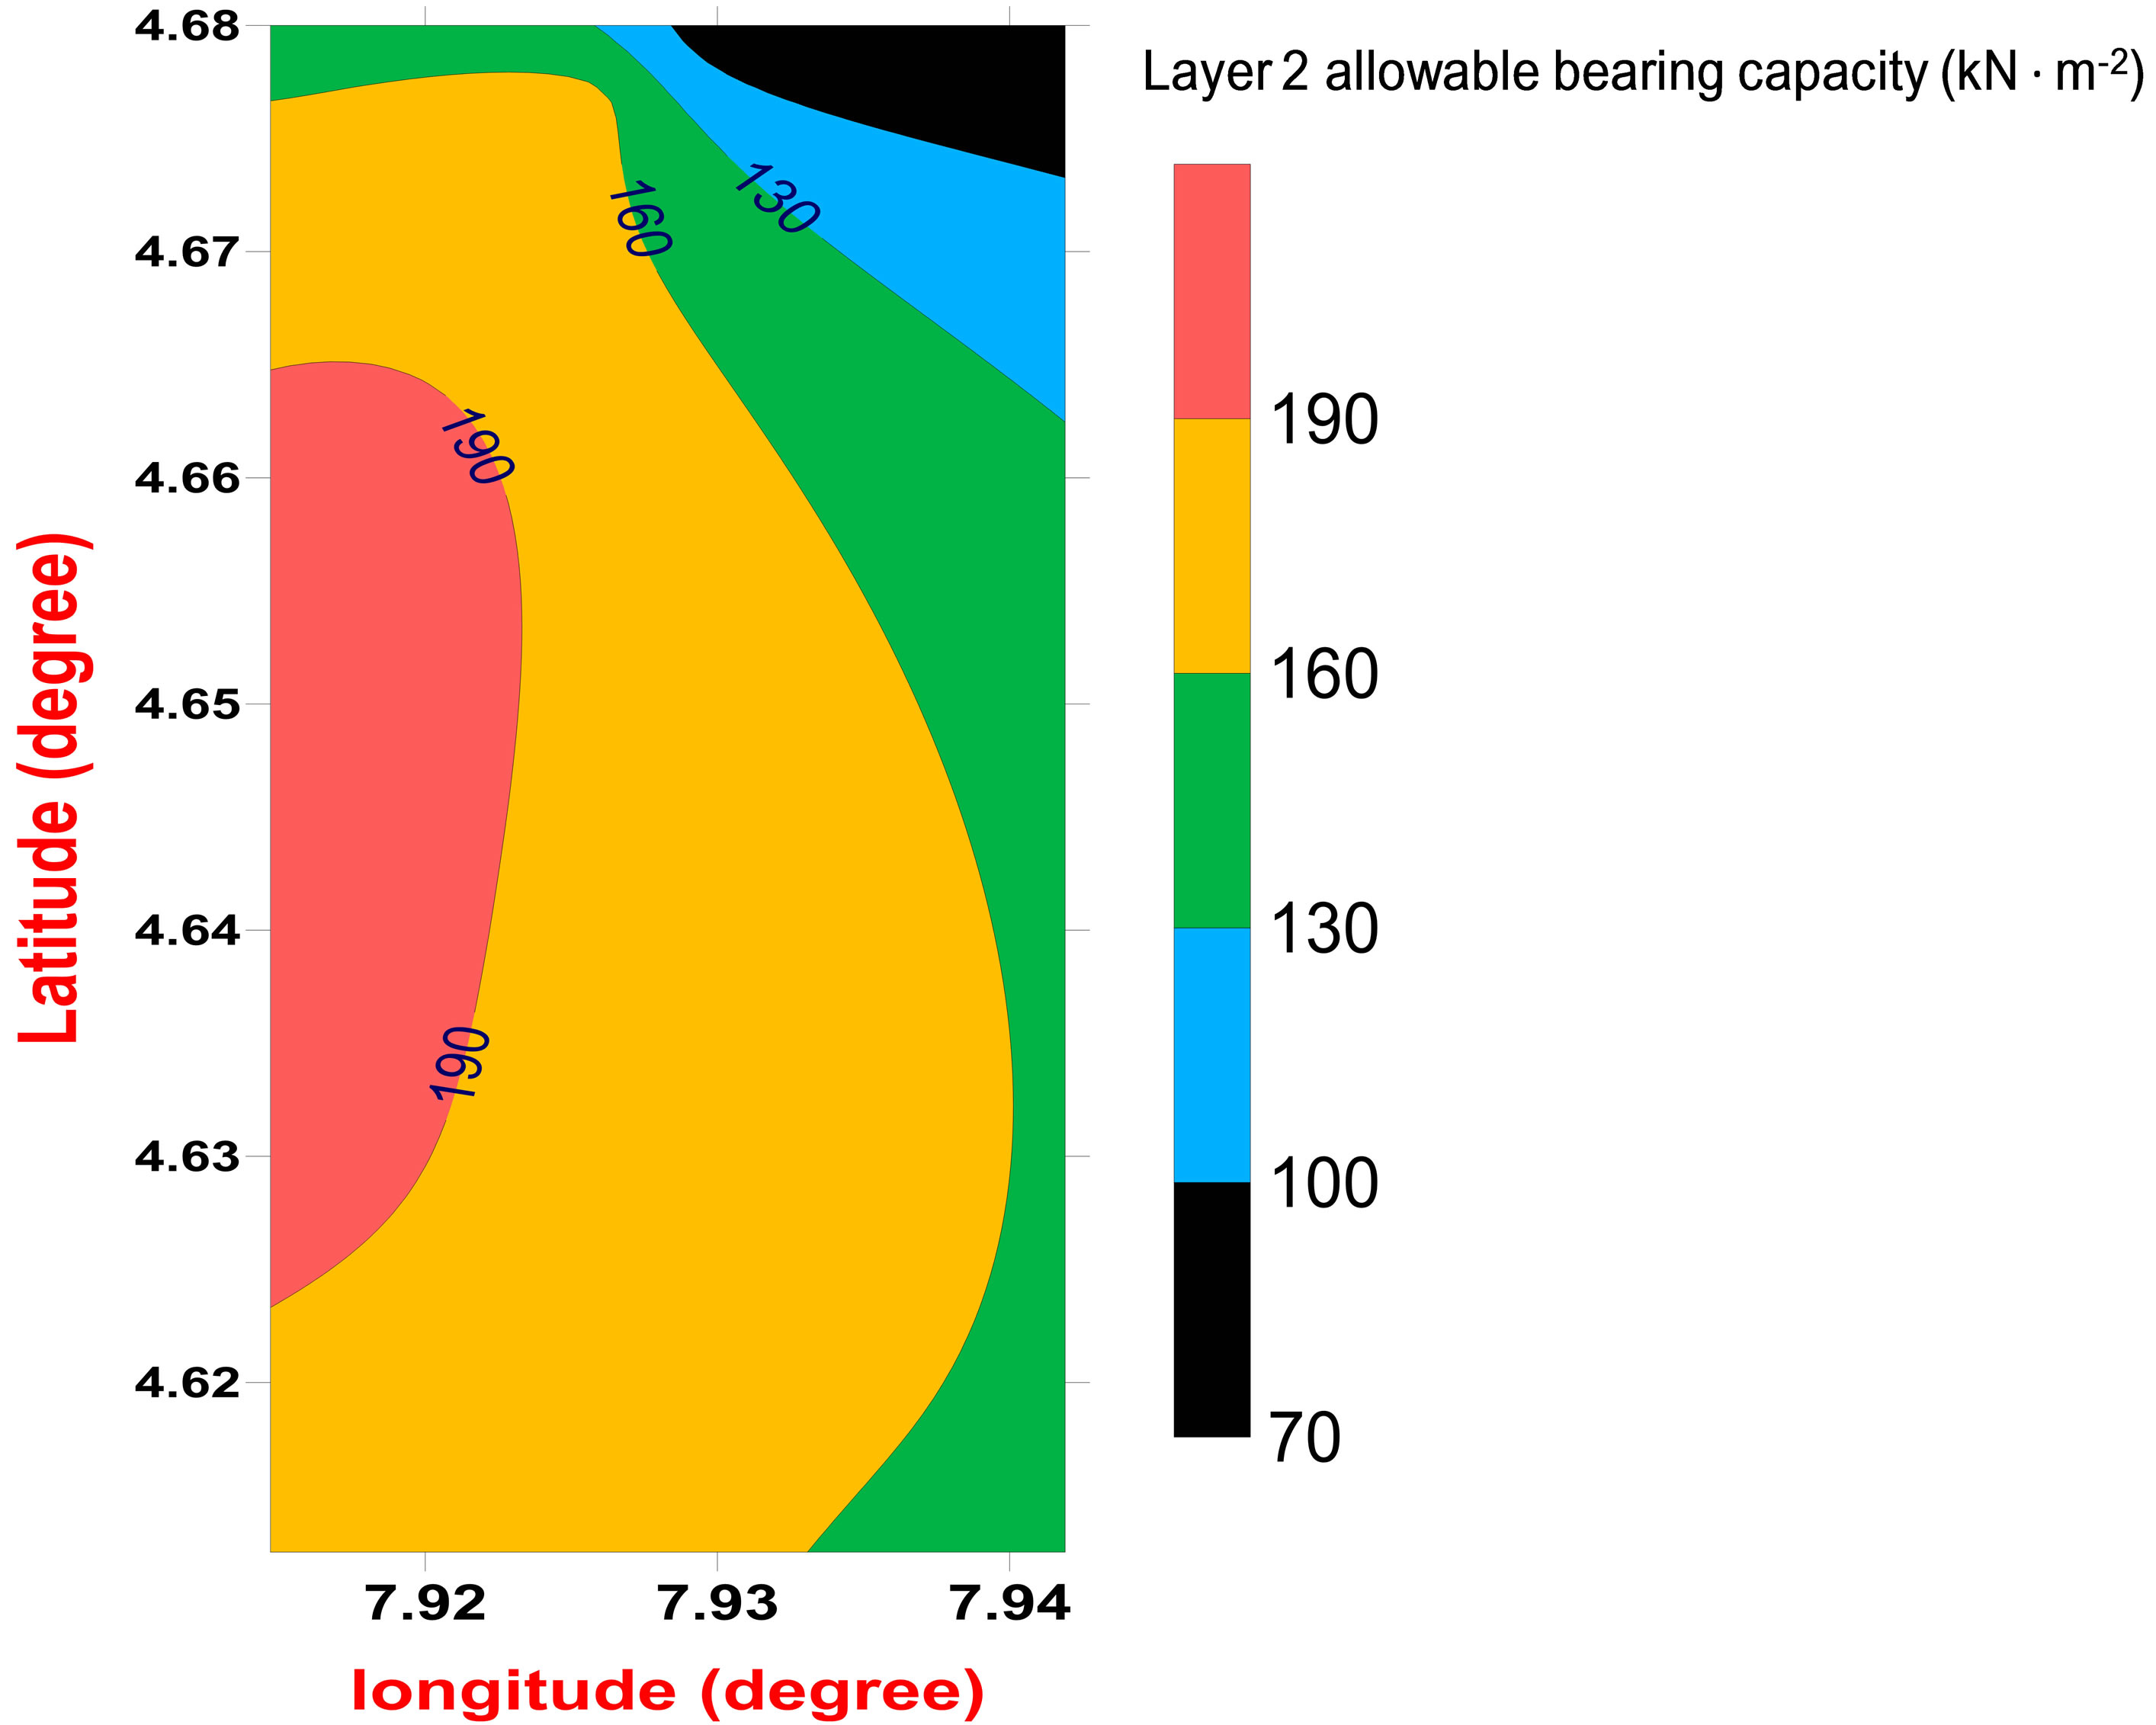 (b)
(b)
Figure 4. (a) 2-D map showing the distribution of allowable bearing pressure in layer 1 of the shallow foundation; (b) 2-D map showing the distribution of allowable bearing pressure in layer 2 of the shallow foundation.
 (a)
(a)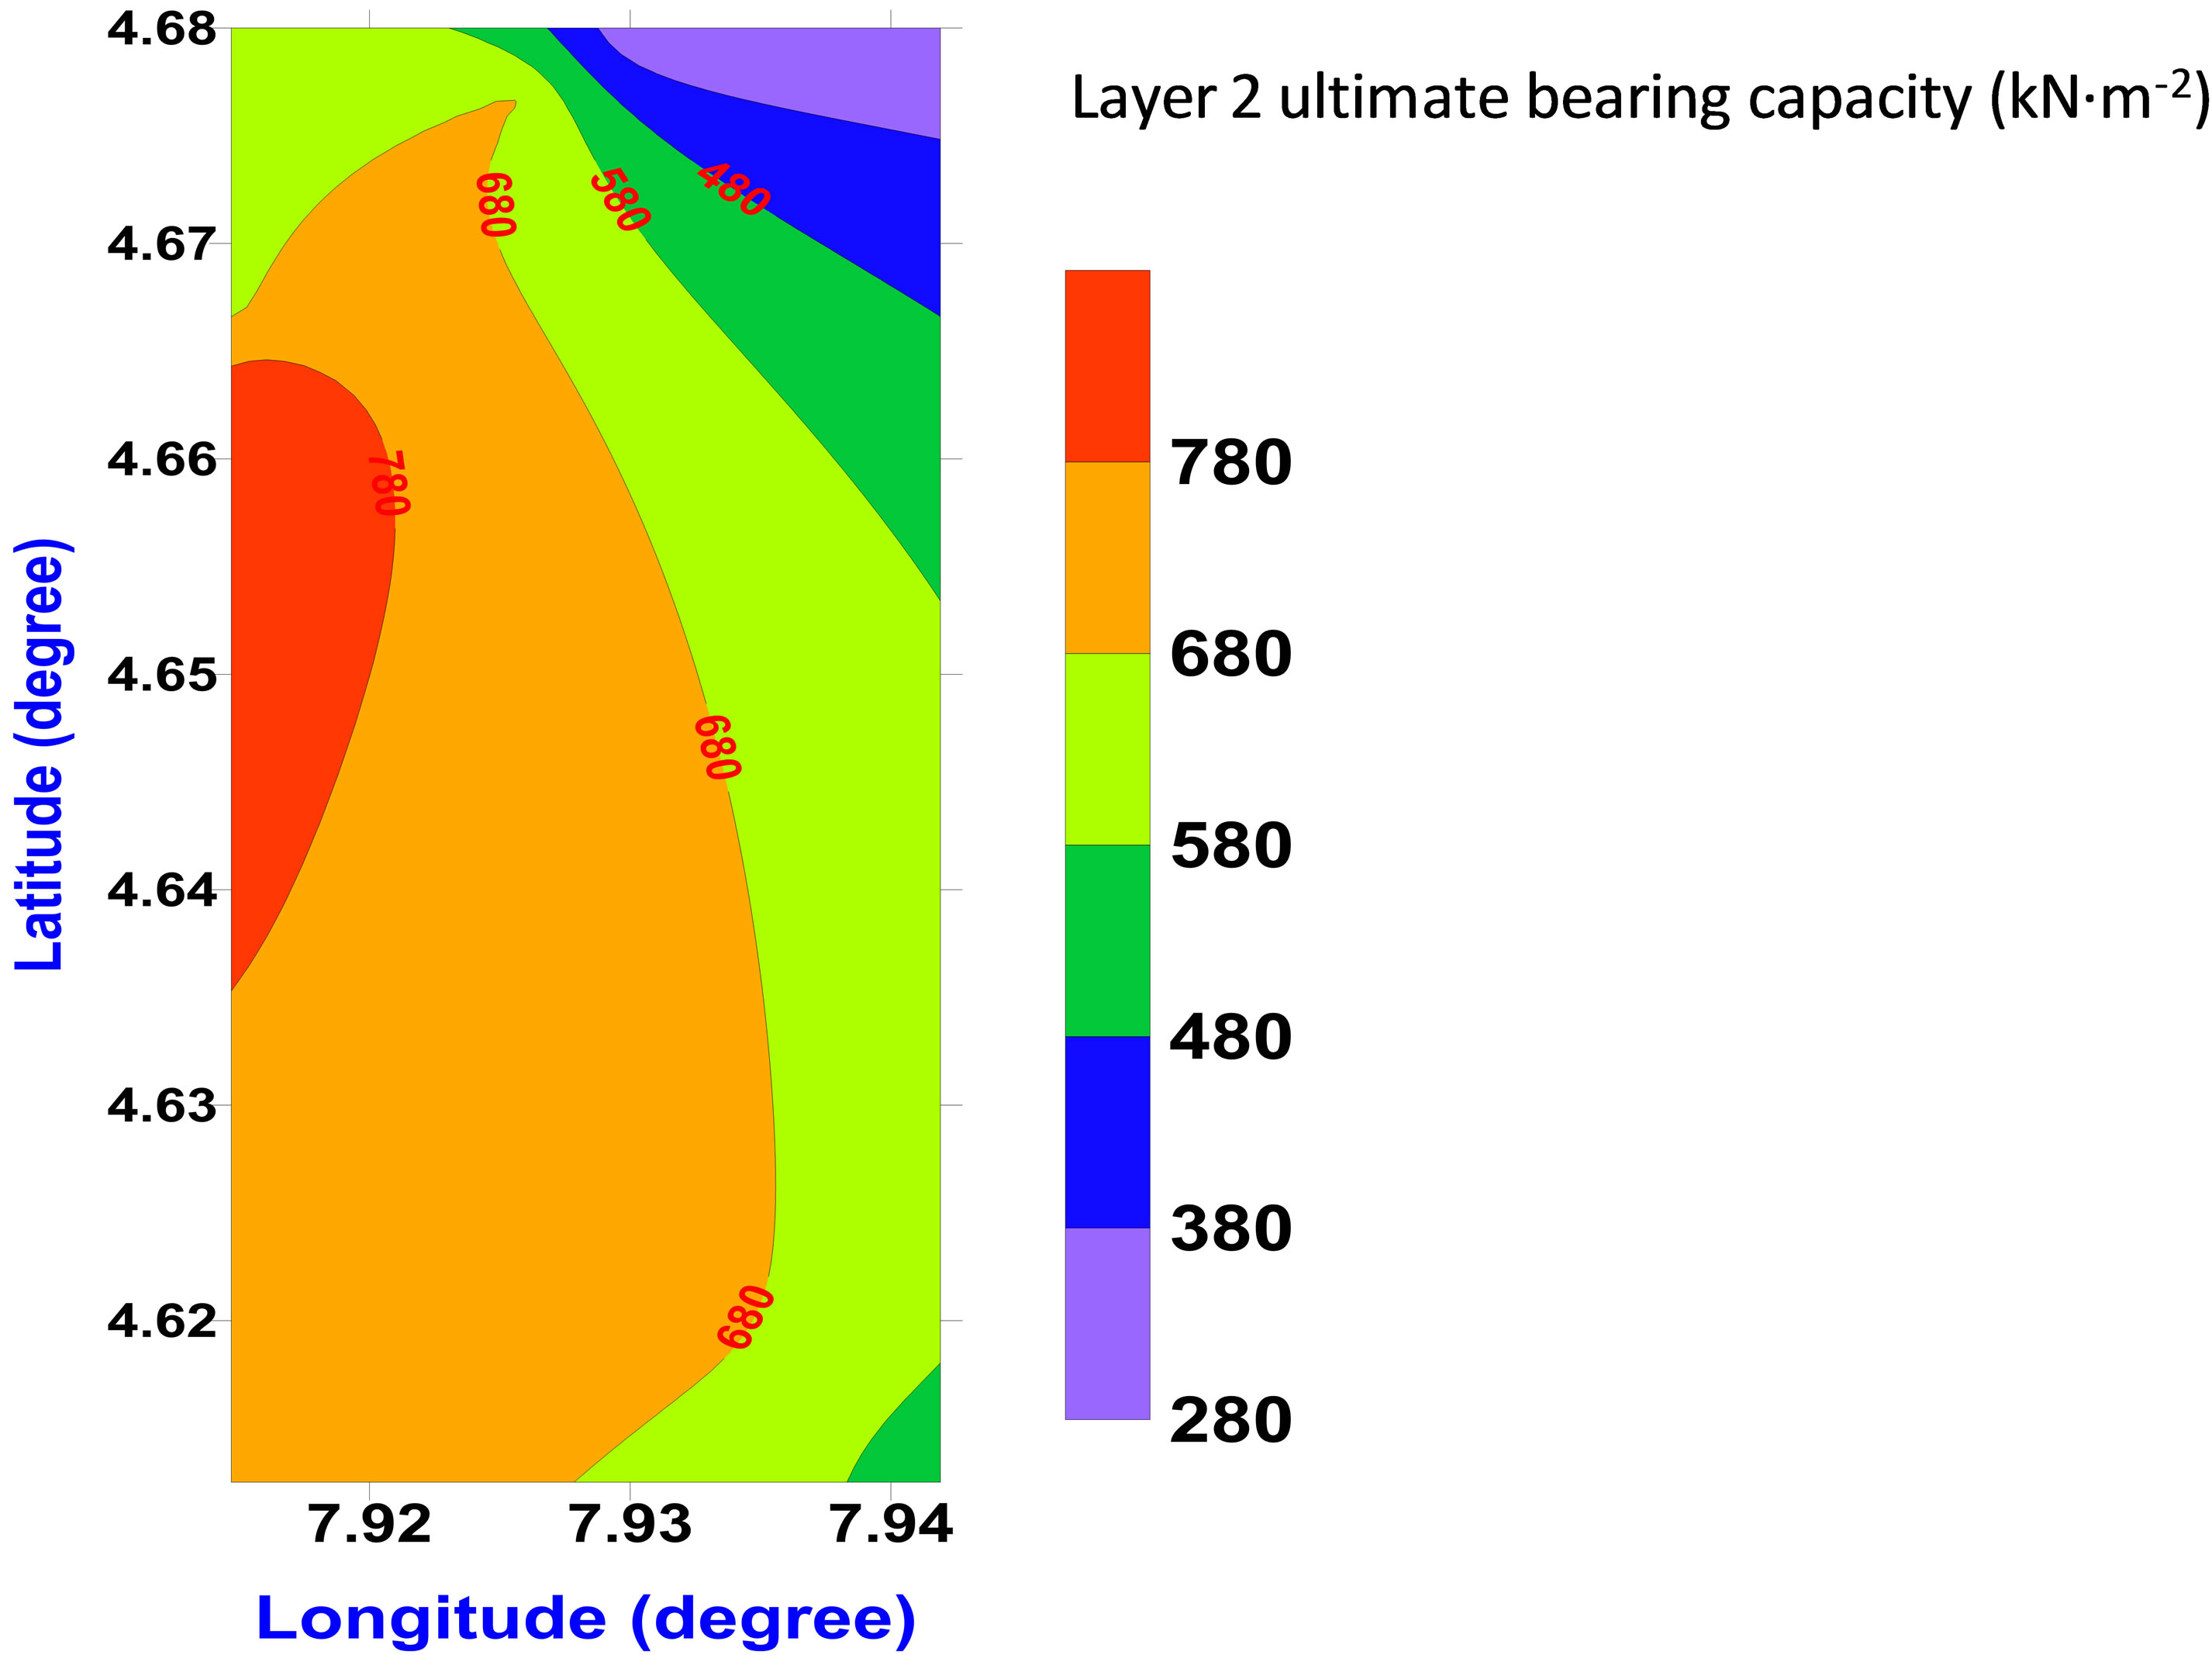 (b)
(b)
Figure 5. (a) 2-D map showing the distribution of ultimate bearing capacity in layer 1 of the shallow foundation; (b) 2-D map showing the distribution of ultimate bearing capacity in layer 2 of the shallow foundation.
layer 2, the range of bearing capacity and its average are 72.56 - 206.63 kN∙m−2 and 154.78 kN∙m−2 respectively for layer 2. According to [14], the range for presumptive safe bearing capacity for sizable loose and dry fine sand to loose gravel/sand, which is the geologic equivalence/ description of the non cohesive/granular shallow foundation considered in this study, is 100 - 245 kN∙m−2. Comparing this range with our results, the best layer for foundation in the study area is the second layer whose characteristic allowable bearing capacity is better correlated with this given range of safe bearing capacity. It is also apparent from our results that the range of 50 - 150 kN∙m−2 proposed by [15] for safe foundation is in analogy with our findings.
6. Conclusion
Allowable bearing capacity is one of the important parameters used in deciding the engineering foundations. The ability of a foundation to carry a load depends on the bearing capacity. Allowable bearing pressure does not depend on Vp/Vs or Poisson’s ratios but on shear modulus. It increases with increase in shear modulus enhanced by high shear wave velocity. Better shear wave velocity can be recorded using [15] approach and seismic refraction method. The seismic refraction method had helped in determining the true S-wave velocity which was used to compute both measured and calculated parameters. The approach also provides a model for ultimate failure on shallow foundation making it very reliable and efficient. Specifically, the computed parameters qa, and µ and the measured Vs from seismic refraction have been used to generate some empirical relations which show the variability of allowable bearing capacity with shear modulus and shear wave velocity. Using the empirical formulations generated from the site data, layer 1 has been found to show lower bearing capacity than layer 2 based on the the coefficients of elastic deformability of shallow foundation realized from the plots of qa against µ. The plots of qa against Vs have also shown that allowable bearing pressure increases with shear wave velocity. From the slopes of the plots for layer 1 and layer 2, there is no significant variability in the distribution of layers 1 and 2 due to similarity in the slopes of the graphs which represent the impulse per cubic metre. The observed hiatus and unconformity characterized by outliers in layer 2 obtained from the plot between allowable bearing capacity and the shear wave velocity shows uneven transition from layer 1 to 2 in some locations. This uneven transition in the bedding planes is responsible for the quadratic nature of Equation (11) obtained when qa is plotted against µ in layer 1. The equation actually approximates to linear equation (Equation (12)) in layer 2. This change from quadratic to linear equation is enhanced by the homogeneous and isotropic distribution of geomaterial in the shallow foundation in layer 2. The range of allowable bearing capacity and the computed average in layer 2 in comparison with those carried out by other authors show that layer 2 is more suitable for shallow foundation than layer 1. The inferred contour maps for layers 1 and 2 also show the spatial distribution of the bearing capacity and the associated ultimate bearing capacities. The maps show conformity in the bearing capacity distributions. This shows the uniqueness of the method. Locating the shallow foundation of engineering in the second layer based on our findings which conform with the findings in literatures will be much more lucrative as cracking of building walls in the study area and its environs will be reduced.
REFERENCES
- S. Grant and G. F. West, “Interpretation Theory in Applied Geophysics,” McGraw-Hill, New York, 1965, p. 583.
- S. K. Sarma and I. S. Lossifelis, “Seismic Bearing Capacity Factors of Shallow Strip Footings,” Geotechnique, Vol. 40, No. 2, 1990, pp. 265-273. http://dx.doi.org/10.1680/geot.1990.40.2.265
- M. Budhu and A. Al-Karni, “Seismic Bearing Capacity of Soils,” Geotechnique, Vol. 43, No. 1, 1993, pp. 181-187. http://dx.doi.org/10.1680/geot.1993.43.1.181
- R. Richards, D. G. Elms and M. Budhu, “Seismic Bearing of Capacity and Settlements of Foundations,” Journal of Geotechnical and Geoenvironmental Engineering, Vol. 119, No. 4, 1993, pp. 662-674. http://dx.doi.org/10.1061/(ASCE)0733-9410(1993)119:4(662)
- L. Dormieux and A. Pecker, “Seismic Bearing Capacity of Foundation on Cohesionless Soils,” Journal of Geotechnical Engineering, Vol. 121, No. 3, 1995, pp. 300-303. http://dx.doi.org/10.1061/(ASCE)0733-9410(1995)121:3(300)
- R. Paolucci and A. Pecker, “Seismic Bearing Capacity of Shallow Strip Foundations on Dry Soils,” Soils Foundation, Vol. 37, No. 3, 1997, pp. 95-105.
- A. H. Soubra, “Seismic Bearing Capacity of Shallow Strip Footings in Seismic Conditions,” Proceedings of the Institution of Civil Engineers–Geotechnical Engineering, Vol. 125, No. 4, 1997, pp. 230-241 http://dx.doi.org/10.1680/igeng.1997.29659
- J. M. Reynolds, “An Introduction to Applied Environmental Geophysics,” New York, Wiley, 1997, p. 780.
- J. Kumar and V. B. K. M. Rao, “Seismic Bearing Capacity Factors for Spread Foundations,” Geotechnique, Vol. 52, No. 2, 2002, pp. 79-88. http://dx.doi.org/10.1680/geot.2002.52.2.79
- T. E. Fumal and J. C. Tinsley, “Mapping Shear Wave Velocities of Near-Surface Geological Materials,” In: J. I. Ziony, Ed., Predicting Area Limits of Earthquake Induced Land Sliding: In Evaluation of Earthquake Hazards in the Los Angeles Region–An Earth Science Prospective, US Geological Survey Paper 1360, 1985, pp. 127-150.
- D. Coundhury and R. K. S. Subay, “Seismic Bearing Capacity of Shallow Strip Footings,” Journal of Manufacturing Systems, Vol. 24, No. 1, 2005, pp. 117-127.
- A. A. A. Othman, “Construed Geotechnical Characteristics of Foundation Beds by Seismic Measurements,” Journal of Geotechnical Engineering, Vol. 2, 2005, pp. 126-138.
- S. S. Tezcan, A. Keceli and Z. Ozdemir, “Allowable Bearing Capacity of Shallow Foundation Based on Shear Wave Velocity,” Geotechnical and Geoenvironmental Engineering, Vol. 24, No. 1, 2006, pp. 203-218. http://dx.doi.org/10.1007/s10706-004-1748-4
- E. U. Ulugergerli and O. Uyanik, “Statistical Correlation between Seismic Wave Velocities and SPT Blow Counts and the Relative Density of Soils,” Journal of Testing Evaluation, Vol. 35, No. 2, 2007, pp. 1-5. http://dx.doi.org/10.1520/JTE100159
- S. S. Tezcan, Z. Ozdemir and A. Keceli, “Seismic Technique to Determine the Allowable Bearing Pressure for Shallow Foundations in Soils Sand Socks,” Acta Geophysica, Vol. 57, No. 2, 2009, pp. 1-14. http://dx.doi.org/10.2478/s11600-008-0077-z
- D. F. Coates, “Rock Mechanics Principles,” In: Mines Branch Monographs 874, Department of Energy, Mines and Resources, Canada, 1970.
- B. O. Hardin and V. P. Drnevich, “Shear Modulus and Damping in Soils,” Journal of Soil Mechanics and Foundation Division ASCE, Vol. 98, 1972, pp. 667-692.
- T. Imai and Yoshimura, “The Relation of Mechanical Properties of Soils to Pand S-Waves Velocities for Soil in Japan,” Urana Research Institute, OYO Corporation, Tokyo, 1976.
- R. H. Tatham, “Vp/Vs and Lithology,” Geophysics, Vol. 47, No. 3, 1982, pp. 336-344. http://dx.doi.org/10.1190/1.1441339
- J. G. Atat, G. T. Akpabio, N. J. George and E. B. Umoren, “Geophysical Assessment of Elastic Constants of Top Soil Using Seismic Refraction Compressional and Shear Wave Velocities in the Eastern Niger Delta, Nigeria,” International Journal of Modern Applied Physics, Vol. 1, No. 1, 2012, pp. 7-19.
- N. J. George, A. E. Akpan, A. M. George and I. B. Obot, “Determination of Elastic Properties of the Over Burden Materials in Parts of Akamkpa, Southern Nigeria Using Seismic Refraction Studies,” Archives of Physics Research, Vol. 1, No. 2, 2010, pp. 58-71.
- S. S. Tezcan, Z. Ozdemir and A. Keceli, “Allowable Bearing Capacity of Shallow Foundations Based on Shear Wave Velocity,” Journal of Geotechnical and Geoenvironmental Engineering, Vol. 24, 2006, pp. 203-218.
- K. Terzaghi and R. B. Peck, “Soil Mechanics in Engineering Practice,” 2nd Edition, John Wiley and Sons, London, 1967.
- J. E. Bowles, “Foundation Analysis and Design,” 3rd Edition, McGraw-Hill Book Company, New York, 1982.
- J. H. Scott, F. T. Lee, R. D. Carroll and C. S. Robinson, “The Relationship of Geophysical Measurements to Engineering and Construction Parameters in the Straight, Creek Tunnel Pilot Boring Colorado,” International Journal of Rock Mechanics and Mining Sciences & Geomechanics Abstracts, Vol. 5, No. 1, 1968, pp. 1-30. http://dx.doi.org/10.1016/0148-9062(68)90020-X
- K. R. Massarsch, “Deformation Properties of Fine-Grained Soils by Means of Seismic Tests,” Keynote Lecture, International Conference on Site Characterization, ISC’2, Porto, 19-22 September 2004, pp. 133-146
- A. H. Soubra, “Seismic Bearing Capacity of Shallow Strip Footings in Seismic Conditions,” Proceedings of the Institution of Civil Engineers–Geotechnical Engineering, Vol. 125, No. 4, 1997, pp. 230-241 http://dx.doi.org/10.1680/igeng.1997.29659