Food and Nutrition Sciences
Vol.4 No.9A(2013), Article ID:36483,12 pages DOI:10.4236/fns.2013.49A1020
Feeding Different Omega-3 Polyunsaturated Fatty Acid Sources Influences Renal Fatty Acid Composition, Inflammation, and Occurrence of Nephrocalcinosis in Female Sprague-Dawley Rats*
![]()
1Human Nutrition and Foods, Division of Animal and Nutritional Sciences, West Virginia University, Morgantown, USA; 2Genetics and Developmental Biology Program, Division of Plant and Soil Sciences, West Virginia University, Morgantown, USA; 3Department of Pathology, Health Sciences Center, West Virginia University, Morgantown, USA; 4Department of Biology, West Virginia University, Morgantown, USA; 5Department of Chemistry, West Virginia University, Morgantown, USA.
Email: #janet.tou@mail.wvu.edu
Copyright © 2013 Joseph C. Gigliotti et al. This is an open access article distributed under the Creative Commons Attribution License, which permits unrestricted use, distribution, and reproduction in any medium, provided the original work is properly cited.
Received May 16th, 2013; revised June 16th, 2013; accepted June 24th, 2013
Keywords: Kidneys; Phospholipids; Krill Oil; Flaxseed Oil; Fish Oils
ABSTRACT
The general population is encouraged to increase omega-3 polyunsaturated fatty acid (n-3 PUFA) intake in order to optimize health for preventative health care. Consumers are typically unaware that different amounts, types, and structural forms of n-3 PUFA have different efficacy. Therefore, the objectives of this study were to characterize different sources of n-3 PUFAs and to determine whether consumption of these oils influences renal fatty acid composition and renal health. Lipid classes and fatty acid profile of corn (CO), flaxseed (FO), menhaden (MO), salmon (SO), tuna (TO) or krill (KO) oils were determined by thin-layer and gas chromatography. All dietary oils consisted of >65% triglyceride with the exception of KO. KO and FO also contained phospholipids. FO was rich in the n-3 PUFA, alpha-linolenic acid (18:3n-3) whereas, the marine oils were rich in the long-chain n-3 PUFAs (>18 carbons). Following characterization of the oil sources, female Sprague-Dawley rats (age 28 d) were randomly assigned (n = 10/group) to be fed a high fat 12% (wt) diet consisting of these different oil sources for 8 weeks. Rats fed MO, TO, and SO had significantly higher renal eicosapentaenoic acid (20:5n-3) and docosahexaenoic acid (22:6n-3) deposition and this in turn, modulated inflammatory responses. Feeding rats MO, SO and TO reduced urinary excretion of 13,14-dihydro-15-keto prostaglandin E2. Feeding rats TO and SO reduced (P ≤ 0.002) nuclear factor kappa B activity and circulating TNFα (P < 0.05). In contrast, rats consuming KO had heavier kidney weights (P < 0.001), total calcium content, and histological evidence of renal calcification and tubulo-interstitial injury. This was due to increased (P < 0.001) urinary phosphorus excretion associated with the phospholipids content of KO. The study results indicated that consumption of n-3 PUFAs influences renal health and the effects varied depending on the n-3 PUFA source consumed.
1. Introduction
The Western diet is characterized by a high fat with the intake of omega-6 polyunsaturated fatty acids (n-6 PUFAs) exceeding the intake of omega-3 polyunsaturated fatty acids (n-3 PUFAs) [1]. A number of animal disease models and human studies have reported beneficial effects of increasing n-3 PUFA intake [2]. However, few studies have investigated the effects of n-3 PUFA consumption for optimizing renal health to prevent injury and disease risk. The long-chain n-6 PUFA, arachidonic acid (ARA, 20:4n-6), using the enzyme, cyclooxygenase- 2 (COX-2) produces pro-inflammatory 2-series prostaglandins (PGs) such as PGE2. Using the same COX-2 enzyme, the n-3 PUFA, eicosapentaenoic acid (EPA, 20:5n-3), synthesizes the less potent 3-series PGs [3]. Therefore, increasing EPA consumption can reduce inflammation by competitive inhibition of PGE2 synthesis. Additionally, n-3 PUFA have been shown to inhibit the activation of pro-inflammatory transcription factors and to down-regulate inflammatory genes [2]. This has health implications because kidney injury induces inflammatory responses that can lead to fibrosis, loss of renal function, and eventually chronic renal failure [4].
Kidney diseases are a major cause of mortality in rats [5]. Rats, particularly female Sprague-Dawley rats, fed purified diets are susceptible to renal injury and nephrocalcinosis [5]. Gigliotti et al. [6] fed female SpragueDawley rats American Institute of Nutrition (AIN)-93G purified diet found that replacing casein with krill protein concentrate (KPC) that contained residual n-3 PUFAs reduced renal injury and nephrocalcinosis. Since the Western diet is high in fat, but low in n-3 PUFAs, it is of interest to determine whether changing the type of fat can influence renal health.
Fish oils are a popular source of long-chain n-3 PUFAs. However, the EPA and docosahexaenoic acid (DHA, 22:6n-3) content can differ depending on the fish species [7,8]. Unlike fish oils, the fatty acids in krill oil are associated with both phospholipids and triglycerides [9]. Krill oil has become increasingly popular due to reported greater bioavailability of n-3 PUFAs in phospholipid form [10]. Several plant oils are rich in n-3 PUFA, alpha-linolenic acid (ALA, 18:3n-3) [7,8]. ALA is a precursor for de novo synthesis of EPA and DHA. Consumer awareness of the health benefits n-3 PUFAs is increasing, but they are typically unaware that different n-3 PUFAs may have different efficacy. This can result in consumers using n-3 PUFA supplements or fortified foods that will not correspond to their desired health outcomes [11].
Nutrition can advance, delay, increase or decrease disease risk. Therefore, the general population is being encouraged to consume more n-3 PUFAs, particularly, EPA and DHA, in order to optimize health for preventative health care. The objectives of this study were to characterize different sources of n-3 PUFAs and to determine whether consumption of these oil sources influence kidney fatty acid composition and renal health.
2. Material and Methods
2.1. Diets
The experimental diet was based on the AIN-93G purified diet [12], but was formulated to have 12 wt% instead of 7% fat to reflect a typical Western diet. The oil sources consisted of corn oil (CO) which is low in n-3 PUFAs or n-3 PUFAs provided as flaxseed oil (FO), menhaden oil (MO), krill oil (KO), salmon oil (SO) or tuna oil (TO). FO was used because it is the richest source of ALA [13]. SO, TO and MO are based on fish species often used in commercial n-3 PUFA supplements. KO is a novel marine oil source rich in n-3 PUFAs in phospholipid form [9]. Commercial food grade FO, SO, and TO were generously provided by Jedwards International (Quincy, MA). MO was purchased from Omega Protein Inc. (Houston, TX), and KO was purchased from Enzymotec USA Inc (Morristown, NJ). The MO and KO diets needed to be adjusted to a blend of 0.2% CO + 11.8% test oil in order to meet the recommendation for the essential fatty acid, linoleic acid (LA, 18:2n-6) in growing rats [14] (Table 1).
2.2. Lipids and Fatty Acid Analysis of Dietary Oils
Lipid classes in the dietary oils were determined by thinlayer chromatography (TLC) according to Gigliotti et al. [9]. Briefly, each oil was dissolved (1 mg/ml) in chloroform:methanol (1:1; v:v) and spotted onto Whatman K6F Silica plates with 60 Å pore sizes, (Cobert Associates, St. Louis, MO). Silica plates were developed in a hexane:ether:acetic acid (80:20:1.5; v:v:v) solvent then visualized using a Fluorchem 8000 densitometer with transluminating white light (Alpha Innotech Corp, San Leandro, CA). Total phospholipid and triglyceride were identified using RF values obtained by comparison to soybean lecithin (Fisher Scientific, Pittsburgh, PA) and triolein (Sigma-Aldrich, St. Louis, MO) standards, respectively. Lipid classes were quantified by spot densitometer Fluorchem computer program (version 1.0).
To determine fatty acid profile, dietary oils were converted to fatty acid methyl esters (FAMEs) using the procedure described by Fritsche and Johnston [15]. FAME samples were analyzed by gas chromatography (CP-3800, Varian, Walnut Creek, CA) using an initial temperature of 140˚C held for 5 min and then increased 1˚C per min to a final temperature of 220˚C. Total separation time was 60 min. A wall-coated open tubular fused silica capillary column (Varian Inc., Walnut Creek, CA) was used to separate FAMEs with CP-Sil 88 as the stationary phase. Nitrogen was used as the carrier gas. Fatty acids were identified as FAMEs by comparing retention times to a FAME 37 standard (Supelco, Bellefonte, PA) and presented as the percent of total fatty acids.
2.3. Animal Feeding Study
All animal procedures were conducted in accordance with the guidelines set forth by the National Research Council for the Care and Use of Laboratory Animals [16] and approved by the Animal Care and Use Committee at West Virginia University. Young (28 d) female SpragueDawley rats were obtained from Hilltop Lab Animals (Scottdale, PA). Upon arrival, rats were individually housed in metabolic cages. Rats were maintained in a room at 21˚C with a 12 h light/dark cycle. Following the

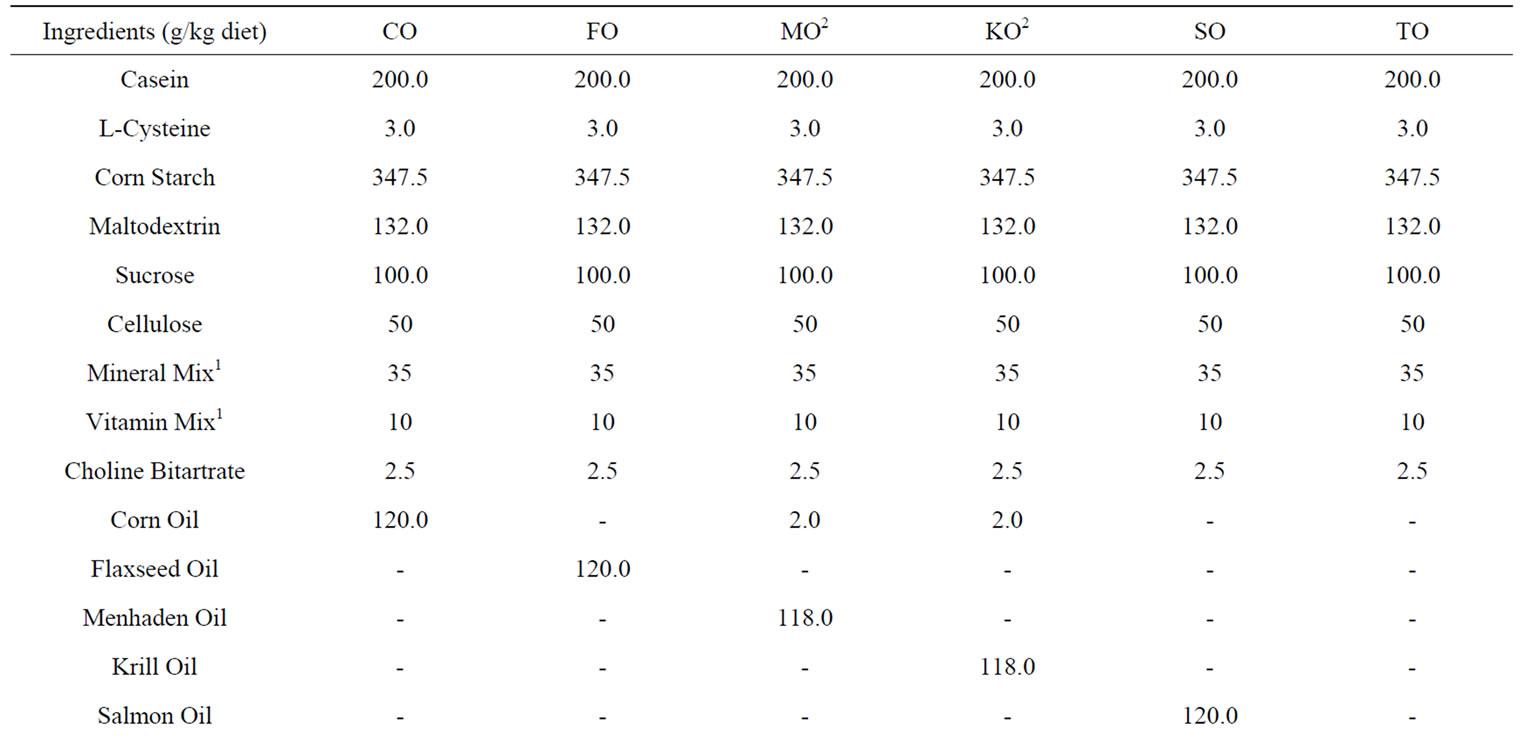
Table 1. Experimental diet composition.
7 d acclimation period, rats were randomly assigned (n = 10 rats/groups) to CO, FO, KO, MO, SO or TO diet. Diets were stored at −20˚C until fed.
Excess fat, cholesterol, protein, phosphorus (P), and calcium: P ratio has been reported influence nephrocalcinosis [17,18]. The purified diet provided identical nutrient composition with the only difference being the oil source. All diets were adjusted to be isocaloric and rats were provided 14.75 ± 0.75 g of fresh powder diet daily to prevent variation in nutrient and total caloric intake. Rats were provided free access to deionized distilled (ddH2O). Body weights and ddH2O intake was recorded weekly.
At the end of the 8 week feeding study, rats were euthanized by CO2 asphyxiation. The chest cavity was opened and the aorta punctured to collect blood. Blood was centrifuged at 1500 g for 10 min at 4˚C. Serum samples were stored at −80˚C until assayed. Kidneys were excised, trimmed, decapsulated, and weighed separately. After no bilateral difference between the kidney weights was determined by t-test, the kidneys were sectioned and stored accordingly for histology or gene expression analysis.
2.4. Histological Evaluation of Kidney Morphometry
A center sagittal section was removed and immediately fixed in 10% buffered formalin solution for histological evaluation. Tissues were dehydrated through a series of increasing ethanol concentrations in ddH2O to xylene and embedded in paraffin. Sections (3 µm) from each block were stained with hematoxylin and eosin. Histologic parameters evaluated included: interstitial matrix deposition or calcification, interstitial inflammation, tubulointerstitial fibrosis, tubular dilation, glomerular hypercellularity, and arteriolosclerosis. All slides were analyzed under a Nikon TE 2000-S light microscope (Nikon Instruments, Melville, NY) by two trained individuals who were blinded to the treatments. Images were captured using a PC interfaced with Q-Capture imaging software (Quantitative Imaging Corporation, BC, Canada).
2.5. Analysis of Kidney Fatty Acid Composition
Total lipid was extracted from snap frozen kidney tissue according to a modified method of Bligh and Dyer [19]. Briefly, ~400 mg of frozen renal tissue was homogenized in Tris/EDTA buffer and mixed with a chloroform: methanol:acetic acid (2:1:0.15 v/v/v) solution. After centrifugation at 900 g for 10 min at 10˚C, the bottom chloroform layer was collected. The collected chloroform was filtered through 1-phase separation filters, dried under nitrogen gas. The extracted lipid samples were then methylated and quantified by gas chromatography as described for the fatty acid analysis of the dietary oils.
2.6. Analysis of Kidney Mineral Content
To determine kidney mineral content, kidney tissue was ashed in a muffle furnace (Lindberg, WI) at 550˚C for 24 h. Ashed samples were dissolved in 2 mL of 70% nitric acid, filtered through Whatman No. 1 paper, and diluted to a final volume of 25 mL in ddH2O. The calcium (Ca) and P content of the kidney samples were determined by inductively coupled plasma spectrometry (ICP, model P400, Perkin Elmer, Shelton, CN).
2.7. Serum and Urinary Biochemical Measurements
Serum tumor necrosis factor alpha (TNFα) was determined by double-antibody sandwich rat TNFα enzymelinked immunosorbant (ELISA) assay kit (MyBiosciences, San Diego, CA) and quantified using a Spectramax Plus microplate reader (Molecular Devices, Sunnyvale, CA). Serum measurements of kidney function: Ca, P, blood urea nitrogen, and protein were determined using a Vet-16 rotor quantified by a Hemagen Analyst automated spectrophotometer (Hemagen Diagnostics Inc., Columbia, MD).
Urinary kidney measurements were performed on pooled 7-d urine samples collected during the final week of the study. The PG metabolite, 13,14-dihydro-15-keto PGE2, was determined using a commercially available enzyme immunoassay kit (Cayman Chemical, Ann Arbor, MI). Urinary Ca and P contents were determined by diluting the urine 1:40 in ddH2O followed by analysis of minerals by ICP. Urinary pH was determined using a standard pH meter (Beckman Coulter, Brea, CA). Urinary albumin was determined by ELISA kit (Alpco Diagnostics, Salem, NH). Urinary creatinine was determined using a colorimetric assay kit (Cayman Chemical, Ann Arbor, MI). Glomerular filtration rate (GFR) was calculated according to Gigliotti et al. [6].
2.8. Gene Expression Analysis
Gene expression was measured by isolating total RNA from frozen kidney tissue using the mirVanaTM miRNA Isolation Kit (Ambion Inc, Foster City, CA) according to the manufacturer’s instructions for total RNA isolation. The concentration of total RNA was quantified using a NanoDrop 1000 spectrophotometer (Thermo Scientific, Waltham, MA). RNA integrity was assessed by agarose gel electrophoresis. Total RNA was treated with DNase I using the TURBO DNA-free kit (Ambion, Foster City, CA). First-strand complementary DNA (cDNA) was synthesized using the SuperScript III First-Strand Synthesis System (Invitrogen, Carlsbad, CA), according to the manufacturer’s instructions with oligo(dT)20 and 600 ng of DNase-free total RNA.
The expression of osteopontin and inhibitor of kappa B alpha (IkBα) were determined by real time quantitative polymerase chain reaction (RT-qPCR). Using ABI 7500 Real-Time PCR Detection System (Applied Biosystems, Foster City, CA), 5 µl reactions were used consisting of 2.5 μl 2X SYBR Green PCR Master Mix (Applied Biosystems, Carlsbad, CA), 100 nM of each primer, and 1 µL of diluted (1:10) cDNA. The primers used were as follows. Osteopontin (SPP1): forward 5’-TCAGCATTT CGCTTCTGTTC-3’, reverse 5’-CCTGTAAGTTTGCCT GCCTCT-3’ and IkBα (NM_001105720.2): forward 5’- CTGGTCTCGCTCCTGTTGA-3’ and reverse 5’-GC CCTGGTAGGTTACTCTGTTG-3’. The housekeeping gene GAPDH was used as an internal reference (forward 5’-TCAAGAAGGTGGTGAAGCAG-3’, reverse 5’-CC TCAGTGTAGCCCAGGATG-3’). The program used for qRT-PCR amplification consisted of an initial temperature at 50˚C for 2 min followed by an initial denaturation for 10 min at 95˚C and 40 PCR cycles. Each cycle consisted of a melting step at 95˚C for 15 sec followed by a joint annealing/extension step at 60˚C for 1 min. Specificity of amplification was assessed by a melting curve of each amplicon and visualization of the expected fragment size on 3% agarose gel. Data were expressed as relative gene expression to rats fed CO after normalization to the GAPDH housekeeping gene described by Pfaffl [20].
To determine NFκB activity, ~300 mg of fresh tissue was immediately processed for isolation of nuclear proteins using a commercially available nuclear protein extraction kit (Active Motif, Carlsbad, CA). The protein content of the nuclear extract was determined using a commercially available protein determination assay based on the Bradford method (Cayman Chemical, Ann Arbor, MI). Nuclear protein (10 µg) was used to determine the activation of NFκB using the TransAM NFκB p65 transcription factor assay kit (Active Motif, Carlsbad, CA).
2.9. Statistical Analysis
A one-way analysis of variance (ANOVA) was used to determine differences among rats fed the different diets. Post-hoc analysis was performed using Tukey’s test while a non-parametric rank analysis was performed on data not normally distributed. Differences were considered significant at P < 0.05. A multivariate linear mixed model was performed to normalize and to fit the data. Least square means (LSM) were used to determine a relationship between kidney weights and renal Ca and P content. Pearson and Spearman correlation coefficient was used determine the relationship between effect of diet and urinary renal function measurements, respectively, using the SAS Proc Mixed Version 9.2. Statistically significant differences in gene expression were analyzed by pairwise fixed reallocation randomization test as a statistical model in the relative expression software tool (REST) program [20] developed for groupwise comparison and statistical analysis of relative expression results.
3. Results
3.1. Lipid and Fatty Acid Composition of Dietary Oils
Analysis of the dietary oils showed the oil sources were predominately triglycerides (>65%) with the exception of KO. Only KO and FO contained detectable phospholipids (Table 1). The plant oils were rich in the 18 carbon PUFAs, with CO having the highest LA (18:2n-6) and FO the highest ALA (18:3n-3) content. KO had the highest EPA content followed by SO. TO had the highest DHA content. There was no detectable EPA and DHA in CO and FO (Table 1).
3.2. Kidney Morphology
Rats fed high fat diets consisting of different n-3 PUFA sources showed occurrence of renal interstitial inflammation was lowest in rat fed MO (10%) followed by TO (20%). In contrast, rats fed KO had the highest occurrence of interstitial inflammation, tubular dilation, tubulo-interstitial fibrosis, and tubular calcification among the diet groups. Rats fed FO also had more frequent occurrence of interstitial inflammation and fibrosis, although this was less consistent compared to rats fed KO (Figure 1).
3.3. Kidney Fatty Acid Composition and Mineral Content
Table 2 shows the renal fatty acid composition of rats fed high fat diets containing different n-3 PUFA sources. The n-6:n-3 ratio in the kidneys of rats fed n-3 PUFA sources ranged from 1:1 to 2:1 compared to the 33:1 n-6:n-3 ratio in CO-fed rats. Of the different n-3 PUFA sources, only rats fed the FO had detectable renal ALA deposition. Rats fed FO resulted in renal EPA content, but significantly lower renal EPA content than rats fed marine oils MO, KO, and SO. Of the marine oils, renal EPA content was highest (P = 0.001) in rats fed KO and SO. Rats fed marine oils had higher (P < 0.001) renal DHA content than rats fed either FO or CO. Of the fish oils, rats fed MO had the highest (P = 0.04) renal DHA content. There were no significant differences in total kidney lipid content among the diet groups.
Table 3 shows rats fed KO had heavier (P < 0.001) relative kidney weights compared to rats fed either FO or MO. Rats fed KO had the highest (P < 0.001) renal total Ca content. There was sufficient evidence by LSM to suggest diet was important with respect to mean kidney Ca content (P = 0.002 where F0 ~ F(5,53)). There was not sufficient evidence by LSM to suggest diet was important with respect to mean kidney P content (P = 0.16, where F0 ~ F(5,53)). There were no significant differences in food intake, body weight gain, final body weight, and intake of ddH2O among the diet groups. Gene expression of osteopontin, an inhibitor of Ca formation and retention, was up-regulated (P = 0.02) in TO and SO compared to CO-fed rats (Figure 2).
3.4. Serum and Urinary Biochemistry Measurments
Table 4 shows there was no difference in daily urinary output volume. However, rats fed TO had lower (P = 0.009) urinary Ca excretion than rats fed FO or CO. There was sufficient evidence to suggest diet was important with respect to urinary Ca (P = 0.03 where F0 ~ F(5,54)). Urinary P excretion was also influenced by diet
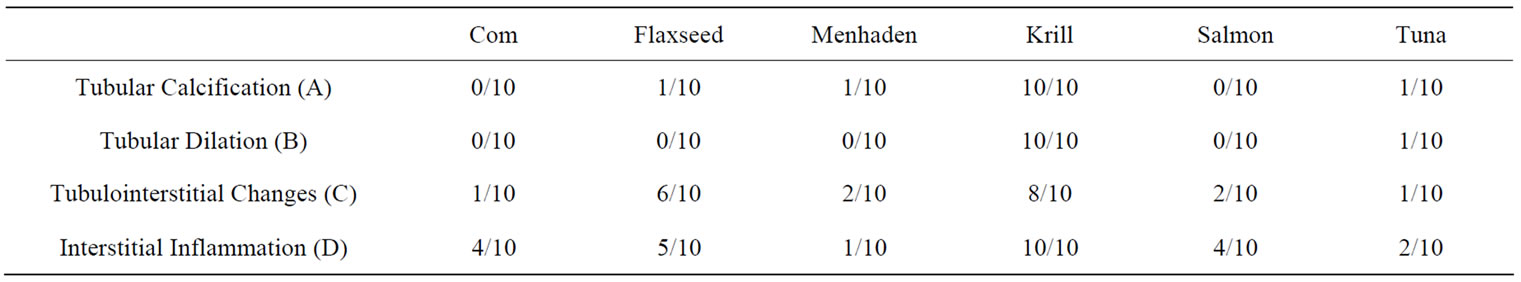

Figure 1. Representative histological image of renal morphology. Data is represented as proportion of animals displaying morphological changes (n = 10).

Table 2. Renal fatty acid content of female Sprague-Dawley rats fed different dietary sources of n-3 PUFAs.
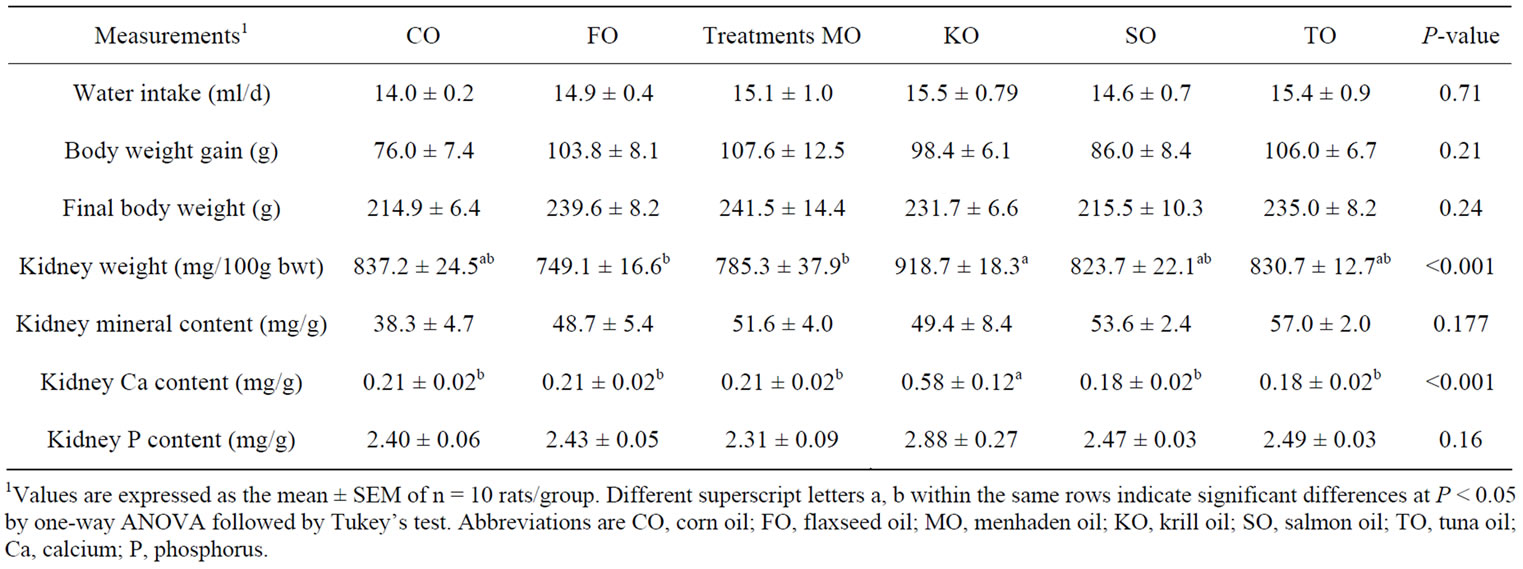
Table 3. Water intake, body weight, kidney weight and renal mineral content of female Sprague-Dawley rats fed different sources of n-3 PUFAs.
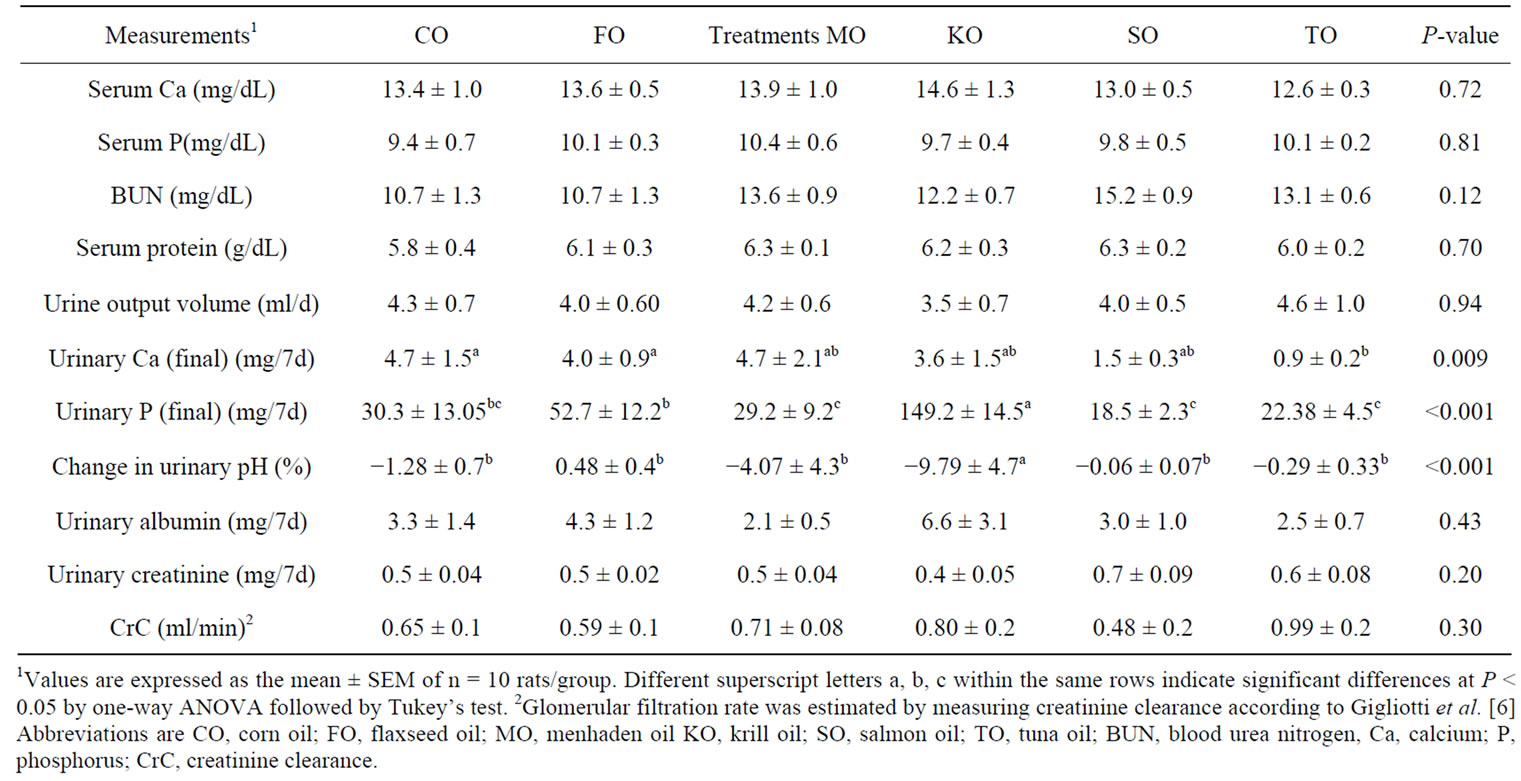
Table 4. Serum and urinary measurements of kidney function during the final week of the study.
consumed (P < 0.001) where F0 ~ F(5,53)). Rats fed KO had the highest (P < 0.001) urinary P excretion. Rats fed FO had higher (P < 0.001) urinary P excretion compared to rats fed MO, SO and TO. In addition, there was sufficient evidence to suggest diet was important with respect to mean percent change in urinary pH (P = 0.0002 where F0 ~ F(5,53)). Rats fed KO had the greatest change in urinary pH (P < 0.001) among the diet groups. There were no differences in urinary kidney function measurements of albumin, creatinine or CrC among the diet groups. Similarly, no differences were observed in serum measures of kidney function. During the final week of the feeding study, rats fed MO, SO, TO had reduced (P = 0.03) urinary PGE2 metabolite excretion compared to rats fed CO (Figure 3). Altering tissues n-3 PUFAs affects production of inflammatory mediators as well as activation of transcription factors and the expression of gene regulating inflammation [2].
3.5. Modulators and Mediators of Inflammation
Rats fed high fat diets consisting of different n-3 PUFA sources showed SO (P = 0.002) and TO (P = 0.001) fed rats had lower NFκB activity than rats fed FO (Figure 4(A)). Gene expression of IkBα was up-regulated in rats
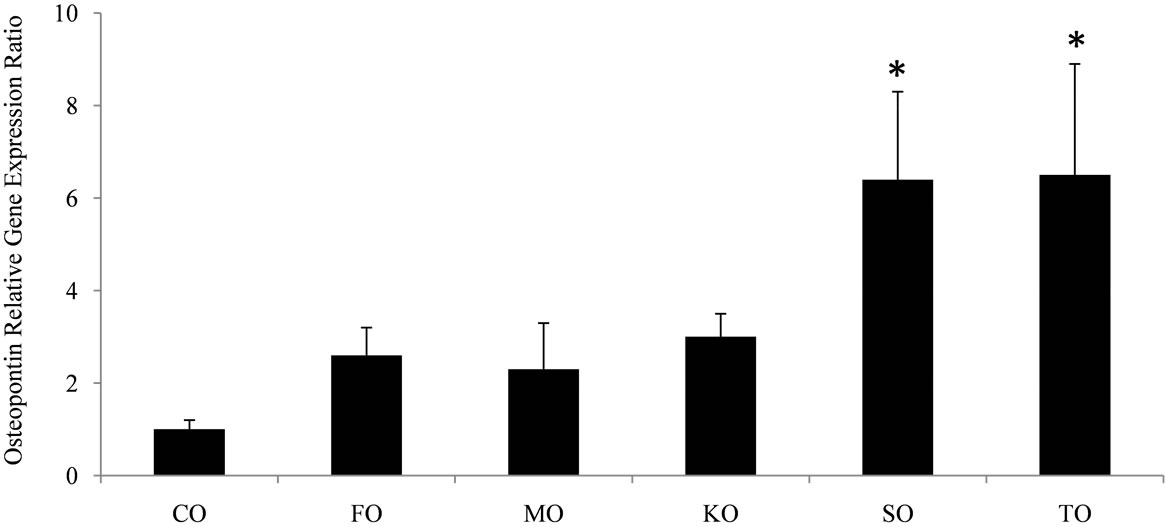
Figure 2. The effect of feeding growing female rats fed different sources of omega-3 polyunsaturated fatty acids on relative gene expression ratio of osteopontin. Bars represent mRNA expression of n = 5 rats/group normalized to GAPDH and relative to rats fed corn oil using the REST software program. The symbol * indicates significantly different from corn oil. Abbreviations are CO, corn oil; FO, flaxseed oil; MO, menhaden oil; KO, krill oil; SO, salmon oil; TO, tuna oil.

Figure 3. The effect of feeding growing female rats fed different sources of omega-3 polyunsaturated fatty acids on urinary prostaglandin E2 metabolite concentration. Values are the means ± SEM of n = 8 rats/group. Results are significantly different at P < 0.05 by one-way ANOVA followed by Tukey’s test. The symbol * indicates significantly different from corn oil. Abbreviations are CO, corn oil; FO, flaxseed oil; MO, menhaden oil; KO, krill oil; SO, salmon oil; TO, tuna oil; PGE2, prostaglandin E2.
fed SO (P = 0.03) compared to CO-fed rats. There was a tendency (P = 0.09) for up-regulated IkBα gene expression in rats fed TO compared to CO-fed rats (Figure 4(B)). Serum TNFα was significantly lower in rats fed SO, TO, and MO compared to KO, FO, and CO-fed rats (Figure 4(C)).
4. Discussion
Pro-inflammatory responses contribute to disease development and progression. Increasing tissue n-3 PUFA content has been shown to modulate inflammation [2]. Of the fish oils, renal EPA content was highest (P = 0.02)
in rat fed SO whereas DHA content was highest (P = 0.04) in rats fed MO followed by TO and SO. In turn, rats fed SO had the lowest renal ARA (P = 0.02) content followed by TO and MO-fed rats. Animal studies have shown that pro-inflammatory ARA-derived PGE2 is decreased by EPA or DHA feeding [2]. In our study, stable metabolites of PGE2 were determined in the urine. Urinary PGs are considered a good indicator of renal PG synthesis due to the close association of PG excretion with renal PG production [21]. Urinary PGE2 metabolite excretion was lowest in rats fed MO, TO and SO. Schoene et al. [22] reported that rats fed CO supplemented with MO reduced renal pro-inflammatory PGE2

Figure 4. The effect of feeding growing female rats fed different sources of omega-3 polyunsaturated fatty acids on: (A) NFκB activity in renal tissue nuclear extracts. Values are the mean ± SEM of n = 7 rats/diet group. Results are significantly different at P < 0.05 by one-way ANOVA followed by Tukey’s test, (B) relative gene expression ratio of IkBα. Bars represent mRNA expression of n = 5 rats/group normalized to GAPDH and relative to control (i.e. rats fed corn oil) using the REST software program, (C) serum TNFα concentrations. Values are the mean ± SEM of n = 7 rats/diet group. Results are significantly difference at P < 0.05 by one-way ANOVA followed by Tukey’s test. The symbol * indicates significantly different from corn oil (CO), † indicated significantly different from flaxseed oil (FO), ♦ indicates significant different from krill oil (KO). Abbreviations are CO, corn oil; FO, flaxseed oil; MO, menhaden oil; KO, krill oil; SO, salmon oil; TO, tuna oil; NFκB, nuclear factor kappa B, IkBα, inhibitor of kappa B alpha; TNFα, tumor necrosis factor alpha.
production. In our study, renal interstitial inflammation was lowest in rat fed MO followed by TO.
Other anti-inflammatory mechanisms attributed to n-3 PUFAs are activation of transcription factors and gene expression [2]. NFκB is a key transcription factor controlling gene expression of COX-2 and various cytokines [23]. NFκB is stored bound to the inhibitory subunit IkB which prevents nuclear uptake. N-3 PUFAs blocks NFκB activity by decreasing IkB degradation [24]. Rats fed TO had a tendency (P = 0.09) and SO up-regulated IkBα gene expression compared to CO-fed rats. In turn, rats fed TO (P = 0.001) and SO (P = 0.002) reduced NFκB activity. Activation of NFκB leads to expression of TNFα which plays a role in the progression of inflammatory diseases [23,24]. In our study, circulating TNFα was significantly lower in SO, TO and MO compared to CO and FO-fed rats. The results showed that feeding fish oil sources of n-3 PUFAs increased renal EPA and DHA deposition and in turn, modulated inflammatory responses.
Feeding different n-3 PUFA sources also influenced renal tissue calcification. The pro-inflammatory eicosanoid, PGE2 also induces hypercalciuria which is a risk factor for kidney injury and nephrocalcinosis [25]. Urinary Ca excretion was significantly decreased in rats fed TO. Osteopontin gene expression was significantly upregulated in the kidneys of rats fed TO and SO compared to CO-fed rats. Wesson et al. [26] reported that osteopontin is an inhibitor of Ca formation and retention in renal tubules. Rats fed KO with the highest dietary EPA content resulted in the highest (P < 0.001) renal EPA content. Yet, KO-fed had the highest renal Ca content, tubular calcification, interstitial inflammation and fibrosis. KO was unique among the marine oil sources in its high phospholipid content. Elevated urinary P excretion and lower pH in KO-fed rats indicated a urinary composition associated with increased P intake [27]. The purified diet provided identical nutrients, there were no differences in food intake, and demineralized water was provided. Therefore, the only dietary difference was the oil source. Inadvertently, providing a high fat diet consisting of oils rich in phospholipid provides additional dietary P. Dietary P has been used to induce nephrocalcinosis in rats [28]. Feeding male rats a high P diet for 1 d was found to induce renal tubules injury and nephrocalcinosis in ~9% of the animals [29].
Of the oil sources used in our study, only FO and KO had measurable phospholipids. Rats fed the FO diet with the highest ALA content resulted in conversion to long chain n-3 PUFAs indicated by EPA and DHA deposition in the kidneys. However, providing n-3 PUFAs as ALA was less efficient at increasing renal EPA and DHA content than rats fed marine oils containing pre-formed EPA and DHA. Since increasing renal n-3 PUFA content did not prevent renal morphological changes induced by dietary P in KO or FO-fed rats; less extensive renal morphological changes in FO compared to KO-fed rats were likely due to the lower phospholipid content in the FO (9% ± 0.3%) than KO (16% ± 0.6%) diet. Zajicek et al. [30] reported phospholipids impair the sodium/phosphorus co-transport of renal brush border vesicles creating a deficit of P to Ca at the tissue level. Despite morphological evidence of kidney injury in rats fed KO or FO diet for 8 weeks there was no statistically significant effect on any urinary or serum measures of renal function. Due to the kidneys compensatory mechanism, renal function often does not change until the damage is extensive.
In the present study, pure oils were consumed which is unlikely to occur in the human diet. However, use of high doses of purified compounds is standard when assessing the safety of compounds and rats are an animal species used in testing for regulatory purposes [31]. In our study, rats fed a high fat purified diet with the lipid source as KO promoted kidney injury and nephrocalcinosis. Currently, n-3 PUFA supplements in the form of phospholipids are being widely promoted as superior to n-3 PUFA supplements in the triglyceride form. This is of concern because consumers tend to apply various health benefits to all amounts, types, and structural forms of n-3 PUFAs.
The present study showed that consumption of n-3 PUFAs altered renal fatty acid composition and renal health and the effects varied depending on the n-3 PUFA source consumed. Rats fed MO, TO SO had higher renal DHA and EPA content that may optimize health by reduced inflammation through decreasing production of mediators of inflammation, activation of transcription factors, and inflammatory genes expression. In contrast, rats consuming KO and to a lesser extent FO showed evidence of renal calcification and tubulo-interstitial injury. This was due to increased urinary P excretion associated with the phospholipids content of these oils sources. Although further studies are needed, susceptible individual should be aware of a potential risk of increasing phospholipids consumption on renal health.
5. Acknowledgements
We are grateful to Dr. Phil Turk for assistance with the statistical analysis and manuscript preparation. We also thank Susan Slider for running the GC samples, Joan Wright for running the ICP samples, and Barbara Mickelson for assistance regarding the diet formulation. This work was funded in part by the USDA NIFA# 71609018 and the West Virginia University Agriculture and Forestry Experimental Station Hatch Grant H459 Scientific Article No. 3172. The authors declare no conflicts of interest.
REFERENCES
- A. L. Cordain, S. B. Eaton, A. Sebastian, N. Mann, S. Lindeberg, B. A. Watkins, J. H. O’Keefe and J. BrandMiller, “Origins and Evolution of the Western Diet: Health Implications for the 21st Century,” The American Journal of Clinical Nutrition, Vol. 81, No. 2, 2005, pp. 341-354.
- P. C. Calder, “Omega-3 Polyunsatured Fatty Acids and Inflammatory Processes: Nutrition or Pharmacology,” British Journal of Clinical Pharmacology, Vol. 75, No. 3, 2013, pp. 645-662. doi:10.1111/j.1365-2125.2012.04374.x
- C. D. Funk, “Prostaglandins and Leukotrienes: Advances in Eicosanoid Biology,” Science, Vol. 294, No. 5548, 2001, pp. 1871-1875. doi:10.1126/science.294.5548.1871
- S. R. Khan, “Crystal-Induced Inflammation of the Kidneys: Results from Human Studies, Animal Models, and Tissue-Culture Studies,” Clinical and Experimental Nephrology, Vol. 8, No. 2, 2004, pp. 75-88. doi:10.1007/s10157-004-0292-0
- G. N. Rao, “Diet and Kidney Diseases in Rats,” Toxicologic Pathology, Vol. 30, No. 6, 2002, pp. 651-656. doi:10.1080/01926230290166733
- J. C. Gigliotti, A. L. Smith, J. Jaczynski and J. C. Tou, “Consumption of Krill Protein Concentrate Prevents Early Renal Injury and Nephrocalcinosis in Female Sprague-Dawley Rats,” Urological Research, Vol. 39, No. 1, 2011, pp. 59-67. doi:10.1007/s00240-010-0261-x
- J. C. Tou, S. N. Altman, J. C. Gigliotti, V. A. Benedito and E. L. Cordonier, “Different Sources of Omega-3 Polyunsaturated Fatty Acids Affects Apparent Digestibility, Tissue Deposition, and Tissue Oxidative Stability in Growing Female Rats,” Lipids in Health and Disease, Vol. 10, 2011, pp. 179-193. doi:10.1186/1476-511X-10-179
- R. J. Deckelbaum and C. Torrejon, “The Omega-3 Fatty Acid Nutritional Landscape: Health Benefits and Sources,” Journal of Nutrition, Vol. 142, No. 3, 2012, pp. 587S-591S. doi:10.3945/jn.111.148080
- J. C. Gigliotti, M. P. Davenport, S. K. Beamer, J. C. Tou and J. Jaczynski, “Extraction and Characterisation of Lipids from Antarctic krill (Euphausia superba),” Food Chemistry, Vol. 125, No. 3, 2011, pp. 1028-1038. doi:10.1016/j.foodchem.2010.10.013
- J. P. Schuchardt, I. Schneider, H. Meyer, J. Neubronner, C. Von Schacky and A. Hahn, “Incorporation of EPA and DHA into Plasma Phospholipids in Response to Different Omega-3 Fatty Acid Formulations: A Comparative Bioavailability Study of Fish Oil vs. Krill Oil,” Lipids in Health and Disease, Vol. 10, 2011, pp. 145-152. doi:10.1186/1476-511X-10-145
- A. McManus, M. Merga and W. Newton, “Omega-3 Fatty Acids. What Consumers Need to Know,” Appetite, Vol. 57, No. 1, 2011, pp. 80-83. doi:10.1016/j.appet.2011.03.015
- P. G. Reeves, “Components of the AIN-93 Diets as Improvements in the AIN-76A Diet,” Journal of Nutrition, Vol. 27, No. 5, 1997, pp. S838-S841.
- S. C. Cunnane, M. J. Hamadeh, A. C. Liede, L. U. Thompson, T. M. Wolever and D. J. Jenkins, “Nutritional Attributes of Traditional Flaxseed in Healthy Young Adults,” The American Journal of Clinical Nutrition, Vol. 61, No. 1, 1995, pp. 62-68.
- National Research Council, “Nutrient Requirements of Laboratory Animals,” 4th Edition, National Academy Press, Washington DC, 1995, pp. 11-79.
- K. L. Fritsche and P. V. Johnston, “Effect of Dietary Omega-3 Fatty Acids on Cell-Mediated Cytotoxic Activity in BALB/c Mice,” Nutrition Research, Vol. 10, No. 5, 1990, pp. 577-588. doi:10.1016/S0271-5317(05)80067-3
- National Research Council, “Guide for the Care and Use of Laboratory Animals,” National Academy Press, Washington DC, 1996, pp. 21-55.
- A. Schmiedl, P. O. Schwille, E. Bonucci, R. G. Erben, A. Grayczyk and V. Sharma, “Neprhocalcinosis and Hyperlipidemia in Rats Fed a Cholesterol and Fat-Rich Diet: Association with Hyperoxaluria, Altered Kidney and Bone Minerals, and Renal Phospholipid-Calcium Interaction,” Urological Research, Vol. 28, No. 6, 2000, pp. 404-415. doi:10.1007/s002400000144
- K. A. Cockell, M. R. L’Abbe and B Belonje, “The Concentrations and Ratio of Dietary Calcium and Phosphorus Influence Development of Nephrocalcinosis in Female Rats,” Journal of Nutrition, Vol. 132, No. 2, 2002, pp. 252-256.
- E. G. Bligh and W. J. Dyer, “A Rapid Method of Total Lipid Extraction and Purification,” Canadian Journal of Biochemistry and Physiology, Vol. 37, No. 8, 1959, pp. 911-917. doi:10.1139/o59-099
- M. W. Pfaffl, “A New Mathematical Model for Relative Quantification in Real-Time RT-PCR,” Nucleic Acids Research, Vol. 29, No. 9, 2001, p. e45. doi:10.1093/nar/29.9.e45
- J. C. Frölich, T. W. Wilson, B. J. Sweetman, M. Smigel, A. S. Nies, K. Carr, J. T. Watson and J. A. Oates, “Urinary Prostaglandins. Identification and Origin,” Journal of Clinical Investigation, Vol. 55, No. 4, 1975, pp. 763- 770. doi:10.1172/JCI107987
- N. W. Schoene, A. Ferretti and D. Fiore, “Production of Prostaglandins in Homogenates of Kidney Medullae and Cortices of Spontaneously Hypertensive Rats Fed Menhaden Oil,” Lipids, Vol. 16, No. 11, 1981, 866-869. doi:10.1007/BF02535044
- N. D. Perkins, “Integrating Cell-Signalling Pathways with NF-kappaB and IkB Function,” Nature Reviews Molecular Cell Biology, Vol. 8, No. 1, 2007, pp. 49-62. doi:10.1038/nrm2083
- J. X. Kang, K. H. Weylandt, “Modulation of Inflammatory Cytokines by Omega-3 Fatty Acids,” Subcell Biochem, Vol. 49, 2008, pp.133-143.
- J. A. Sayer, G. Carr and N. L. Simmons, “Nephrocalcinosis: Molecular Insights into Calcium Precipitation within the Kidney,” Clinical Science, Vol. 106, No. 6, 2004, pp. 549-561. doi:10.1042/CS20040048
- J. A. Wesson, R. J. Johnson, M. Mazzali, A. M. Beshensky, S. Stietz, C. Giachelli, L. Liaw, C. E. Alpers, W. G. Couser, J. G. Kleinman and J. Hughes, “Osteopontin Is a Critical Inhibitor of Calcium Oxalate Crystal Formation and Retention in Renal Tubules,” Journal of the American Society of Nephrology, Vol. 14, 2003, pp. 139-147. doi:10.1007/978-1-4020-8831-5_5
- L. L. Haut, A. C. Alfrey, S. Guggenheim, B. Buddington and N. Schrier, “Renal Toxicity of Phosphate in Rats,” Kidney International, Vol. 17, No. 6, 1980, pp. 722-731. doi:10.1038/ki.1980.85
- J. C. Woodard, “A Morphologic and Biochemical Study of Nutritional Nephrocalcinosis in Female Rats Fed Semipurified Diets,” American Journal of Pathology, Vol. 65, No. 1, 1971, pp. 253-268.
- H. Matsuzaki, M. Uehara, K. Suzuki, Q. L. Liu, S. Sato, Y. Kanke and S. Goto, “High Phosphorus Diet Rapidly Induces Nephrocalcinosis and Proximal Tubular Injury in Rats,” Journal of Nutritional Science and Vitaminology, Vol. 43, No. 6, 1997, pp. 527-641. doi:10.3177/jnsv.43.627
- H. Zajicek, H. Wang, V. Kumar, P. Wilson and M. Levi, “Role of Glycosphingolipids in the Regulation of Renal Phosphate Transport,” Kidney International, Vol. 61, 1997, pp. 32-35.
- OECD, “Summary of Considerations in the Report from the OECD Expert Groups on Short Term and Long Term Toxicology,” OECD Guidelines for the Testing of Chemicals, Vol. 2, Section 4, 1993, pp. 1-12.
NOTES
*Omega-3 Fatty Acid Effects on Kidneys.
#Corresponding author.