Food and Nutrition Sciences
Vol. 3 No. 9 (2012) , Article ID: 22308 , 5 pages DOI:10.4236/fns.2012.39175
A Pilot Study on the New USDA Meal Pattern for School Breakfast in a Sample of First-Grade Students
![]()
Department of Nutrition Science, Purdue University, West Lafayette, USA.
Email: *Kranz@purdue.edu
Received July 30th, 2012; revised August 30th, 2012; accepted September 7th, 2012
Keywords: School Breakfast; Meal Pattern; Intake Recommendation
ABSTRACT
Background: The United States Department of Agriculture (USDA) recently modified the school breakfast program (SBP) to improve children’s nutrition. Based on the new patterns, schools must offer larger amounts of fruits, grains, and proteins/meats to children; the amounts of fluid foods (milk and juice) remained the same. This study examined the effect of the new food pattern on student’s consumption and food cost. Methods: The amounts and cost of foods served and wasted for one week in first grade students attending two elementary schools (n = 812) were measured. One school received the current SBP pattern (control breakfast, average number of students attending breakfast n = 81), the other school’s breakfast reflected the proposed changes (test breakfast, n = 82). To test the hypothesis that the test breakfast leads to significantly increased food cost and food waste compared to the control breakfast, the weekly average amount of the served solid and fluid foods (grams and milliliters) as well as their waste were compared between the two groups using paired student’s t-test in STATA 11 (significance at p-value < 0.05). Results: Data confirmed the hypothesis in that the test breakfast was associated with significantly higher food cost (by approximately $100/week) and solid food waste but there was no change in milk and juice consumption. Conclusions: This exploratory study indicates that a significant portion of the additional foods served to first-graders to improve their nutritional status were not consumed but wasted. Further studies in larger samples and including students from all grades are needed to examine this issue fully.
1. Introduction
It has been established that eating breakfast improves children’s diet quality, health, school attendance and performance [1-3]. In 2010, the School Breakfast Program (SBP) served over 11.6 million children daily [4], amounting to $2.9 billion in cost, a significant increase from $1.9 billion in 2005.
The SBP was initiated with the Child Nutrition Act of 1966 to strengthen, expand, and extend the National School Lunch Program in order to safeguard the health and well-being of the Nation’s children, encourage domestic consumption of agricultural and other foods, and to meet more effectively the nutritional needs of children. The mandate for school breakfast was that it had to provide at least ¼ of the daily Recommended Dietary Allowances for energy, iron, calcium and vitamins A and C [5,6]. Today, children are less likely to under consume of foods but are at risk to adopt unhealthy eating habits, such as excess intake of foods with low nutrient density. The nutrients most commonly consumed at levels above the recommendations are total fat, saturated fat, and sodium [5]. To address this problem, the United States Department of Agriculture (USDA) changed the nutrition standards and meal requirements for breakfast in schools [7] and new nutrition standards for the SBP were proposed [8] to reflect the 2010 Dietary Guidelines [9] and the Institute of Medicine’s recommendation to limit sodium intake, thereby updating the food pattern, which had been based on the 1995 Dietary Guidelines for Americans and the 1989 Recommended Dietary Allowances [7]. Overall, the new SBP meal plan provides more fruits, vegetables, and whole grains; the milk served must be fat-free or low-fat milk and levels of sodium and saturated fat are reduced in the foods offered during breakfast at school [7]. Table 1 reflects the comparison between the former and the new SBP pattern guidelines.
The revised SBP pattern was developed based on a food-based menu planning strategy; as compared to the former nutrient-standard based menu planning strategy [7]. This methodological difference led to an increased in the amounts of food offered to each student, because schools must now meet a certain number of servings of MyPlate food groups.
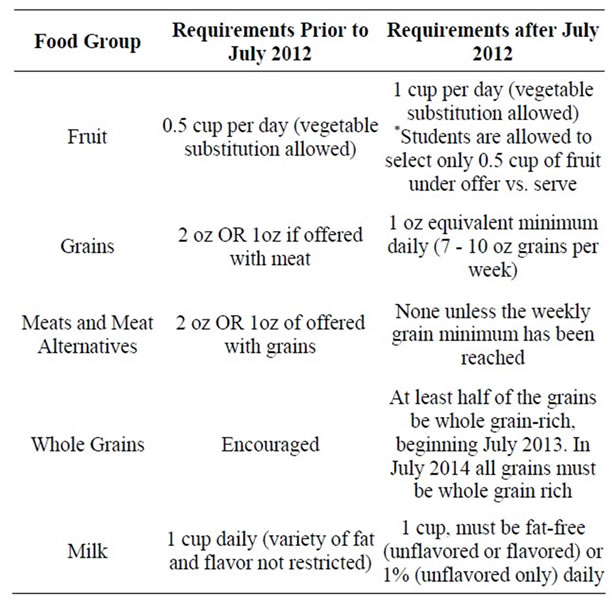
Table 1. Comparison between requirements prior to July 2012 and requirements after 2012.
The present study was developed to compare the former and the new school breakfast menu. We hypothesized that the cost of serving the new SBP pattern would be significantly higher than the previous pattern and that a significant amount of the additional food served would be wasted. Although the amount of fluid foods, milk and fruit juice, did not change in the new SBP menu, however, due to the potential for changes in the solid food consumption, analysis include the consumption of those two beverages.
It is important to point out that since completion of this study, the final rule for the nutrition standards of the SBP was released (January 26th, 2012) and that the pattern tested in this study was very similar to but not equal to that final ruling, in that the protein (or meat/meat alternative) portion of breakfast is optional and not required, as it had been in the proposed SBP pattern.
2. Methods
This study was designed to compare the average amounts of solid and liquid foods served and wasted to estimate the food cost and food waste cost for one week of SBP participation in a convenience sample of first-grade children attending one of two local elementary schools. The local Institutional Review Board for Human Research (IRB) approved this study.
2.1. Subjects
First graders at two elementary schools in the mid-West were examined. The two schools served universal free breakfast to children of the same age and had similar participation rates for school breakfast. Those students, who chose to participate in the SBP but who required food substitutions to accommodate food allergies or for religious reasons were excluded. In total, data for n = 812 students were included in the study.
2.2. Procedure
Two breakfasts reflecting the former (control) and the new (test) SBP patterns were developed. Menu items were kept as similar as possible. The control site’s breakfast menu included one entrée, 8 oz of fat-free milk and 4 oz of 100% juice, the test site’s breakfast menu included one serving of a grain, one one-ounce-equivalent of protein, one serving of fruit, 8 oz of fat-free milk, and 4 oz of 100% juice (Table 2).
As it is usual practice in the participating schools, breakfasts were served to the students in their classroom. During the week of the study, each child who chose to participate in breakfasts were asked to take all of the items offered on the menu. This procedure reflects the USDA’s guideline that participating children must take all but one food item offered at breakfast [10]. After children had completed breakfast and were finished eating all they wanted to eat, they put their solid food waste into plastic sacks which were sealed and returned to a designated bucket. Each student also poured any leftover milk or juice into separate designated containers. All waste containers were collected and weighed on 32- ounce food scales. Solid waste (grams of fruit and main
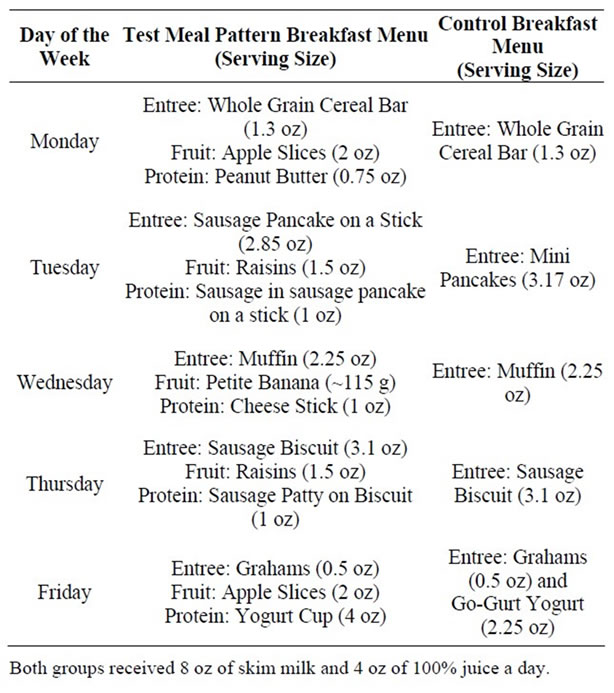
Table 2. Breakfast items served at the control and the test school.
entrées/protein servings)) were weighed; fluid waste was measured using measuring cups (milliliters of milk and juice). All waste was recorded daily and weekly averages calculated for each school separately.
2.3. Data Analysis
The weekly average amounts of solid and fluid foods served and wasted were calculated for each school and the cost for foods served and wasted estimated based on the paid price. Then, average food amounts and their associated costs were calculated per participating student in each school. The difference in the amount of food served and wasted and the difference in the cost of food and cost of waste were calculated for each school and per student in the schools were calculated using a paired two-sided student’s t-test. All data analysis was completed in STATA 11, level of significance was p < 0.05.
3. Results
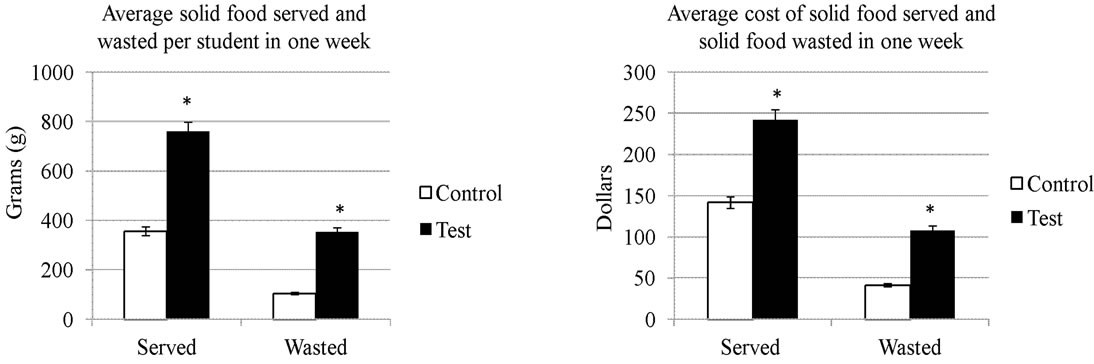
Throughout the week of study, a total of 812 students participated in the study, providing data on 812 eating occasions. The average daily SBP participation was n = 82 students at the test site and n = 81 students at the control site. Data analysis indicated that the test cohort consumed 54% percent of the food served while the control group consumed 71%. The amounts of solid food served and wasted as well as the cost for solid food served and wasted are reflected in Figure 1(a); the equivalent information for the fluid foods are in Figure 1(b).
As mandated by the new SBP pattern, the amount of solid food served increased compared to the former SBP pattern. Thus, the amount of food served and the cost for serving the breakfast foods significantly increased. In this sample, the amount of food wasted and the cost of the food waste was significantly increased by 80% in the test site compared to the control site. Although the amount of solid foods served had been significantly changed, there was no difference in the amount or cost of the fluid food served, consumed, or wasted. Thus, children did not replace any of the milk or juice by eating more.
The total cost of serving breakfast during the week of the study was increased by 38.6% in the test compared to the control group, an additional cost of $102.94 per week. Based on this information and assuming that 1) All school-weeks during the academic year would, on average, cost the same for all first-grade children enrolled in the school district and 2) The cost increased in a linear fashion for larger quantities of breakfasts served, the total predicted additional cost of providing breakfast to all first graders in this school district would be estimated at $29,506 per year.
4. Discussion
One of the major concerns warranting the update of the SBP by the USDA was the desire to improve children’s diet quality and thereby their health. The results from this study indicate that much of the additional food was eventually wasted in the study population. However, these results might vary in schools where SBP is only served to those, who are actively enrolled in the program rather than serving a universally free breakfast to all children. If a large proportion of students arrives at school without having had breakfast or a morning snack at home, it would be highly likely that much more the school breakfast would be consumed. The new SBP pattern only requires the increase of the solid food served, whilst the amounts of milk and juice remain the same. Interestingly, the children in this study receiving the test breakfast did not change the consumption of the beverages compared to the children in the control group. This finding should be investigated further, as it implies that children are not displacing any of the breakfast beverages with solid foods. It could also be an indication that children in the study were more thirsty than hungry in the mornings.
The cost for serving breakfast following the new SBP pattern were significantly increased compared to the previous menu pattern. Since the USDA is not providing additional funding to schools, this mandated change could potentially significantly affect the budgets of many school districts in the United States. However, larger studies in more and more diverse schools, using all grade levels and income-sensitive breakfast serving protocols (using free, reduced-price, and full-price) need to be conducted to complement or refute findings of this pilot study.
As mentioned before, the meal pattern implemented in the test group in this study was the version originally proposed version in the fall of 2011. The SBP menu included in the final ruling, to be implemented by schools by 2014, differed in that schools are not mandated to offer one one-ounce-equivalent of meat but must offer first a minimum of one one-ounce serving of grains every day and 7 - 10 ounces of grains from kindergarten to fifth graders every week [8]. A one-ounce-equivalent of meat may be substituted for a serving of grains after the minimum grains requirement has been met.
Due to the type and amounts of foods served in schools at breakfast or lunch, it can be assumed that providing SBP is typically less expensive than serving lunches. Since the food patterns for the National School Lunch Program were also changed, it stands to reason that those changes increase the cost for providing school lunch also. However, no data to support this assumption are available. As in all observational, community-based studies, this study has several limitations. Only consump-
 (a)
(a)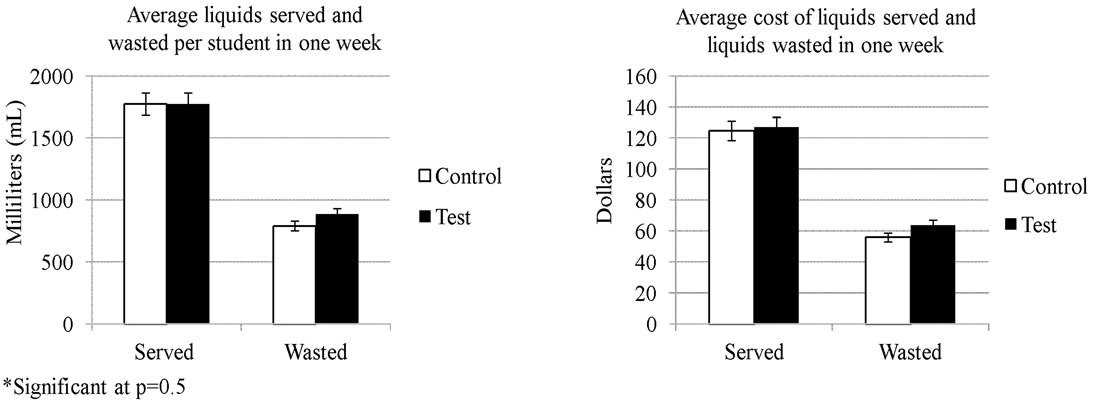 (b)
(b)
Figure 1. Average grams (and 95% CI) of solid food served and wasted per child for one week and cost of solid food and solid food waste for all students in one week (a) and average milliliters (and 95% CI) of liquids served and wasted per student for one week and cost of liquids and liquid waste for all students for one week (b) (p < 0.05).
tion patterns of elementary school children in two local elementary schools, serving universally free lunch were observed. Larger and more diverse samples and longer periods of observations might lead to other results. Also, some of the entrée items were only partial and selectively eaten. For instance, “sausage in a pancake on a stick”, the sausage link was very frequently eaten while the “pancake” part was wasted. In this study, only the daily totals of solid foods were weighed, thus, the differential effect of selective wasting of food items on diet quality could not be examined. Furthermore, some children might have had to accept the entire breakfast although they really only wanted the juice or milk. Lastly, this study was conducted in ten different classrooms with ten different teachers and although teachers were instructed not to encourage or discourage children to eat certain foods, the variation in individual classroom routines may have affected our results.
Despite the limitations, this study indicates that increasing the amounts of foods served in the SBP might not be the most efficient venue to improve children’s diet quality. If students don’t chose to eat all of the foods served and are selectively wasting the food, diet quality might actually decrease. The example of the “sausage in a pancake on a stick” illustrates this point perfectly, as children discarded the (whole grain) “pancake” but choose to eat only the high-fat and high-salt sausage.
Encouraging breakfast consumption is certainly beneficial to most children. However, more specific guidelines to promote the serving of healthy breakfast foods may be more advantageous to support the public health goal of improving children’s diet quality and reduce the risk for childhood obesity and other chronic diseases.
REFERENCES
- L. Dubois, M. Girard, M. Potvin Kent, A. Farmer and F. Tatone-Tokuda, “Breakfast Skipping Is Associated with Differences in Meal Patterns, Macronutrient Intakes and Overweight among Pre-School Children,” Public Health Nutrion, Vol. 12, No. 1, 2009, pp. 19-28. doi:10.1017/S1368980008001894
- A. M. Albertson, et al., “Consumption of Breakfast Cereal Is Associated with Positive Health Outcomes: Evidence from the National Heart, Lung, and Blood Institute Growth and Health Study,” Nutrition Research, Vol. 28, No. 11, 2008, pp. 744-752. doi:10.1016/j.nutres.2008.09.002
- G. C. Rampersaud, M. A. Pereira, B. L. Girard, J. Adams and J. D. Metzl, “Breakfast Habits, Nutritional Status, Body Weight, and Academic Performance in Children and Adolescents,” Journal of the American Dietetic Association, Vol. 105, No. 5, 2005, pp. 743-760. doi:10.1016/j.jada.2005.02.007
- United States Department of Agriculture, Food and Nutrition Service, “The School Breakfast Program,” 2011. http://www.fns.usda.gov/cnd/breakfast/AboutBFast/SBPFactSheet.pdf
- E. Kennedy and C. Davis, “US Department of Agriculture School Breakfast Program,” American Journal of Clinical Nutrition, Vol. 67, 1998, pp. 798S-803S.
- United States Department of Agriculture, “Menu Planning in the School Breakfast Program,” 2005. http://www.fns.usda.gov/cnd/Breakfast/Menu/sbp-planning-approaches.doc
- United States Department of Agriculture, Food and Nutrition Service, “Nutrition Standards in the National School Lunch and School Breakfast Programs: Proposed Rule,” 2011. http://www.fns.usda.gov/cnd/breakfast/AboutBFast/SBPFactSheet.pdf
- United States Department of Agriculture, Food and Nutrition Service, “Nutrition standards in the National School Lunch and School Breakfast Programs. Final Rule,” Federal Register, Vol. 77, No. 17, 2012, pp. 4088-4167.
- United States Department of Agriculture, Department of Health and Human Services, “Dietary Guidelines for Americans 2010,” 2011. http://www.health.gov/dietaryguidelines/dga2010/DietaryGuidelines2010.pdf
- United States Department of Agriculture, Food and Nutrition Services, “Nutrition Standards in the National School Lunch and School Breakfast Programs. Final Rule,” Federal Register, Vol. 77, 2012, pp. 4099-4100.
NOTES
*Corresponding author.