Food and Nutrition Sciences
Vol. 2 No. 6 (2011) , Article ID: 6627 , 10 pages DOI:10.4236/fns.2011.26093
Projective Mapping and Product Positioning of Deep Fat Fried Snack
![]()
Department of Sensory Science, Central Food Technological Research Institute, Mysore, India.
Email: ramasamyravi@yahoo.com
Received May 17th, 2011; revised July 28th, 2011; accepted August 5th, 2011.
Keywords: Deep-fried snacks, texture, e-nose, sensory profiling, product positioning, PCA, QDA, CIE
ABSTRACT
A study was carried out to examine the quality parameters of commercially available popular deep-fried snack-Murukku. Eight samples (four spicy and four salty) of most commonly consumed deep-fried snacks in India, viz., murukku (an extruded strands-like product made from the mixture of rice flour and black gram dhal flour) were analyzed for moisture, oil content, CIE instrumental color (L*a*b*), instrumental texture measurement (breaking strength of murukku strands), aroma finger printing by electronic nose and sensory quality. Quantitative descriptive analysis (QDA) and results showed that sample “A” had highest acceptance and sample D lowest acceptance scores. The results indicated that significant variations were observed in moisture content (2.21% - 3.35%), oil content (30.10 - 34.61%) and textural parameters. Electronic nose technique was found useful in fingerprinting the aroma pattern of market samples in a short time. Descriptive sensory profiling coupled with principal component analysis showed the interrelationship among and between sensory, instrumental, chemical parameters.
1. Introduction
The Webster’s new ninth collegiate dictionary defines the noun “snack” (first recorded use, 1757) as a light meal, food eaten between regular meals, food suitable for snacking and the verb snack refers as to “eat a snack” [1] Many researchers define snack food as “food eaten between regular meals”. Health-driven consumers demand for healthy, low fat, low-calorie, organic, fiber-rich, vitamin, mineral fortified snacks, while others demand for diverse taste and flavor profiles to quench their indulgent carvings. Markets have shifted their focus on producing snacks with unsaturated fats, omega-3 fatty acids and anti oxidants. Snacks are produced that are organic, vitamin and mineral rich, low fat and calorie, high fiber content. Nut snacks and health bars have made healthy gains. Many products have got heightened nutrient tags, making it completely safe and healthy. Features like easy “onthe-go” portable packs, such as stand-up pouches, single serve or bite-sized packs, resealable bags, and fingerhugging canisters, which add a new dimension to the convenience foods, which is expected to have a potential commercial success.
Indian snack food market, is one of the largest markets in the world, with a value of Rs. 1530 crore and out of which potato chips holds the market share of ~85%. Continuous innovations in flavors, and tastes, especially exotic, and sophisticated flavors, are expected to help the market score huge gains in the upcoming years [2].
Indian market is so diverse and large with over 1,000 different snack products and almost 300 types of savory items. Potato based snacks and potato chips, are the largest segment, holding an 85%-share in the salty snack market, followed by snack nuts, chickpeas and other pulse-based savory snacks. Organized retail chains have high demand for popcorn, diet snacks (soy nuts, bread sticks), breakfast cereals, baked & roasted snacks (biscuits, specialty breads, chocolate coated snacks, cookies etc.) and cheese snacks. In India, a number of snack foods items are prepared from a different raw materials like besan (Bengal gram flour), maida (refined wheat flour), Urd (black gram) dhal, moong (green gram) dhal, alone or in combination with other cereals, legumes/ pulses.
Almost, all the Indian traditional snack foods are prepared from cereals, legumes and spices. Their manufacturing processes may include cleaning, pretreatment, soaking, roasting and frying etc. Some of the manufacturing steps can be very essential from the nutritive point of view, like parboiling, the preliminary treatment used in manufacturing pohe and murmura. The step ensures the dissolution of the nutritious sticky layer between the husk and the grain, which further leads to the movement of nutrients from the aleurone layer to the grain and retention of the shape of the grain. Finally, it results in the product with higher nutrient content than milled rice made from same paddy. Thus, these products are proved valuable sources of protein, thiamine and other micronu-trients in the diet.
Murukku is famous in India with different names like chakli in Marathi and Kannada and chakri in Gujarat and murkoo in Tamil. Murukku is also popular snack in Srilanka, Fiji and elsewhere among ethnic Indian populations. It is made from a mixture of Urad (Black gram), rice flour, salt, and flavourings such as chili, asafoetida, ajawain or cumin. A paste made from rice powder is squeezed out in different shapes and fried in oil. Crunchy murukku in the shape of small coils are the most common in southern India. The pulse, rice flour mixture is made into a batter, mechanically extruded, formed into a spiral or coil, and fried to a crisp. Murukku can also be rolled into a flat ribbon (ribbon Murukku) or shaped by hand (kai Murukku). Murukku is traditionally enjoyed for its crisp texture and taste.
Texture profile and consumer acceptability of defatted soy flour substituted Indian snacks like Murukku, Nankhatai and Mysore pak was reported [3]. They observed that there is no significant effect on the breaking strength of Murukku upon the addition of 25% defatted soy meal with chick pea having sensory overall quality at acceptable level for all the products. Acceptability and stability of crude palm oil (CPO) in a number of traditional Indian foods like Murukku, suji halwa, upma, and cake was also reported [4]. Results showed that repeated frying of foods with crude palm oil is not good as rapid decline in beta carotene content and development of off flavour takes place.
Sensory evaluation of foods prepared in crude palm oil, showed that Murukku and suji halwa prepared with crude palm oil was more acceptable [5]. Murukku, being a deep fat fried product had high beta carotene retention. Recipes prepared with a 1:1 blend of ground nut oil and crude palm oil were also of acceptable quality than recipes prepared from ground nut oil (alone) and refined palmolein oil.
Ravi [6] studied the rheology of chickpea flour dispersions and its deep fat fried product “Boondi”. By using experimental design coupled with response surface methodology (RSM), he optimized the frying conditions for making boondi [7]. Sensory profiling of “Boondi” was also reported [8] using quantitative descriptive analysis (QDA). Texture measurement of crisp snack foods using texture analyzer was reported [9].
Based on the review of litrerature, it is evident that no systematic study has been reported so far on the sensory profiling of Murukku using standard sensory methods. More over, the quality aspects on market samples has not been reported in detail and their market positiong details were also lacking. This present research objectives were 1) to profile the murukku samples sensorily along with their other physico-chemical quality parameters; 2) to extablish the correaltion between the various qualiy parameters and sensory profile; 3) positining of murukku samples by employing principal componet analysis (PCA) to study their underlying relationships between sampleas and attributes.
2. Materials and Methods
Eight murukku samples of 50 pieces of each were procured from the local market of Mysore. The samples include two branded and six unbranded. Among the samples four were spicy, and the remaining four were salty.
2.1. Physico-chemical Parameters
2.1.1. Density Analysis
Known weight of sample was placed in a 100 ml measuring cylinder and filled with sand. The difference in volume was calculated and expressed in g/ml as density. Five replicates were done and average was reported.
2.1.2. Moisture and Fat Analysis
Moisture and oil content of the murukku samples were determined using standard [10,11] method on triplicate samples and average was reported.
2.2. Instrumental Colour Measurement
Colour measurement of Murukku was done by using a Hunter colour measuring system (Hunter Associates Laboratory, Reston, VA 20190-5280, USA, Model: LabScan XE) and expressed in terms of L*, a*, b*, according to the CIE method [12]. The average of three replicates for L*, a*, b*, was reported. L* represents the brightness from white (100) to black (0). Red to green color component was indicated by the a* values and yellow to blue color components were indicated by the b* values. One of the important attributes of colour is the hue. The hue is the attribute of visible sensation which gives rise to colour names-violet, blue, green, orange, red, purple etc. This is an approximate physico-sensorial equivalent to the dominant wavelength. The graphical representation of the hue variations can be represented by a circle called colour circle.
2.3. Instrumental Texture Analysis of Murukku
Texture of Murukku was measured using a texture analyzer (Stable Micro Systems, Surrey, UK Model: TAHDi,) and for the analysis compression method was used. Breaking strength of strands was performed with three point bending probe with a crosshead speed of 0.5 mm/sec, using 50 Kg load cell. The force required to break the strands are reported in Newton (force vs time). Texture measurements were performed in five replicates and average values were reported.
2.3.1. Aroma Analysis by Electronic Nose
E-nose system (Alpha MOS, Toulouse, France) with the following specification was used for aroma analysis
• Model: α-fox 4000 with 18 metal oxide sensor array system;
• Sample injection by air tight syringe using sampling vials;
• Air flow using zero air generator.
2.3.2. Method
Three gram of each samples were weighed accurately and taken in fixed capped vial (sample bottle) provided by the manufacturer. The aroma analysis was conducted under the following conditions.
• Acquisition time(s): 120
• Acquisition period(s): 1
• Acquisition delay(s): 500
• Flow ml/min: 150
• Injection in volume, micro liter: 500
• Injection speed: 500
The samples were run in 5 replicates and the sensor responses are recorded in the system. The sensor responses obtained were subjected in to multivariate statistical analysis. Data analysis was done based on the maximum change in resistance (ΔR)/ΔR0 of the sensors by computing principal component analysis (PCA) using the soft ware supplied by the manufacturer. The results were presented in the form of PCA plots.
2.4. Sensory Analysis
The selected panel consisted of 10 judges from sensory science department who regularly participated in sensory analysis studies and had experience in profiling food products were selected as sensory panel members. Sensory descriptors were developed during initial session by panelists. Each member was asked to describe samples with as many spontaneous descriptive terms as they found applicable. The common descriptors chosen by at least one third of the panel were compiled along with some impact descriptors for preparation of scorecard.
Sensory evaluation was conducted in two sessions in individual sensory booth rooms at the department of sensory science. In first session, sensory evaluation for spicy Murukku samples was evaluated and in the next session another four salty Murukku samples were analyzed. Samples were served in glazed china plates, coated with three digits random numbers. Prior to the sensory evaluation, description about the each sensory attributes with their standards explained to the panel in briefing room. The samples were presented to the panelist one by one for evaluation and samples were served to the panelists. Warm water and puffed rice were provided along with sample for palate cleaning.
Quantitative Descriptive Analysis (QDA)
Qualitative descriptive analysis was selected to evaluate Murukku samples as developed [13]. The QDA technique uses trained panelists to identify and quantify sensory properties of a product in order of perception e.g. appearance, odor and taste etc. the basic steps of this method include development of repeated measurements, use of line scale and analysis of results by parametric statistics. QDA makes replication and statistical analysis of data mandatory. Another specification is that a line scale be used instead of category scaling. An anchor point in middle of scale was originally included as an optional feature. Scorecard developed for QDA had 0 to 15 cm scale with descriptors anchored at either end for detection. Panelists asked to mark on scorecard striking a vertical line at appropriate place for the attributes. The scorecards were decoded and mean scores of attributes were calculated. The typical attributes of “Murukku” and the definitions are given in Appendix.
2.5. Statistical Analysis
Statistical significance between and among variables were done using Duncan’s New Multiple Range test (DMRT) [14] and Principal component analysis was done to explore the underlying relationship between sensory attributes and other physico-chemical properties of the samples. Descriptive statistics, linear correlations, correlations and Principal component analysis (PCA) calculations were performed using Statistica V5.5 from StatSoft, USA for identifying attributes causing significant difference among the samples.
Principal Component Analysis (PCA)
Principal Component Analysis (PCA) is the statistical technique used to recognize the smallest number of latent variables, called “principal components,” which determines the greatest amount of observed variability. Generally it is possible to determine as much as 75% to 90% of the total variability in a data set consisting of 25 to 30 variables with as few as 2 to 3 principal components [15]. PCA basically analyze the correlation matrix of the variables. PCA used to analyze the correlation structure of a group of multivariate observations and provides the axis along which the maximum variability in the data occurs. The axis along which maximum variability in the data occurs called the first principal component. The second principal component is the axis along which the greatest amount of remaining variability occurs, subjected in such a manner that the axes must be perpendicular (at right angles) to each other (i.e. orthogonal or uncorrelated). For the description among the original variables, PCA can be used to display the relative “locations” of the samples. PCA provides a way to summarize data collected on a large number of variables in fewer dimensions. It is tempting to ask if it is necessary to continue to evaluate all of the original variables as opposed to only a few “representative” ones. Number of variables that are studied in should not be reduced based on PCA results.
3. Results and Discussion
The diameter of murukku strands was measured using a Vernier caliber and it ranged from 5.76 - 7.66 mm. The weight of samples also varied widely and significantly from 8.97 to 22.73 g/sample for Sample C and E respecttively. (Table 1). The density values ranged from 0.58 - 0.79 g/cc3 indicating wide variation among the samples. Sample H had the highest and Sample G had the lowest density values. Density depends upon the ingredients used and the water used during processing, air incorporation during the dough/batter preparation, frying conditions like frying oil, temperature, duration etc.
3.1. Chemical Analysis
3.1.1. Moisture Analysis
The moisture content of the samples were in the range between 2.21% - 3.35% (Table 1). Sample E had highest moisture content of 3.35% and had less crispiness compared to other samples. Sample B has low moisture content 2.21% and had a very crispy texture.
3.1.2. Oil Content
The oil content of the samples varied significantly from 30.10% to 34.61%. Among these samples, sample B was found to have low oil content (30.10%) and sample A had high oil content (34.61%). Variation in fat content of the product depends on the key ingredients added to the product.
3.2. Instrumental Colour Measurement
3.2.1. Lightness (L*)
Lightness as indicated by L* values, which found to be high (59.10) for sample “F”, indicating the low buff/ brown among the samples tested. Generally the lightness increased from sample B to sample F from 47.30 to 59.10 respectively. The wide range in lightness values observed for the samples test may be due to the ingredients/formula used or due to the processing conditions such as frying time and temperature. In some cases, the frying medium also imparts color to the product, such as high pigmented oils.
3.2.2. Red-Green Colour (a*)
The red to green color component as indicated by a* also showed wide variations in their values. The values varied from –0.7 to 16.30 (Figure 1) for samples F and B, respectively. The variation in a* values may be due to the presence of chili powder used in the formula for product preparation. If the product formula contains only flour(s) then the values tend to be in lower category.
3.2.3. Yellow-Blue Colour (b*)
Yellow to blue colour component is expressed on the
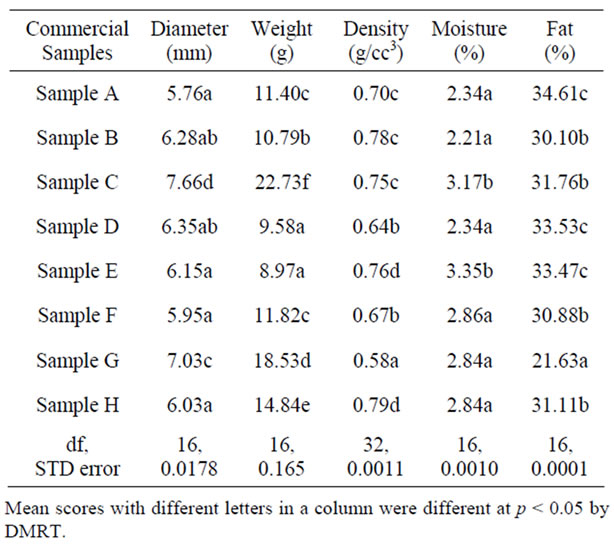
Table 1. Quality parameters of Murukku.
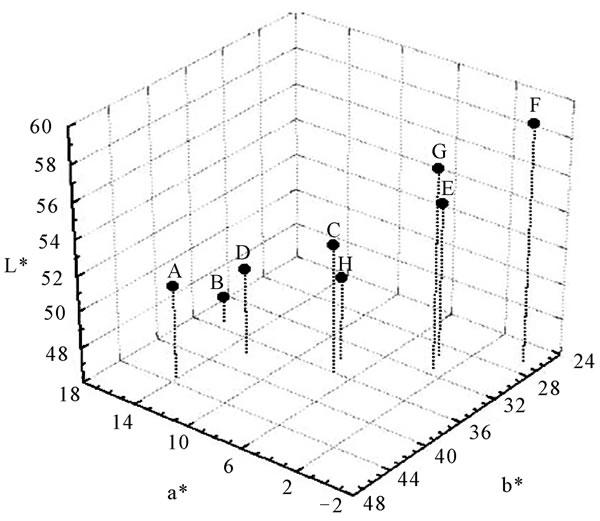
Figure 1. Instrumental colour measurement: 3D plot of CIE colour parame-ters of Murukku samples.
y-axis of the graph (Figure 1). Sample A has the highest b* value (43.30) indicating more yellowness and Sample F had lowest b* value (26.40) indicating the lowest yellow colour among the samples.
3.3. Other Color Parameters
The ΔE, ΔC, ΔH, and ΔY, were calculated from the differences in energy, chroma, hue and brightness (Table 2) when compared to standard white. All these parameters indicate the total colour differences of the Murukku samples from the standard white, represented in a three dimensional space.
3.4. Instrumental Texture Analysis
The texture analysis of Murukku samples were analyzed using three point bending probe. The peak force required to break murukku strand was in between 0.72 to 4.65 N (Table 3) recorded for the samples. Sample F was found very hard with a maximum peak force of 4.65 N, while sample C has lowest peak force (0.72 N) indicating the softer texture. A typical force deformation curves recorded for various murukku samples were represented in Figure 2.
3.5. Electronic Nose Aroma Profile of Murukku
The PCA plot of Murukku samples is depicted as Figure 3, where first and second principal components (PC’s) accounted for 38.62% and 16.77% respectively. They together accounted for ~55.39% of the total variance of the data. From the PCA plot, it can be visualized that even though the aroma pattern of four spicy Murukku samples (A, B, C, D) were slightly varied, but did not differ significantly as the clusters did not overlap with
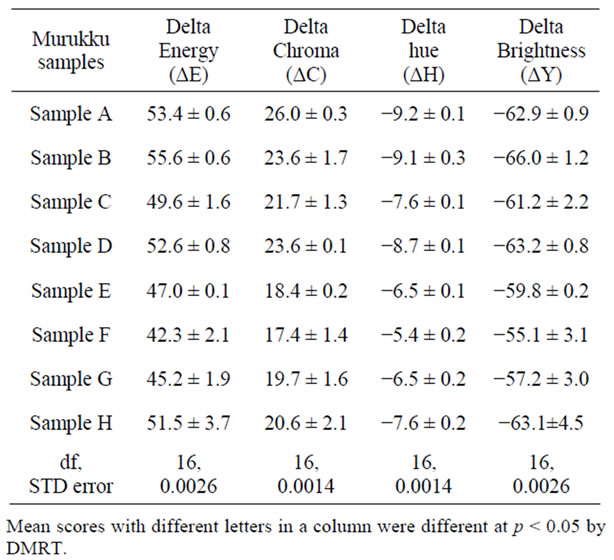
Table 2. Instrumental colour parameters of Murukku.
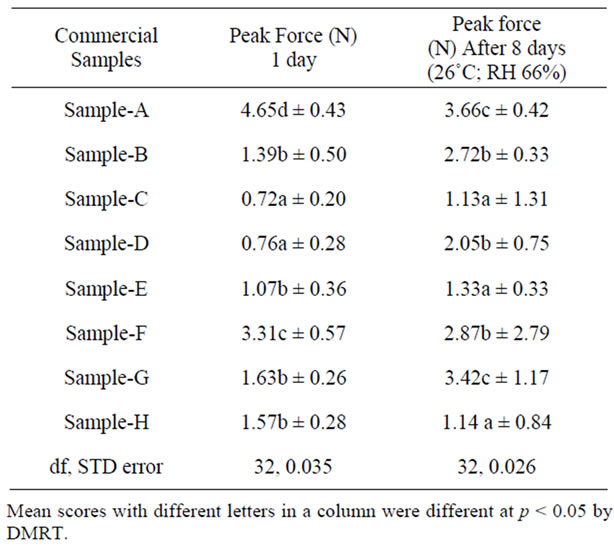
Table 3. Instrumental texture parameters of Murukku.
each other. The differences in aroma pattern were not significant from each other. These subtle differences were due to the presence of spices and ingredients used in the product formulation/preparation. On the other hand, the non spicy Murukku samples (E, F, G and H) were also not significantly different from each other. The non spicy Murukku samples were also followed the same trend as observed for spicy samples (Figure 4).
3.6. Sensory Profile of Murukku Sample
The colour scores were not significantly different for spicy-samples (A, B, C, and D) and the scores were in between 10.18 and 10.82 (Table 4) indicating that the samples were more red in colour may be due to the addition of chilli power in the formula. On the other hand, non-spicy samples (E, F G and H) showed greater variation and the colour scores varied from 4.63 to 10.07 for sample F and G, respectively. This significant difference in colour may be attributed to the ingredients used, their composition, processing temperature and time.
Significant variations in appearance score (8.50 - 10.17) were observed for samples. Among the spicy category, sample D scored maximum score of 10.17 while sample G scored maximum score of 9.09 in non-spicy category. Surface characteristics were also among the spicy category, sample D scored maximum score of 10.17 while sample G scored maximum score of 9.09 in non-spicy category. Surface characteristics were also showed significant variations (Table 4) among samples tested. The significant variations may be due to the type of die used for shaping the product, product formulations and frying conditions followed. Biting force provides the first impression about the product. Large and significant varia-
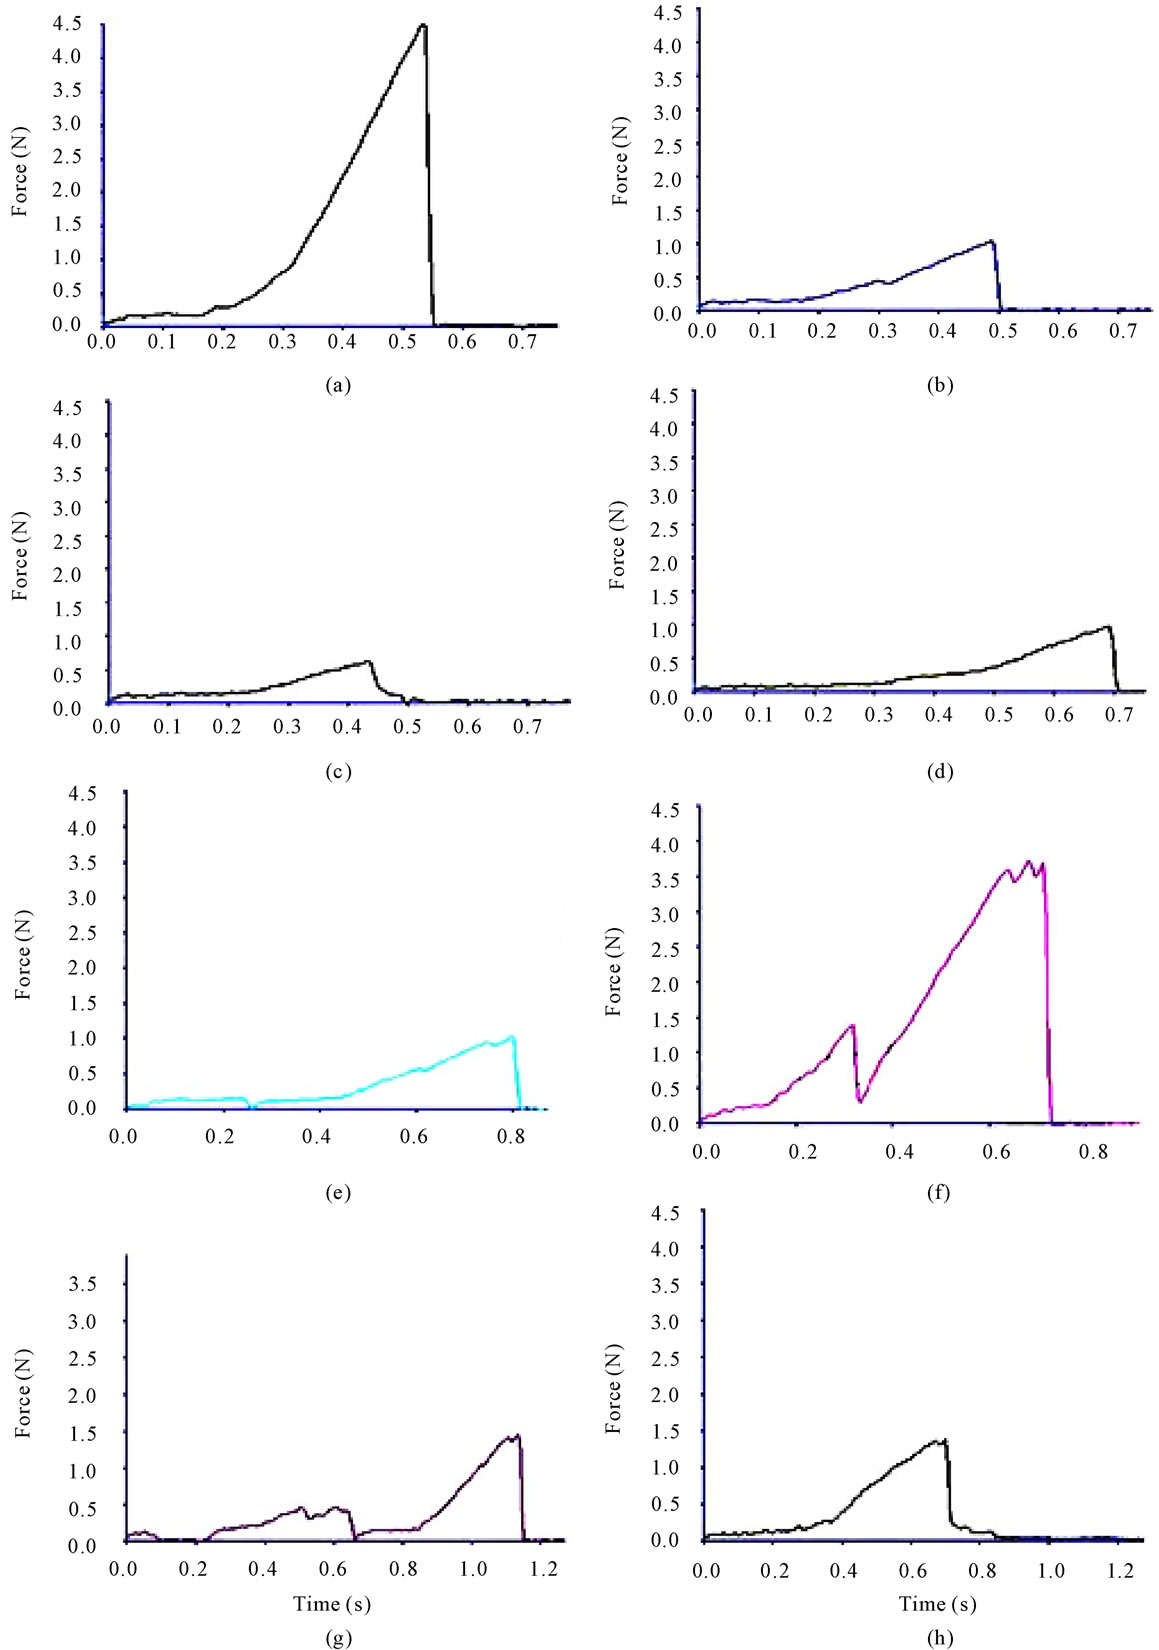
Figure 2. Instrumental texture analysis: force deformation curves of Murukku samples.
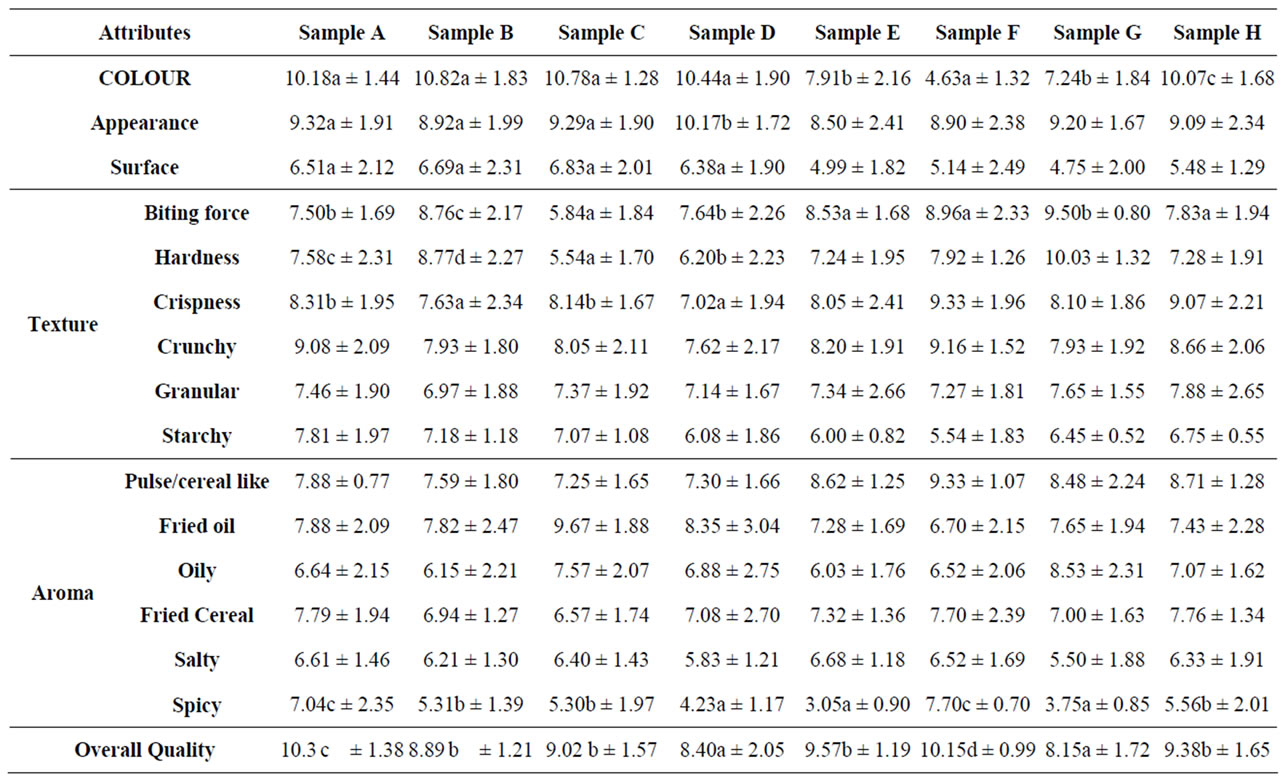
Table 4. Mean scores of sensory attributes for commercial Murukku samples.
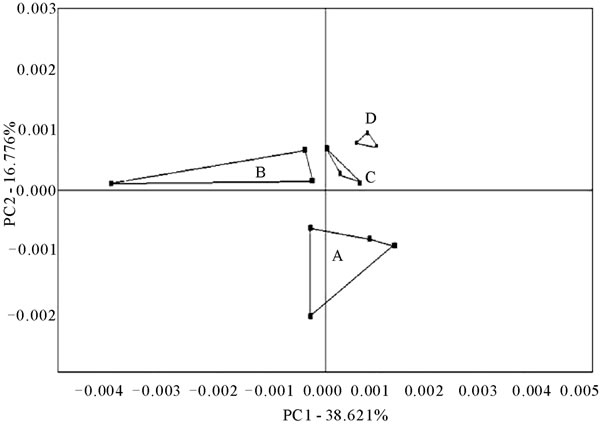
Figure 3. Aroma analysis by electronic nose: PCA plot of spicy Murukku samples.
tions (5.84 - 9.50) in biting force values may be due to processing conditions (Table 4). Hardness, crispness and crunchiness values also varied significantly from 6.20 - 10.03, 7.02 - 9.33, 7.62 - 9.08 (p ≤ 0.05) respectively.
Water addition in the product formulations greatly affect the hardness and crispness values and variation in crunchiness in Murukku may be attributed due to longer or short frying time of samples. Granularity of the product was related to particle size of ingredients that were used in dough prepared for the preparation of Murukku
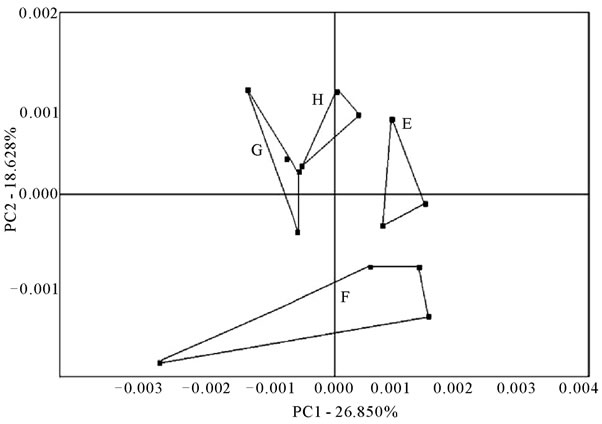
Figure 4. Aroma analysis by electronic nose: PCA graph of salty Murukku samples.
samples. Starchy perception is mainly due to the addition of cereal flours which are high in carbohydrates. This ratio between pulse and cereal flours also significantly affected the pulse/cereal like attribute. Fried oil and frying conditions influence the product quality to a greater extent. These conditions also affect the other attributes like oily, fried cereal etc., Attribute saltiness will be perceivable more when the product contains no chilli or spice in their formula and spicy note will be dominant when the formula contains chilli powder.
Overall Quality
Overall quality provides an overall perception about the product in a single score. Among the spicy category sample A had a maximum score (10.31) and was found most acceptable (Table 4) and sample D scored lowest score of 8.40 and found least acceptable. In the salty category sample F had scored maximum score (10.15). All sensory profile descriptors with mean score for salty and spicy samples were presented in Table 4.
3.7. Correlation between Sensory Physicochemical and Instrumental Parameters
Correlation coefficient values between sensory, instrumental, physico-chemical characteristics were computed. Positive significant correlation was found between color and surface characteristics (0.73) and surface characteristics were highly correlated with fried oil aroma (0.72) and negatively correlated with pulse/cereal like attributes (−0.86). As expected, initial biting force was positively correlated with hardness (0.87). Attribute crispiness is highly correlated with crunchiness (0.84) and pulse/cereal like (0.79) while crunchiness positively correlated with fried cereal aroma and spicy notes. Positive correlations were found between crispness and crunchiness (0.84). Sensory overall quality was found highly correlated with instrumental peak force 1 (0.75).
3.7.1. Principal Component Analysis of Sensory Attributes
The PCA bi plot of sensory attributes was presented as Figure 5. Principal component axis 1 (PC 1) accounted for 46.25%, while PC 2 accounted for 38.25% of the total variance. The attributes are evenly distributed along with samples associated. Samples E, G were more associated with crisp, fried cereal and crunchy and spicy notes. On the other hand sample F was more with oily note followed by overall quality, hardness and biting force.
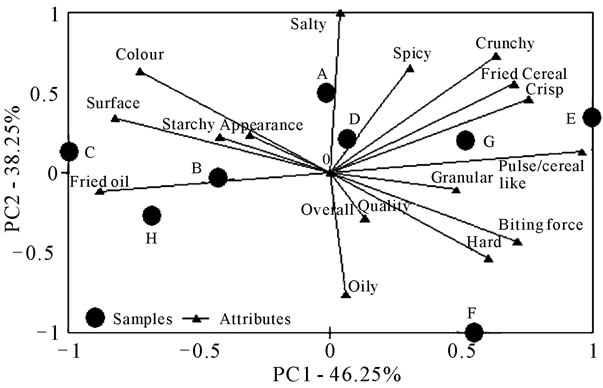
Figure 5. PCA graph of sensory attributes for Murukku samples (PC1 vs PC2).
Samples B, C, H formed a cluster on the negative side of the X-axis, characterized with fried oil aroma, surface, appearance and colour attributes.
PC 1 vs PC 3 of sensory attributes was presented as Figure 6. PC 1 and PC 3 accounted for 46.25% and 22.25% respectively, of the total variance and they together explain to about 68% of the total variance. As observed in Figure 6 samples B, C and H were classified with surface, fried oil, colour attributes and another cluster formed by samples E, F and G were more associated with crunchy, crispy notes, initial biting force, fried oil aroma, hardness followed by pulse/cereal like notes. Sample A and D correlated in with overall quality and appearance notes respectively.
3.7.2. Principal Component Analysis of Physico-chemical, Instrumental and Sensory Attributes
In order to explore the interrelationship between instrumental, physicochemical and sensory attributes, principal component analysis was done by normalizing the values with their respective standard deviations. In Figure 7 PC 1 accounted for 49.50% while PC 2 accounted for 29.42% of the total variance. Samples B, D and A were
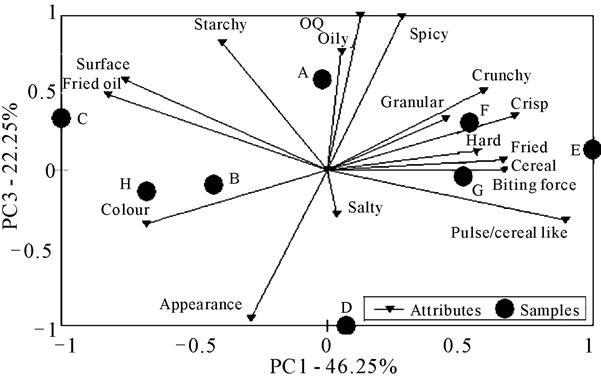
Figure 6. PCA graph of sensory attributes for Murukku samples (PC1 Vs PC3).
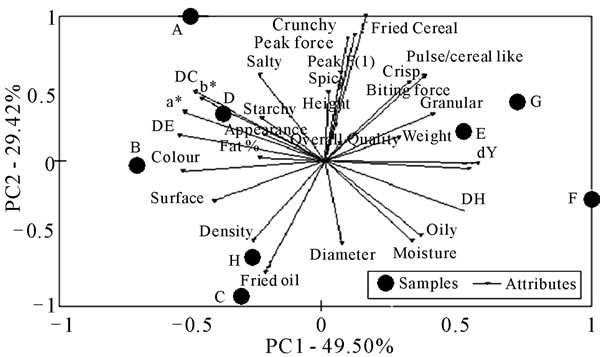
Figure 7. PCA graph of sensory, physico-chemical and instrumental parameters for Murukku samples.
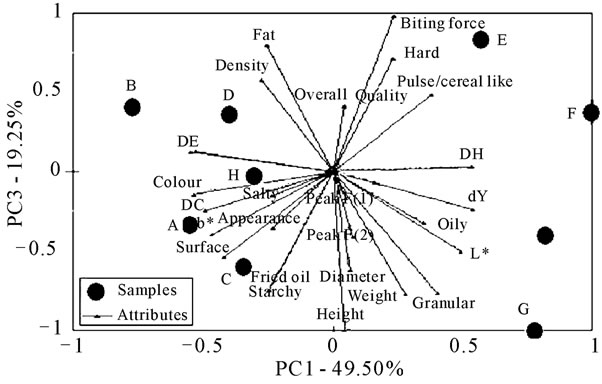
Figure 8. PCA graph of sensory, physico chemical and instrumental parameters for Murukku samples.
highly associated with instrumental colour parameters, while instrumental texture parameters like peak force 1 and peak force 2 were associated with samples E and G.
Principal axis 3 (PC 3) accounted remaining variance to about 19.25% of the total variance (Figure 8).
It is evident from the figure that overall quality, hardness and biting force were closely associated with each other and also with sample E. Fat content, density parameters were mostly associated with samples B, D and H. From the above discussion it is clear that principal component analysis was found to be very convenient method for characterizing market samples.
3.8. Conclusions
Results indicated that large and significant variations in quality characteristics of murukku were observed among the market samples (p ≤ 0.05). Moisture and oil content varied significantly among the samples. Electronic nose technique was found useful in fingerprinting the aroma pattern of market samples in a shorter time. Descriptive sensory profiling coupled with principal component analysis could be used to study the interrelationship among and between sensory, instrumental, chemical parameters. PCA revealed that among many quality indices, sensory qualities play a crucial role in market success of a product. Market success depends on many factors, among these, desirable quality attributes and consistent qualities determine the market leader. Hence it is important, not only to produce food products with desirable sensory attributes and also with consistent quality.
REFERENCES
- E. W. Lucas, “Snack foods processing,” Technomic Publishing. Co., Lancaster, 2001.
- MOFP, Ministry of food processing, India, 2011. http://mofpi.nic.in/ContentPage.aspx?CategoryId=186
- P. Sharma, G. S. Chauhan, P. Awasthi and M. S. Usha, “Texture Profile and Consumer Acceptability of Defatted Soy Flour Substituted Traditional Foods,” Journal of Food Science and Technology, Vol. 29, No. 5, 1992, pp. 322-323.
- R. Manorama and C. Rukmini, “Crude palm oil as a source of beta carotene,” Nutrition Research, Vol. 12, Supplement 1, 1992, pp. S223-S232.
- R. Manorama and C. Rukmini, “Sensory Evaluation of Foods prepared in crude palm oil,” Journal of Food Science and Technology India, Vol. 29, No. 1, 1992, pp. 70-72.
- R. Ravi, “Rheology of Chickpea (Cicer arietinum L.) flour suspensions and characterisation of fried productBoondi,” PhD Thesis, University of Mysore, Mysore, 2007.
- R. Ravi and N. S. Susheelamma, “Simultaneous optimization of a multi-response system by desirability function analysis of ‘Boondi’ making—a case study,” Journal of Food Science, Vol. 70, no. 8, 2005, pp. S539- S547.
- R. Ravi, B. S. Roopa and S. Bhattacharya, “Crispness measurement Analysis of the uniaxial compression textural attributes of crisp-snack foods,” Journal of Texture Studies, Vol. 38, No. 1, 2007, pp. 135-152.
- R. Ravi, Maya Prakash and D. Rajalakshmi, “Relationship between sensory and instrumental texture profile of jamun and positioning samples,” Journal of Sensory Studies, Vol. 17, No. 1, 2002, pp. 29-41. doi:10.1111/j.1745-459X.2002.tb00330.x
- AOAC, “Association of Official analytical chemists. Official methods of analysis,” 14th Edition, Washington DC, 1984.
- AOAC, “Official Methods of Analysis,” 16th Edition, Association of Official Analytical Chemists, Washington DC, 1995.
- CIE, “Commission internationale de l’éclairage,” 1976. http://www.cie.co.at
- H. Stone, J. L. Sidel, S. Oliver, A. Woosley and R. C. Singleton, “Sensory Evaluation by Quantitative Descriptive Analysis,” Food Technology, Vol. 28, No. 11, 1974, p. 24.
- D. B. Duncan, “Multiple range and multiple F tests,” Biometrics, Vol. 11, No. 1, 1955, pp. 1-42.
- J. J. Piggott and K. Sherman, “Methods to aid interpredation of multivariate data,” In: J. R. Piggott, Ed., Statistical procedures in food research, Elsevier applied science, London, 1986.
Appendix
Colour: the exact range of color of the sample perceived by naked eye or through transparent glass in the natural/white light. In the case of Murukku it ranges from creamish to pale brown.
APPREARANCE
Smooth: possessing the textural property manifested by an absence of detectable solid particles.
Rough: the inherent, fine, closely-spaced irregularities created by the production process.
Surface: dry-oily: the surface characteristic of the product.
TEXTURE
Biting force (First): the force required to break the sample on the first bite.
Hard: possessing the textural property manifested by a high resistance to deformation by applied force.
Crisp: possessing the textural property manifested by a tendency to crack, fracture or shatter without substantial prior deformation on the application of force.
Crunchy: possessing the textural property manifested by a tendency to break down easily in to small, irregular particles.
Granular: the amount of irregularity or fine grain particles which can be seen or felt by applying force on the surface of the product.
Starchy: characteristic of typical rice/wheat flour.
AROMA
Pulse/Cereal like: those aromatics or volatiles which are derived from various grains after gently heating (toasting), boiling or frying.
Fried oil: aroma strength due to volatiles released from hot vegetable oil during frying or cooking.
Oily: special aroma characterized by presence of vegetable oil.
Fried cereal: the aromatics or volatiles which are derived from various grains after frying.
Salty: the aroma strength of salt perceived by inhalation of aroma released through product.
Spicy: the aroma strength of spices perceived by inhalation of volatiles released from samples.
OVERALL QUALITY
This is not a sensory attribute but it provides the overall impression or quality of the sample in one score.