American Journal of Plant Sciences
Vol.3 No.1(2012), Article ID:16621,6 pages DOI:10.4236/ajps.2012.31020
Prediction of Landscape Pattern of Soft Sandstone Area (SSA) after Seabuckthorn Planting
![]()
China National Administration Center for Seabuckthorn Development, Beijing, China.
Email: bfuswc@163.com
Received April 28th, 2011; revised July 1st, 2011; accepted August 1st, 2011
Keywords: Landscape; Pattern; Markov Model; Prediction; Seabuckthorn; Soft Sandstone Area (SSA)
ABSTRACT
As a pioneer plant in the gully slopes in the Soft Sandstone Area (SSA) for eco-economical consideration, ten years (1999-2008) planting of seabuckthorn has made 1642.83 km2, or 9.84%, of the total area of SSA change into seabuckthorn coverage. In SSA the landscape has been divided into 9 types, such as seabuckthorn, sand, water, settlement, bush, open vegetation, forest, grassland and unused land. Seabuckthorn type is separated from the bush type for estimating the role of seabuckthron planting. By means of the Markov model, the developing trends of every landscape types can be determined to support the seabuckthorn project which influences the landscape pattern deeply in SSA. The prediction shows that the optimism ratio of seabuckthorn in the future should be 10.21%, the open vegetation 32.25%, and the forest percentage under 10%, which is a very wise tactics to avoid the serious death of various vegetations in SSA to match the local arid eco-environment.
1. Location of SSA and Seabuckthorn Planting in the Area
The Soft Sandstone Area (SSA) is the most serious area of soil and water losses in China due to nearly thorough bare gullies in the area. It is proved that the planting of seabuckthorn (Hippophae rhamnoides) not only benefits the harnessing of the area to avoid soil and water losses and fruit processing of seabuckthorn, but also is very important to reduce the sediments flowing into the Yellow River.
The total area of SSA of 19.7 thousand square kilometers has been determined from our practice for more than ten years, and the datum of the area is more than 12 thousand square kilometers by Jin [1] and 16.7 thousand square kilometers by Wang [2]. SSA locates from north 38˚10' to 40˚10' by latitude and from 108˚45' to 111˚31' by longitude, mainly in the territories of Dongsheng, Jungar, Ejin Horo, Dalate of Inner Mongolia, and Shengmu, Fugu of Shaanxi, see Figure 1 [3].
For ten years (1999-2008) planting, the total seabuckthorn survival area has got to 1642.83 km2, 9.84% of the total area of SSA, which can be seen from Table 1 illustrating the total survival areas of seabuckthorn planting in SSA.
2. Contrast of Landscape Types in Three Key Years of Seabuckthorn Planting
The main data of seabuckthorn areas for 1998 (a year before the project beginning), 2003 (middle year) and 2008 (project finish year) come from the Landsat TM/ETM+ images (see Figures 2-4), whereas the auxiliary data from GPS survey, statistics, acceptance inspection by the Water Resources Ministry of China and so on.
We divide SSA into 9 landscape types, such as seabuckthorn, sand, water, settlement, bush, open vegetation, forest, grassland and unused land. Seabuckthorn type is separated from the bush type for the purpose of estimating the role of seabuckthron planting.
In 1998, one year before the seabuckthorn project implementing, no new seabuckthorn type, the coverage sequence of landscape types is respectively sand, open vegetation, grassland, unused land, forest, bush, water and settlement from big to small. In 2003, the middle year, the sequence of landscape type areas is, from big to small, sand, grassland, open vegetation, unused, seabuckthorn, forest, bush, water and settlement. In 2008, the finish year, the ratio of landscape types is sand, open vegetation, grassland, unused, seabuckthorn, forest, bush, water, settlement from big to small.
In the process of seabuckthorn planting from 1998 to 2008, the area of seabuckthorn increases remarkably, from 0 in 1998 to 115522.74 hm2 in 2003, 164282.81 hm2 in 2008. At the same time, the sand areas decrease by 14167.99 hm2 in 2003, and 180447.48 hm2 in 2008 to

Table 1. Total survival areas of seabuckthorn planting of counties in SSA (km2).

Figure 1. Sketch map of SSA.
those in 1998. The areas of bush and water change little from 1998 to 2008, only decrease slightly in 2003. The settlement area in 2003 increases by two times than that in 1998, and by 3.76 times in 2008 than that in 2003. The areas of open vegetation, forest and grassland increase gradually, whereas the unused land decreases by 73244.3
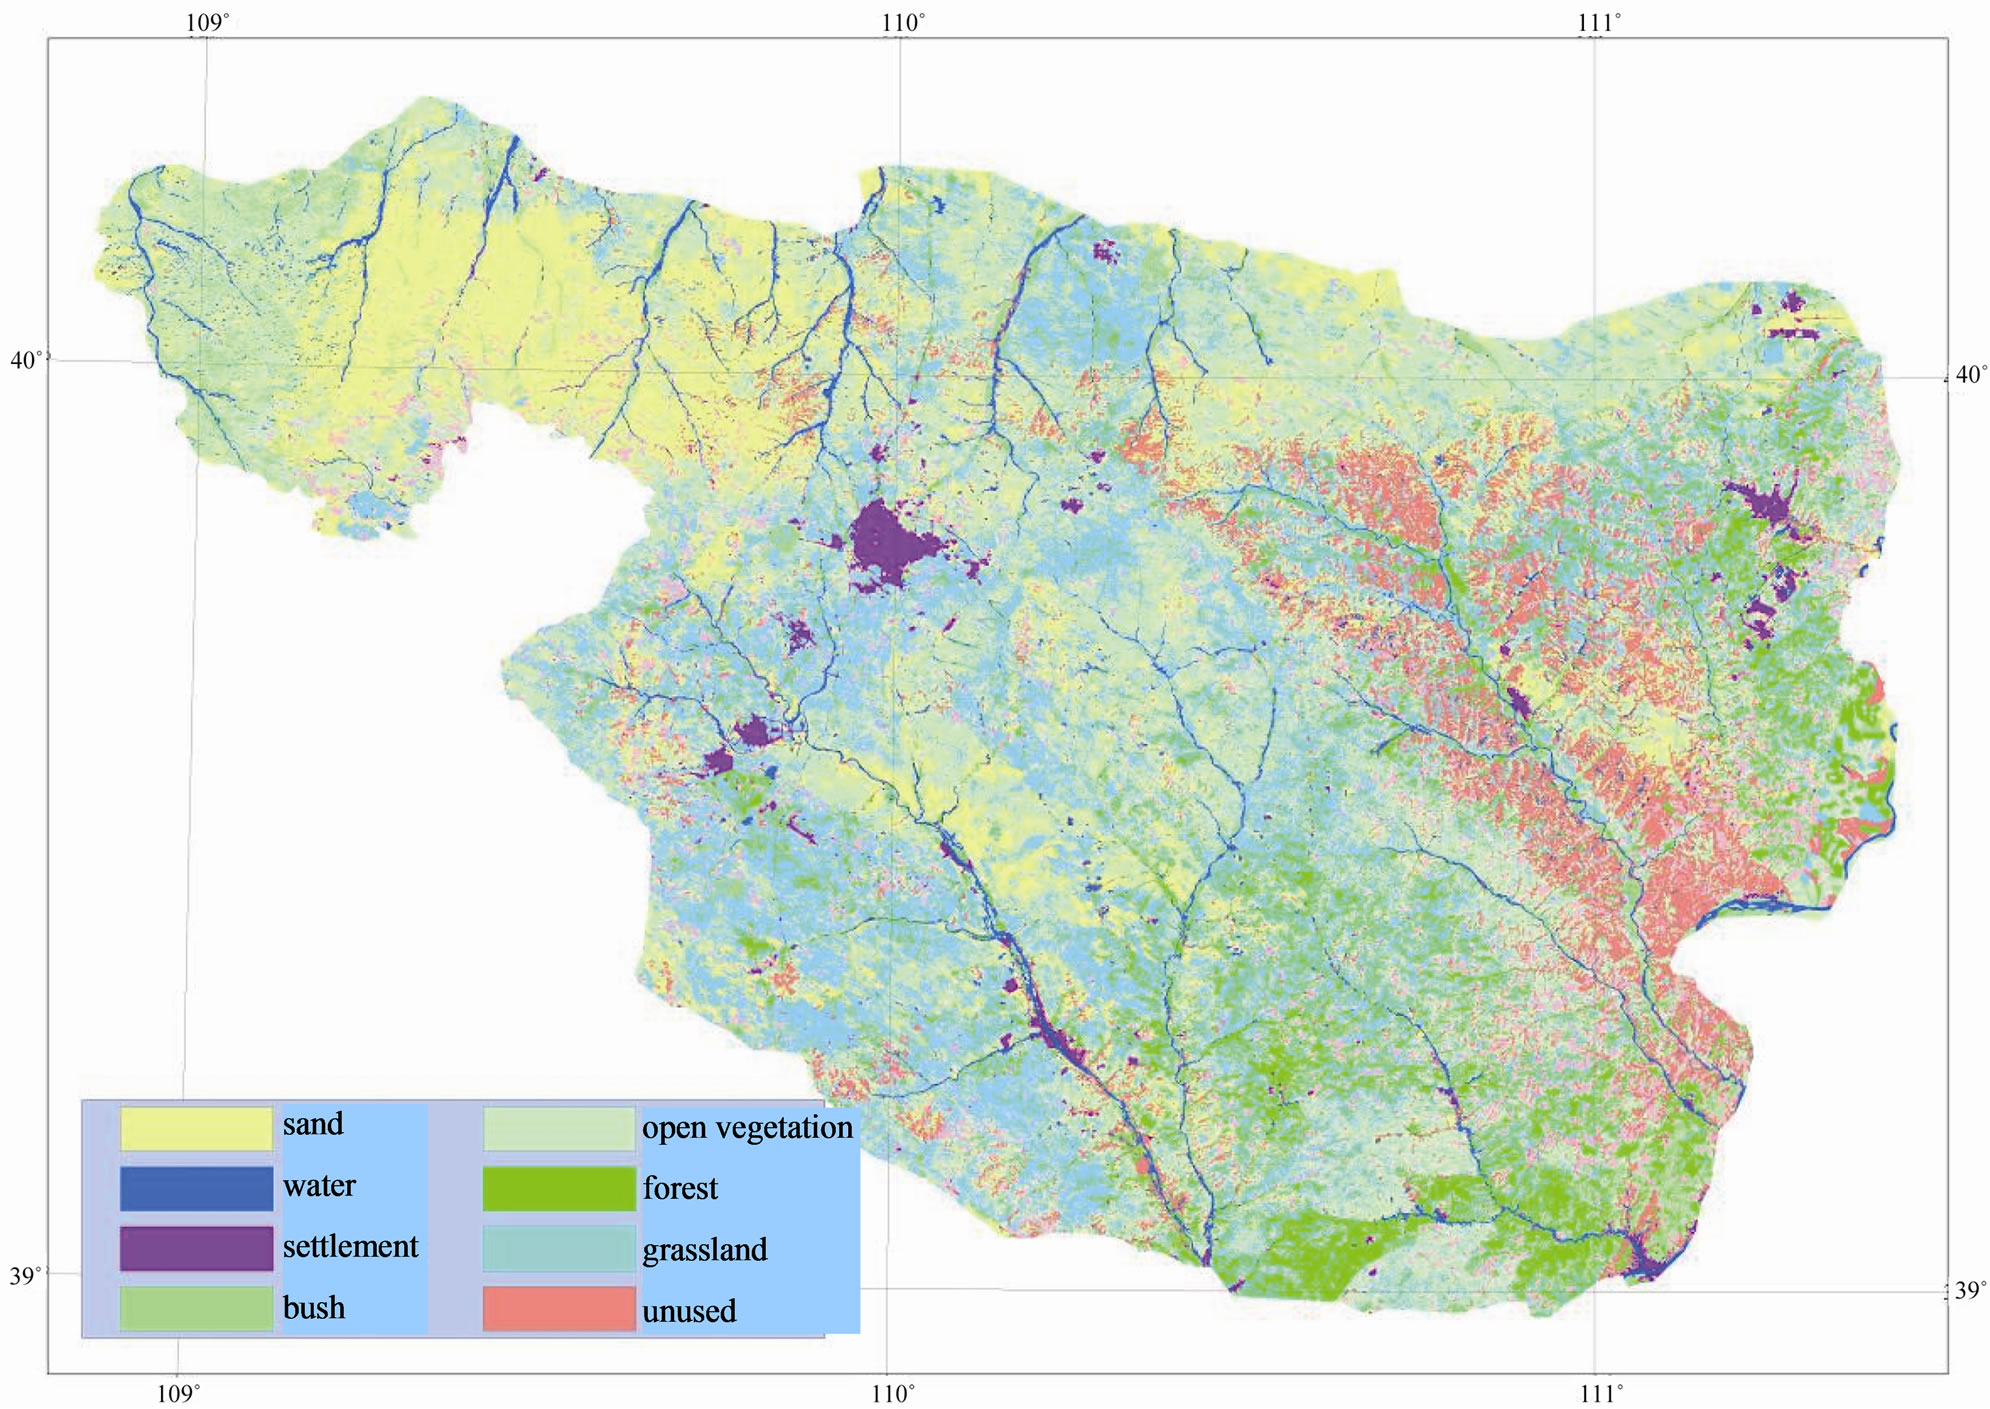
Figure 2. Distribution of landscape types in SSA in 1998.
hm2 from 1998 to 2008. As a general, the project of seabuckthorn planting influences the landscape types a lot in SSA, the more the seabuckthorn area, the smaller the sand and unused lands, which indicates that the seabuckthorn has occupied the areas once covered by sand and the unused lands as well
3. Prediction of the Coverage Trends of Landscape Types in SSA after Seabuckthorn Planting
Markov model [3] is a good method to predict the future trend based on the assumption of the unchanged artificial influence including a steady land use policy. The transition matrix can be got through the MATLAB, and the percentages of the landscape types be calculated through related formula. From the transition probability of 2003 to 2008, the areas of landscape types can be easily predicted after 2008 for every 5-years’ period, see Table 2 and Table 3.
The prediction in Table 4 shows the trend of every landscape after 2008, but only can the combination of both quality and quantity of the landscape types make us grasp the changes of the types more correctly.
The forecast with Markov model shows that the coverage rate of seabuckthorn increases from 9.43% in 2013 to 10.20% by the year 2038, with a relatively slower growing speed. A steady coverage rate, 10.21%, can be reached after 2043 (including 2043), which is most suitable for the area.
The sand area keeps shrinking with a decrease tendency from 2013’s 11.42% to 2028’s 10.07%. After 2043 (including 2043) the coverage of sand area becomes almost immobile—a ratio of 10.01%—for the local ecological balance benefiting from the desertification combating.
Water area proportion decreases from 2.51% in 2013 to 2.48% in 2023, and from 2043 stays at 2.50%. The changes on the area take on fluently without too sharp fluctuations, mainly based on the climate in the future maintaining the same as present.
Settlement continues to show an expanding trend with the proportion growing from 2013’s 1.93% to 2038’s 3.62%—a final steady figure kept for the following years. The increasing ratio reaches to 87.56%, a considerable figure which reflects that with the accelerated urbanization and economic development, people increase the uti-
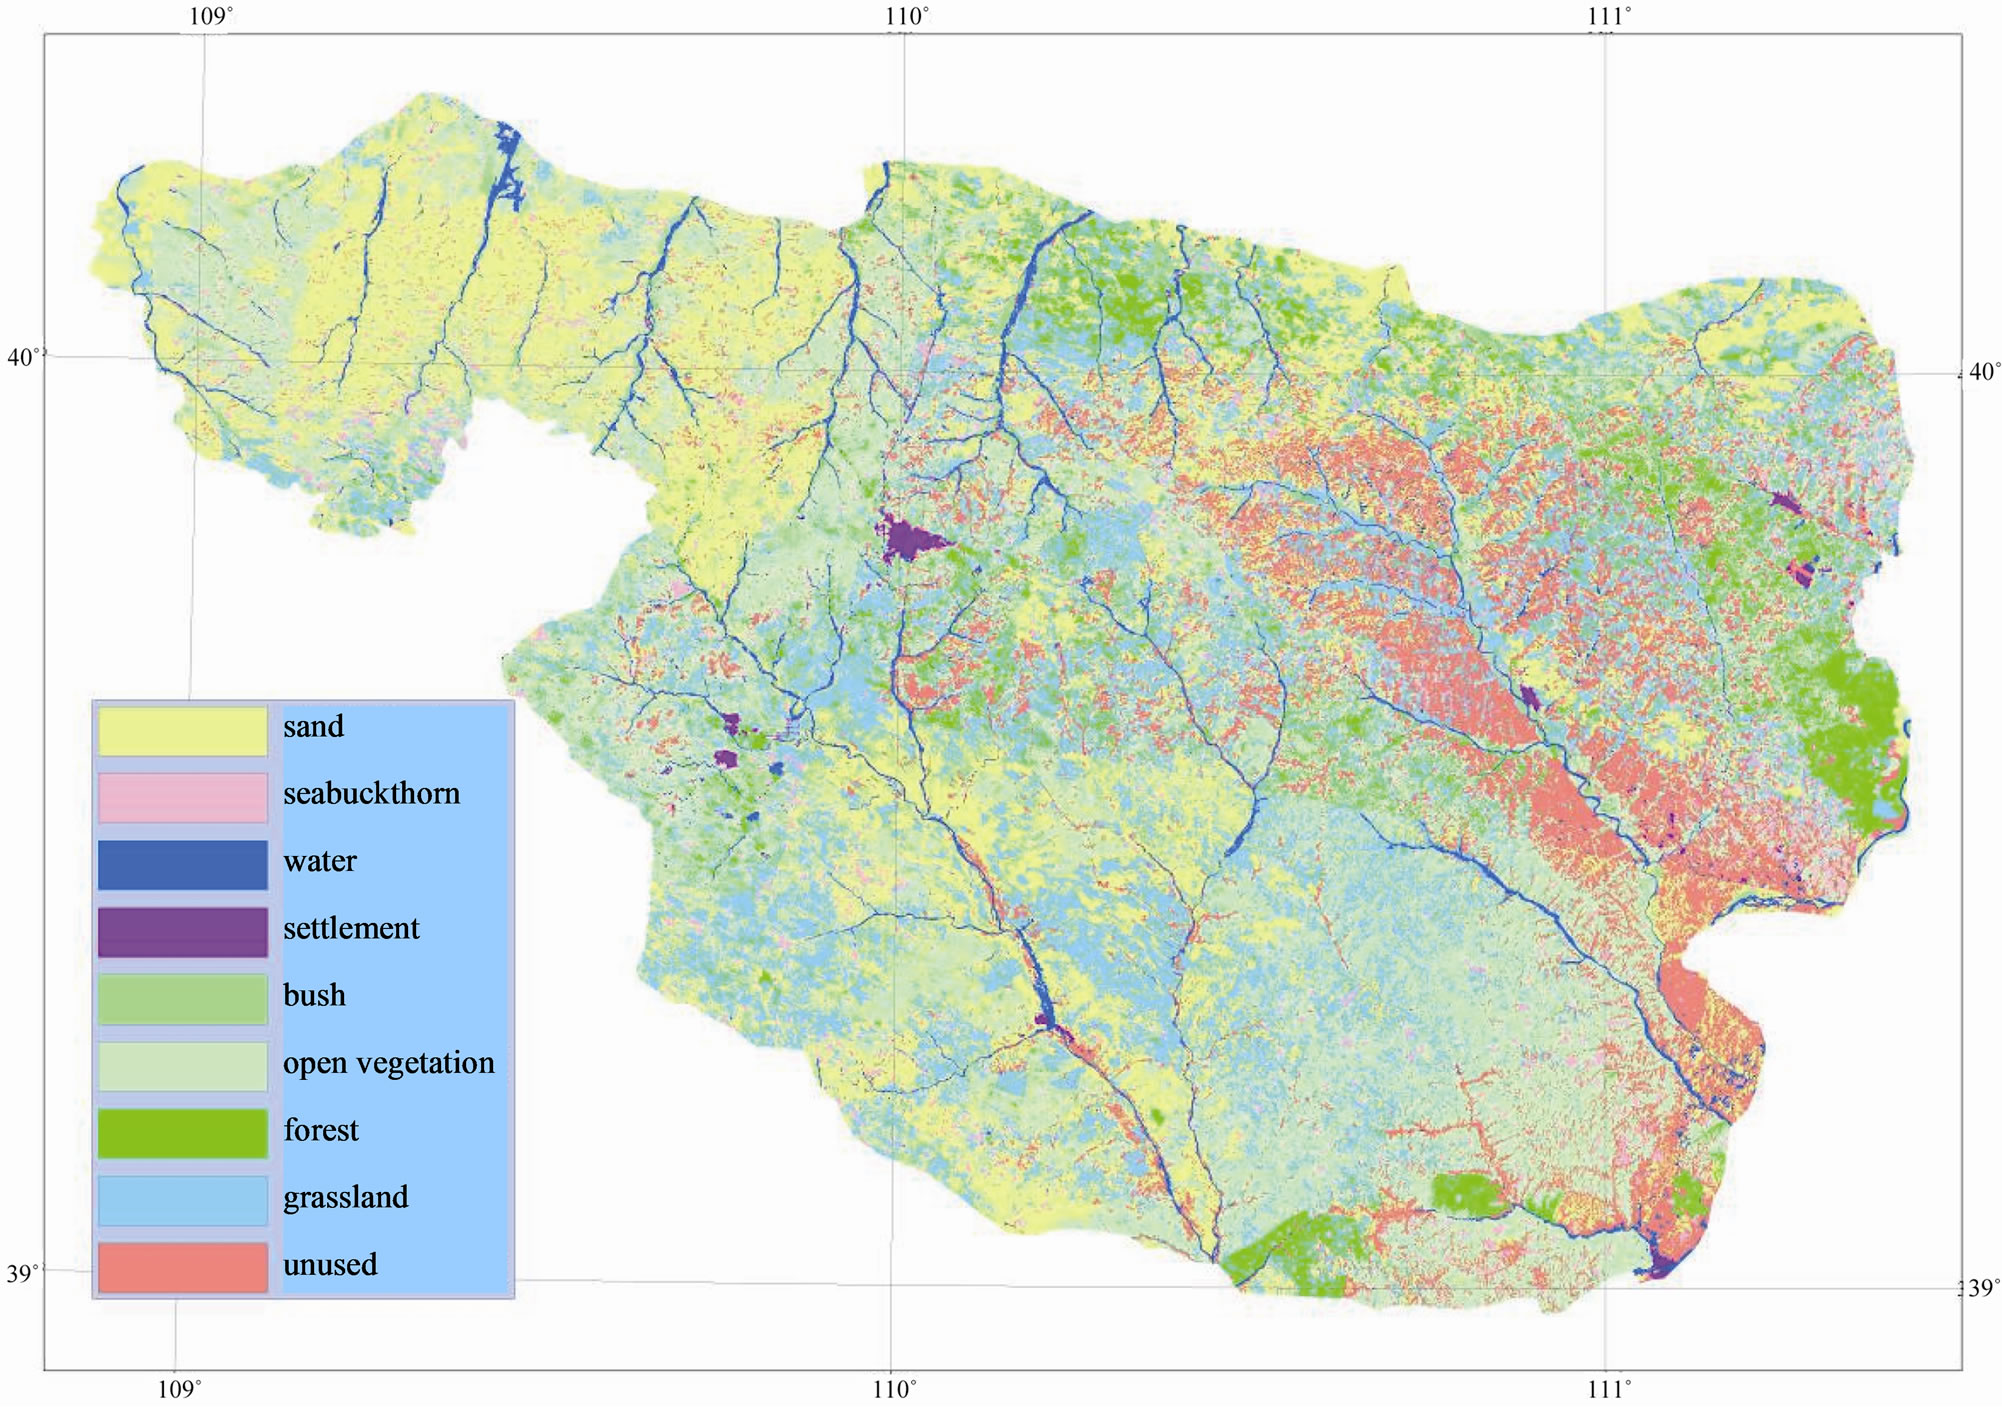
Figure 3. Distribution of landscape types in SSA in 2003.
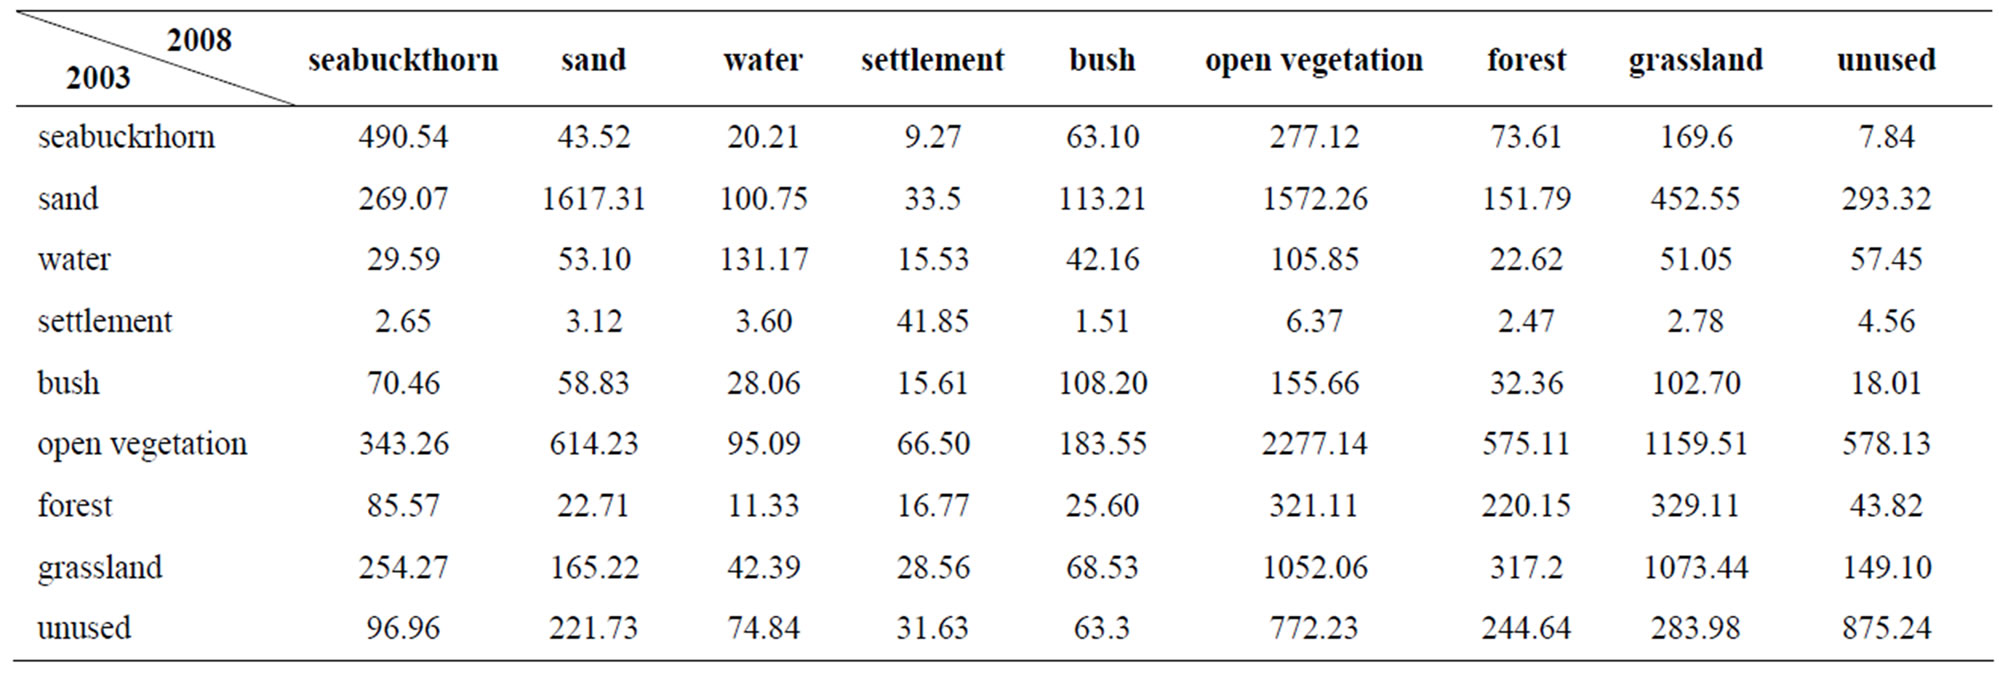
Table 2. Transition areas of landscape types from 2003 to 2008 in SSA (km2).
lization of land so that the humans’ range of activities as well as the urban scale is enlarged.
The coverage rate of shrubs rises continuously from 3.55% in 2013 to 3.61% in 2023. It retained at 3.61% during the years of 2023 to 2038. In 2038 the proportion reaches 3.62%—a steady proportion lasting for years.
The coverage rate of forests in 2013 is 9.08% and goes up to 9.33% by the year 2028, remaining constant during the following years from 2028 to 2033, and then slightly falls back to 9.32% in 2038 which later becomes constant again. The changes on area proportion of forest, like that of water, show a wavelike curve. For the coverage rate of forests in the area, below 10% is an ideal proportion. As too large forest area will result in downward movement of dry soil layer, and ultimately lead to massive death of trees in the area.
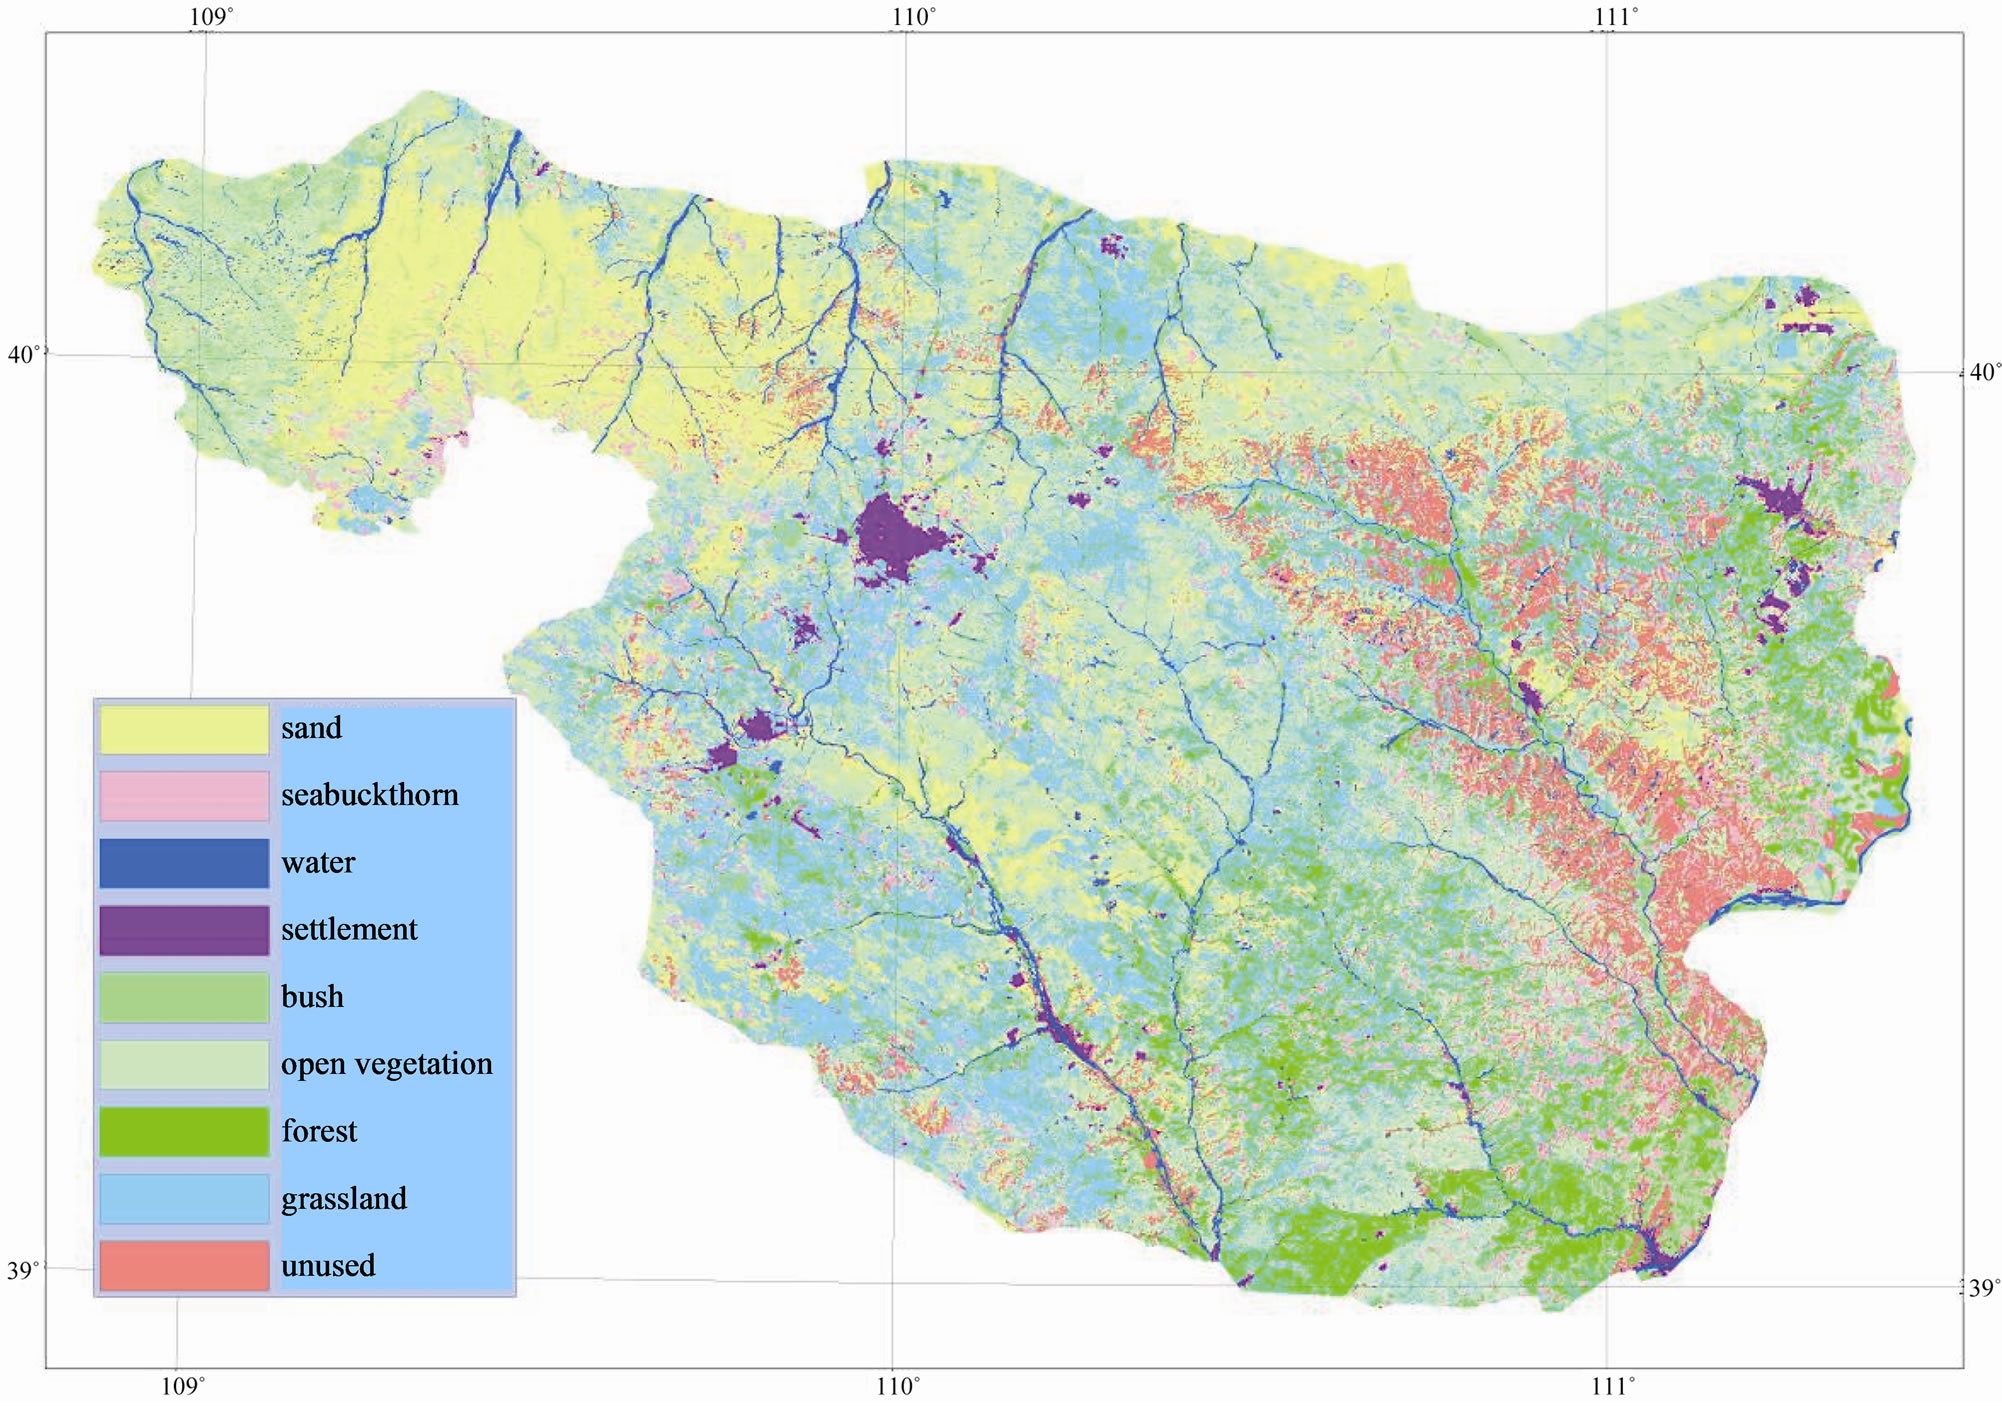
Figure 4. Distribution of landscape types in SSA in 2008.

Table 3. Transition Matrix of landscape types from 2003 to 2008 in SSA.
The area proportion for grassland (including crop land) increases with a growth from 2013’s 19.96% to 2028’s 20.56%. Then the figure stays unchanged until 2033 and after a gentle decline it reaches a stable long-lasting rate of 20.63% from 2038.
The area proportion of the unused land is reduced from 2013’s 9.29% down to 2038’s 8.65%. However, this figure is based on the current comprehensive utilization rate of land; the exact figure will depend on the factors such as technological advancement in the future and so on.
The proper proportion for open vegetation to stabilize the ecosystem is 32.25%. In such an arid area, open vegetation, instead of forest, of a comparably high proportion adapts well to the local arid ecological environment.
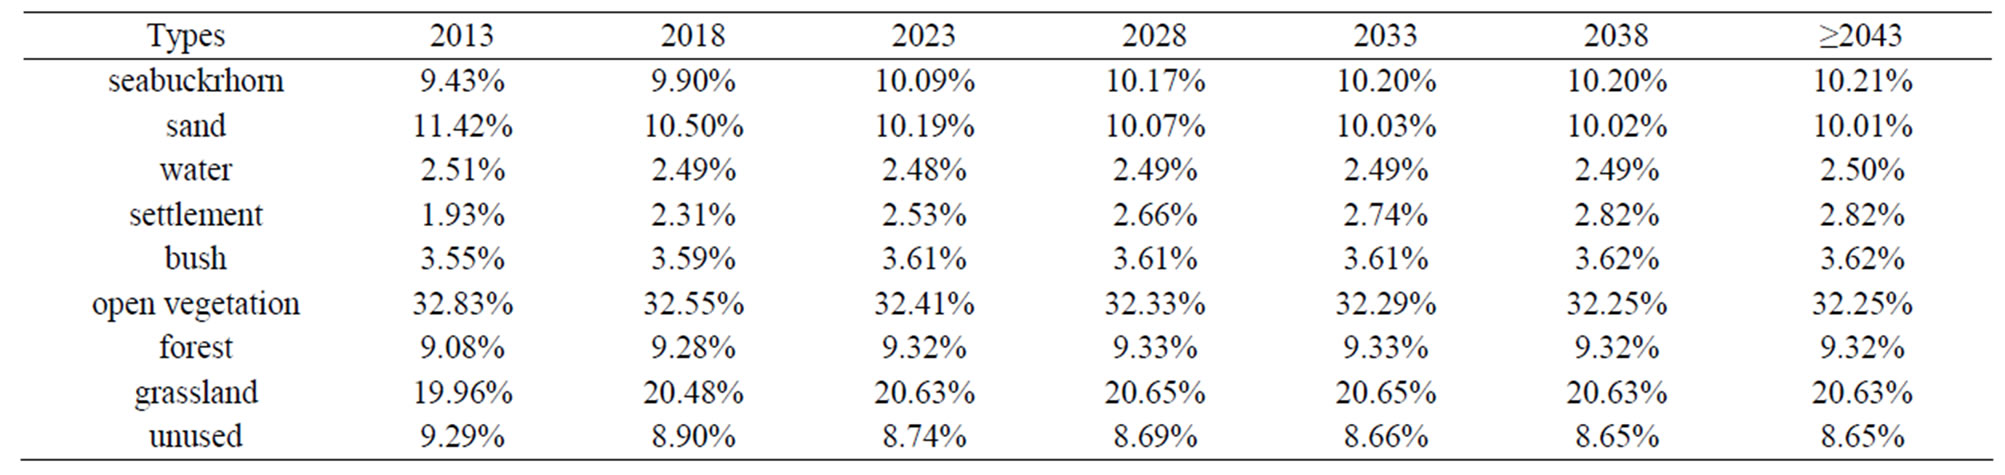
Table 4. Prediction of landscape types of SSA after 2008.
REFERENCES
- Z. P. Jin, “Study on Soil and Water Conservation and Agriculture Development in Soft Sandstone Area,” Yellow River Conservancy Press, Zhengzhou, 2003.
- Y. C. Wang, Y. H. Wu and M. Li, “Study on Status of Soil and Water Losses and Harnessing Way in Soft Sandstone Area,” Yellow River Conservancy Press, Zhengzhou, 2007.
- Y. S. Zhong, “Marcov Chain and Its Utilization in Forestry Prediction,” Journal of Northwest Forestry College, Vol. 3, No. 1, 1998, pp. 75-81.