Open Journal of Fluid Dynamics
Vol.2 No.4A(2012), Article ID:26362,7 pages DOI:10.4236/ojfd.2012.24A038
Effect of Arrangement of Tube Banks on Acoustic Resonance
1Department of Mechanical Engineering, Oita University, Oita, Japan
2Postgraduate Course, Oita University, Oita, Japan
3Shonan Institute of Technology, Fujisawa, Japan
Email: hamakawa@oita-u.ac.jp
Received September 23, 2012; revised November 5, 2012; accepted November 14, 2012
Keywords: Acoustic Resonance; Vortex; Tube Banks; In-Line Arrangement; Staggered Arrangement; Boiler
ABSTRACT
In the present paper the attention is focused on effect of arrangement of tube banks on acoustic resonance which occurred in the two-dimensional model of boiler. We have examined the characteristics of vortex shedding and acoustic resonance generated from in-line and staggered tube banks. At the small tube pitch ratio in in-line tube banks, acoustic resonance of third and fourth mode in the transverse direction occurred. As the tube pitch ratio in the flow direction decreased, the vortex shedding frequency became broad-band. The alternative vortex shed from in-line tube banks. The multiple resonance modes were generated within the broad-band vortex shedding frequency. And the acoustic resonances of lower-order modes occurred at the higher gap velocity. On the other hand, at the small tube pitch ratio in staggered tube banks, acoustic resonance did not occurred, although the vortex shed at the resonance frequency in tube banks. The pressure drop at staggered tube banks was larger than that of in-line tube banks. The symmetric vortices were observed inside staggered tube banks at the small tube pitch ratio.
1. Introduction
In heat exchangers, such as boilers for commercial use, acoustic resonant noise is occasionally generated in the ducts when gas is flowing laterally with respect to the axis of the tubes. Flow induced vibration and noise in heat exchanger can be found in the review paper [1-4].
The acoustic resonant noise generated from heat exchangers is usually caused by the resonance of acoustic modes inside the boiler and vortex shedding from the tube banks. Many studies have been published on the excitation mechanisms causing acoustic resonance in the tube banks in cross-flow [5-8]. Vortex excitation has been clearly shown to result from the formation of periodic vortices in the space between the tubes [7,8].
It is generally known that vortex shedding frequency varies with the pitch ratio of the tube arrangement. There are many studies on the vortex shedding frequency in the tube banks in cross-flow [6,7,9-12]. Chen [6], Fitz-hugh [9] and Rae & Wharmby [10] have proposed Strouhal number charts for tube banks to estimate the vortex shedding frequency of a heat exchanger at the design stage. And Blevins & Bressler [13,14] have shown that the acoustic resonance of first transverse mode do not occur in the tube banks for small tube pitch ratio. However, the effect of arrangement in the tube banks on acoustic resonance was not clear in detail.
The purpose of the present investigation was to clarify experimentally the effect of arrangement of tube banks on acoustic resonance which occurred in the two-dimensional model similar to an actual boiler plant. And we have examined the effect of tube pitch ratio on acoustic damping and vortex shedding from tube banks.
2. Experimental Apparatus and Procedure
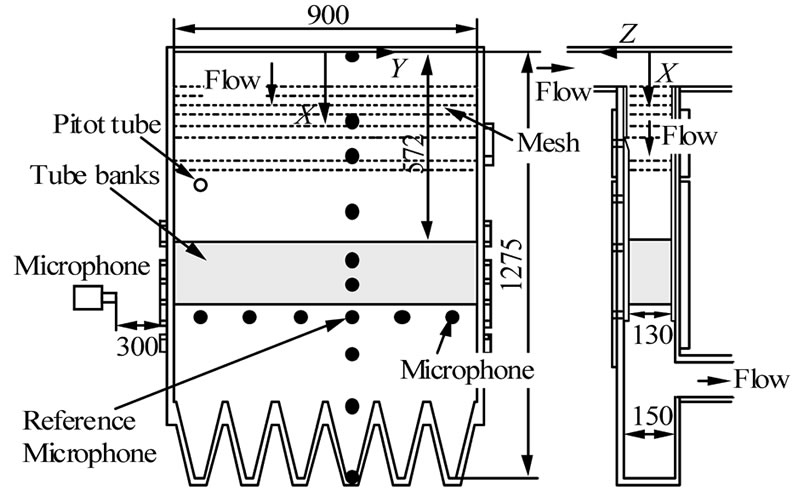
A schematic view of the experimental apparatus used in the present experiment is shown in Figure 1(a). The structure of this apparatus is similar to that of an actual power station heat exchanger. The similarities are described in detail in the paper [15].
This apparatus was a subsonic facility with a blower located at its upstream inlet. This was a rectangular duct of 900 mm in width, 150 mm in height, and 1275 mm in length (maximum), and was made of 20 or 30 mm thick acrylic plate. The test section had a cross-section of 900 × 130 mm. Eight meshes were installed in the transverse direction at the test section inlet to enable a uniform flow without disturbing the sound field. The boundary layer thickness was about 5 mm, the drift in the freestream was
 (a)
(a)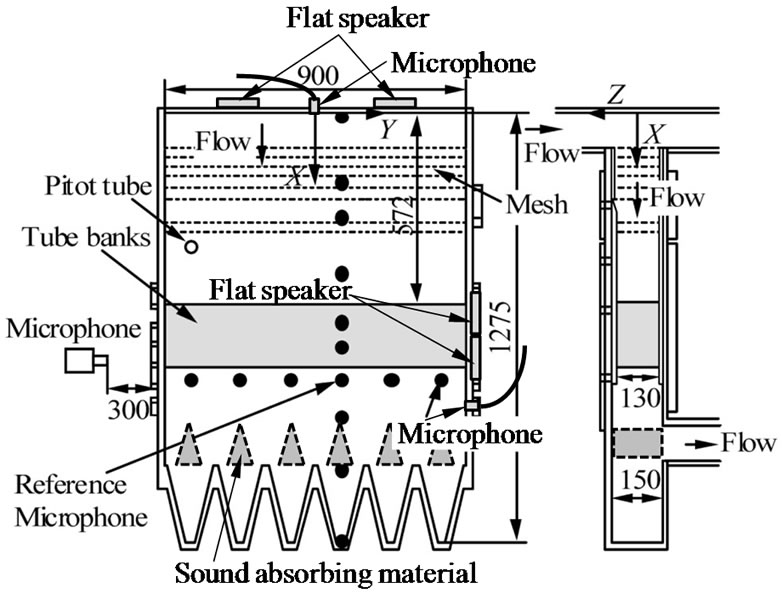 (b)
(b)
Figure 1. Experimental apparatus. (a) Measurement of acoustic resonance; (b) Measurement of acoustic damping and vortex shedding.
less than 2.0%, and the turbulence intensity was less than 1.8% in the freestream velocity. Tube banks were installed in the test section 572 mm downstream from the upstream end plate. A pitot tube was used to measure the freestream velocity, U∞, (oncoming velocity) in the tube banks. The freestream velocity ranged from 2.5 to 15.5 m/s at the test section inlet.
The acoustic damping ratio was measured by using test apparatus without sound absorbing materials as shown in Figure 1(b). The flat speakers and the microphones were set on the side wall at the tube bank part. These speakers had the strong directivity, and the plane wave of sound was generated from its speaker. The resonance curve was measured by the supply of sinusoidal tone from the flat speaker, and the acoustic damping ratio, ζ, was obtained by the half power method. This measurement of acoustic damping ratio was carried out in the condition without the flow. This damping ratio was confirmed to be the almost same as the value with the flow which freestream velocity was less than about 15 m/s.
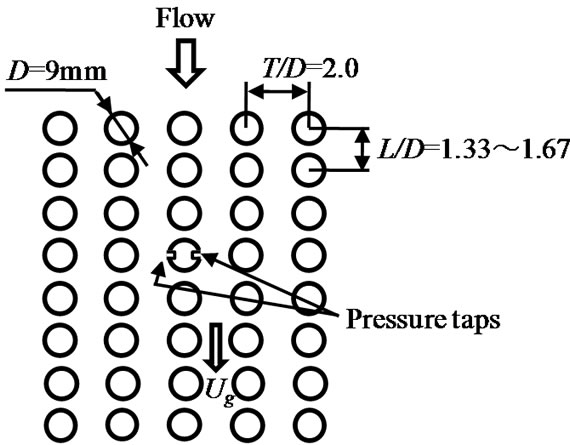
The tube banks are defined in Figure 2. Figures 2(a) and (b) show the in-line arrangement and staggered arrangement respectively. The tube banks consisted of fifteen rows, with 50 or 49 tubes per row. The tube diameter, D, was 9 mm. The tube pitch ratio for in-line tube banks part in the flow direction, L/D, was ranged from 1.33 to 1.67, and the transverse direction, T/D, was 2.0. The tube pitch ratio for staggered tube banks part in the flow direction, L/D, was 1.44, and the transverse direction, T/D, was 2.0. The tubes were 130 mm in length, and were made of aluminum rods. They were rigidly fixed to both end walls of the test section. The gap velocity was defined as Ug = TU∞/(T-D). Reynolds numbers, based on the gap velocity, Ug, ranged from 2.8 × 10³ to 2.0 × 10⁴. The arrangement of tube banks is shown in Table 1 in detail.
The sound pressure level (SPL) of noise was measured using a Bruel & Kjaer 1/2-inch condenser microphone mounted outside the test apparatus as shown in Figure 1. The amplitude and phase delay of the acoustic pressure fluctuations was measured by setting the reference mi-
 (a)
(a)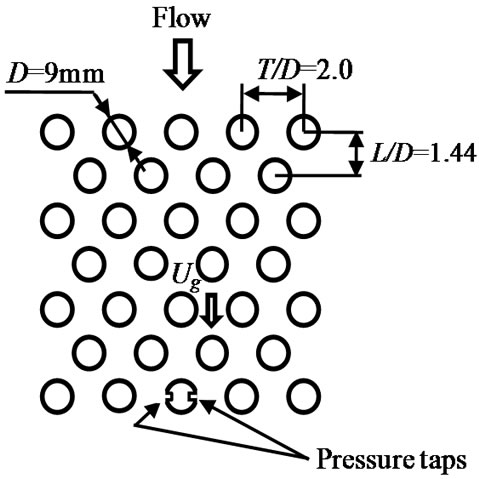 (b)
(b)
Figure 2. Arrangement of tube banks. (a) In-line arrangement; (b) Staggered arrangement.
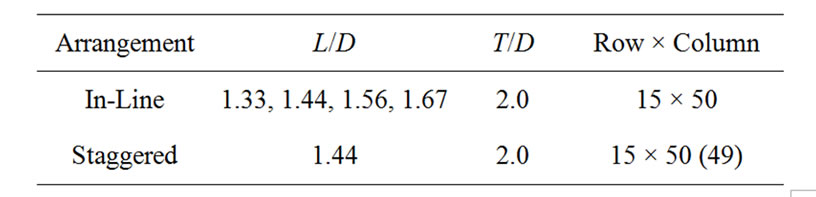
Table 1. Specification of tube banks.
crophone at the point X = 790 mm, Y = 75 mm, and placing another fifteen microphones at different locations along the X and Y axes inside the test apparatus.
3. Results and Discussion
3.1. Acoustic Damping
Figure 3 shows the variation of acoustic damping ratio, ζ, plotted against the acoustic mode number, n. As the acoustic mode number increased, the acoustic damping decreased for all tube pitch ratio, L/D. And as the tube pitch ratio in the flow direction decreased, the acoustic damping ratio increased for all acoustic modes. Especially, the acoustic damping ratio for L/D = 1.33 was larger than that for other tube pitch ratio. It is considered that it is difficult to generate the acoustic resonance of low order mode for small tube pitch ratio. This is the similar tendencies with the charts of Blevins & Bressler [13,14]. On the other hand, the acoustic damping ratio of L/D = 1.44 for staggered arrangement agreed well with that of the in-line arrangement of L/D = 1.44.
3.2. Acoustic Resonance
Figure 4 shows the spectrum of sound pressure level (SPL) measured at outside the test apparatus as shown in Figure 1(a). Figure 4 is the result of L/D = 1.33 at gap velocity of 17.9 m/s. The high peak was found in the spectrum at 1087.5 Hz. No peak was formed in the spectrum without the tube banks as shown the gray line of BGN. It is clear that single high peak at the resonant frequency is observed when the acoustic resonance occur at the tube banks.
Figure 5 shows all of the peak frequencies, fp, of the SPL spectra plotted against the gap velocity, Ug. The sizes of the symbols show the peak SPL levels. The typical Strouhal numbers at the onset velocity of acoustic resonances, obtained from St = fpD/Ug, were about 0.15, 0.26, 0.52 and 0.65. The peak frequencies for St = 0.52 increased stepwise as the gap velocity increased. However, the other frequencies for St = 0.15 and 0.26 did not increase stepwise and were kept constant although the
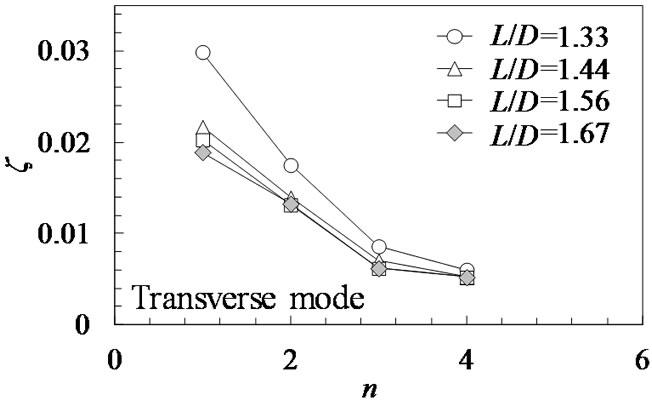
Figure 3. Acoustic damping ratio for tube arrangement (inline).
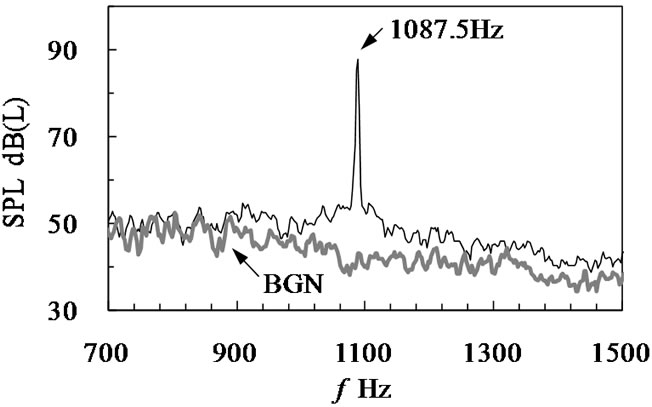
Figure 4. Spectral distributions of sound pressure level (L/D = 1.33, Ug = 17.9 m/s, in-line).
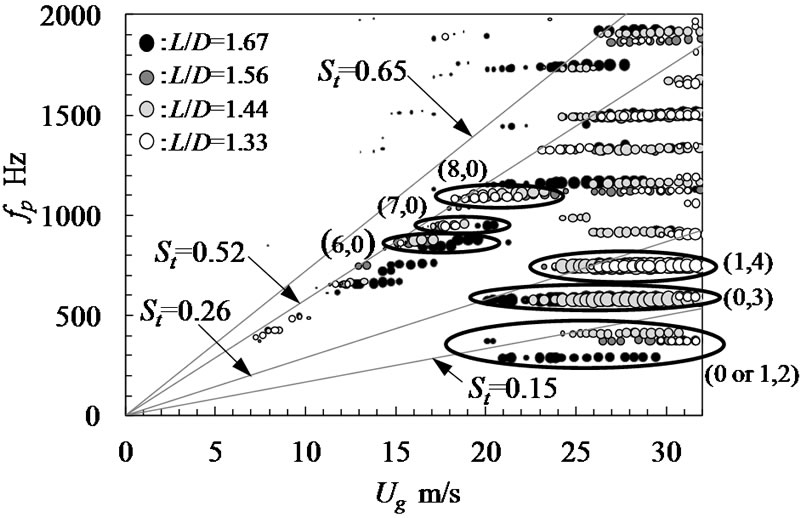
Figure 5. Variation of peak frequency of SPL against gap velocity.
gap velocity increased.
The phase delay in acoustic pressure fluctuation was measured by placing a fixed reference microphone downstream of the tube banks, and placing other microphones at different locations inside the test apparatus as shown in Figure 1. Figure 6 shows the absolute value of the measured phase delay, θ, in acoustic pressure fluctuations of 748 Hz at Ug = 27.7 m/s along the Y-axis. Note that the acoustic mode shape in the transverse direction was fourth mode. Similarly, the longitudinal mode was first mode. This mode shape is referred to herein as (1, 4). The mode shapes of the other resonant frequencies were obtained in the same way. The oval circles were the typical mode shapes as shown in Figure 5. It is clear that the resonances for St = 0.52 components are the longitudinal mode and the other resonances for St = 0.15 and 0.26 components are the transverse mode. Blevins & Bressler [13,14] have shown that in-line tube banks at L/D < 1.40 do not resonate in the first transverse acoustic mode. The acoustic resonance of first transverse mode was not generated for test tube pitch ratios in the present experiment.
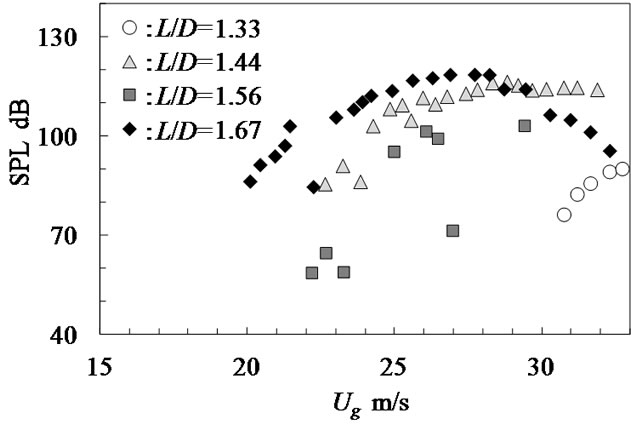
Figures 7(a) and (b) show the variations of SPL at each mode shapes plotted against the gap velocity, Ug. Figure 7(a) is the result of (0, 3) mode. The variations in SPL at the resonant frequencies of about 580 Hz are
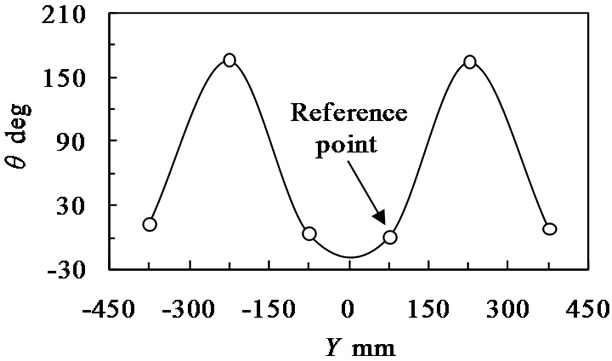
Figure 6. Phase delay of sound pressure fluctuations (L/D = 1.33, Ug = 27.7 m/s, fp = 748 Hz, in-line).
 (a)
(a)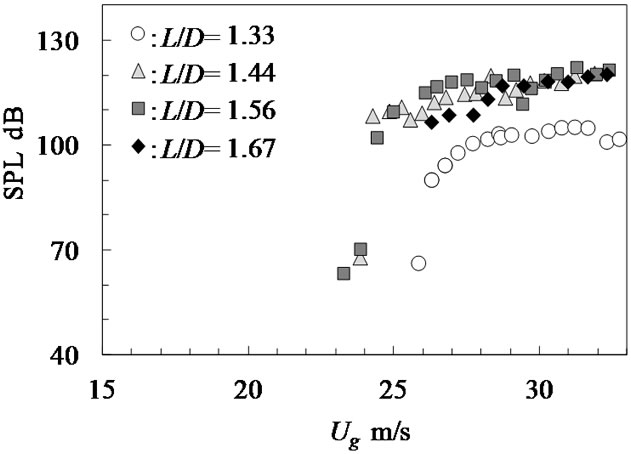 (b)
(b)
Figure 7. Variation of peak SPL of acoustic resonance against gap velocity (in-line). (a) fp = 580 Hz ((0, 3) mode); (b) fp = 748 Hz ((1, 4) mode).
plotted against the gap velocity. When acoustic resonance was generated, SPLs increased. As the tube pitch ratio, L/D, increased, the onset velocity of acoustic resonance decreased.
Figure 7(b) is the result of (1, 4) mode. For L/D = 1.56 and 1.44, the SPL of 748 Hz increased rapidly at gap velocity of 24.4 m/s until it reached a maximum level of 102 - 120 dB. As the tube pitch ratio, L/D, increased, the onset velocity of acoustic resonance decreased except for L/D = 1.67. It is considered that the different tendencies for L/D = 1.67 are due to the occurrence of strong resonance of (0, 3) modes.
Figure 8 shows the comparison of acoustic pressure ps between the staggered and in-line tube arrangement for L/D = 1.44. It is clear that the acoustic resonance did not
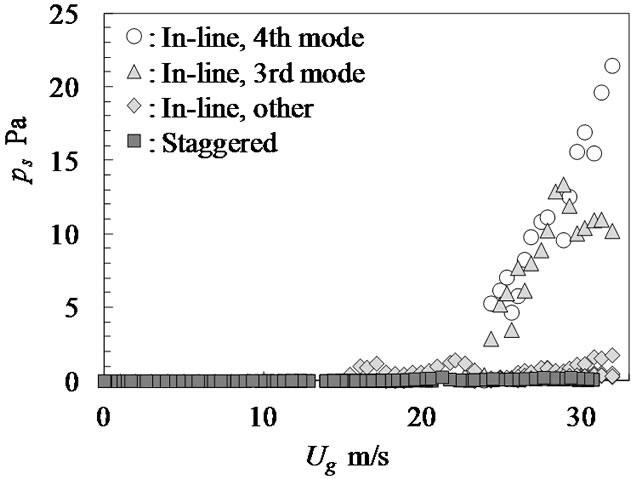
Figure 8. Variation of peak acoustic pressures against gap velocity (staggered, L/D = 1.44)
occur for staggered tube banks although the resonance of (1, 4) mode occurred at gap velocity of 24.4 m/s for in-line tube banks. Figure 9 is the pressure drop for each tube banks. The pressure drop at staggered tube banks was larger than that of in-line tube banks. Eisinger [16] have shown that the pressure drop correlate the excitation energy of acoustic resonance. However, the acoustic resonance did not occur for staggered tube banks in present experimental condition although the pressure drop became large for staggered tube banks. It is considered that it is easy to generate the acoustic resonance for in-line tube banks compared with that of staggered tube banks for small tube pitch ratio at the same density of tube banks.
3.3. Vortex Shedding Characteristics
It is generally known that vortex shedding frequency varies with the pitch ratio of the tube arrangement [6,7, 9-12]. To clarify the characteristics of the vortex shedding phenomena in the no-resonance case, the acoustic resonance generated in this model was suppressed with acoustic absorbers [15,17]. The acoustic absorbers were made of glass wool and covered by panting acrylic plates. The generation of acoustic resonance was prevented by placing six acoustic absorbers inside the test apparatus as shown in Figure 1(b).
The surface pressure fluctuations due to vortex shedding in in-line tube banks were measured at the fourth row tube, as shown in Figure 2(a). Figure 10(a) shows the typical surface pressure spectrum at Ug = 6.4 m/s for L/D = 1.33. A single peak formed at 95.7 Hz in the spectrum, indicating the existence of periodic phenomena in the tube banks. Similar results were obtained at larger tube pitch ratio or low Reynolds number. Figure 10(b) is the spectrum of the surface pressure fluctuation of Ug = 24.7 m/s for L/D = 1.33. The spectrum was broad-band and the periodicity of surface pressure fluctuation became weak, which were typical characteristics for small tube pitch ratio. Figure 11 is the typical result of short
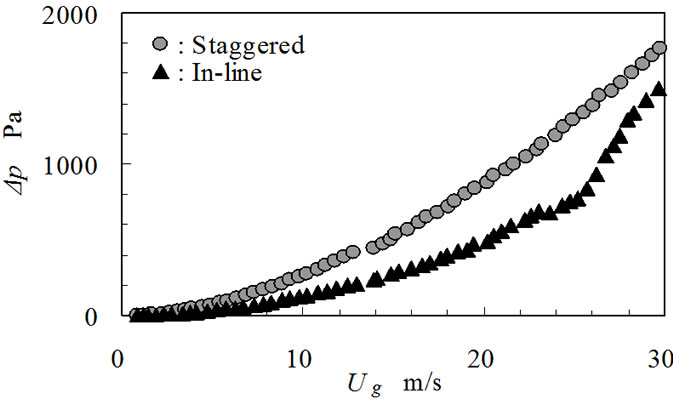
Figure 9. Comparison of pressure drop for tube banks (L/D = 1.44, T/D = 2.0).
 (a)
(a)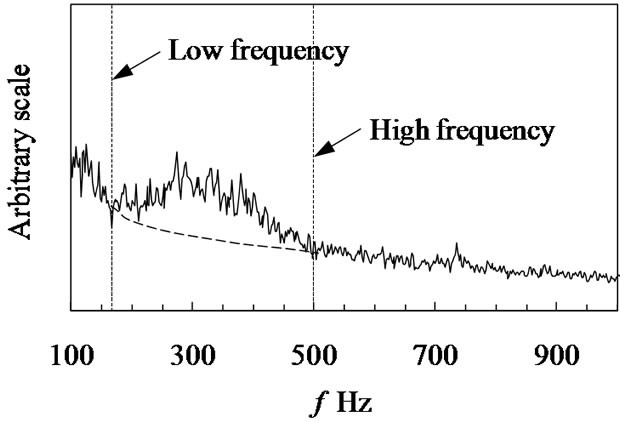 (b)
(b)
Figure 10. Surface pressure spectrum (L/D = 1.33, in-line). (a) Ug = 6.4 m/s; (b) Ug = 24.7 m/s.
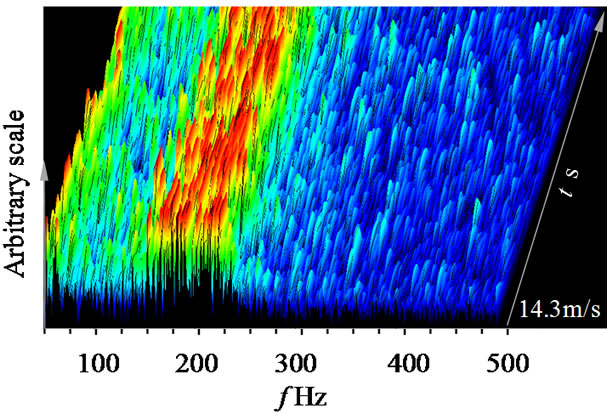
Figure 11. Time variation of Short time spectrum (L/D = 1.33, in-line, Ug = 14.3 m/s).
time spectrum of surface pressure fluctuation. Note that the peak frequencies of spectrum fluctuate at broad band momentarily. This is caused by the interaction between the free shear layer separated from the surface of front tube and the surface of rear tubes.
Figure 12 shows the measured phase delay of the surface pressure fluctuations of Ug = 24.7 m/s for L/D = 1.33 in in-line tube banks. This was measured by one pressure tap and other tap at the symmetrical location, as shown in Figure 2(a). The phase delay of surface pressure fluctuations at hump portion of spectrum was about 180 degree. Note that the surface pressure fluctuations at the two points on both sides of a single tube were out of phase with each other. Figure 13 is the variation of this frequency band plotted against gap velocity. It is clear that the frequency band at hump portion of spectrum increased in proportion to the gap velocity. It is considered that the alternate vortices of weak periodicity were formed inside the in-line tube banks at small tube pitch ratio.
On the other hand, the surface pressure fluctuations in staggered tube banks were measured at the 13th row tube, as shown in Figure 2(b). Figure 14 shows the typical surface pressure spectrum at Ug = 29.1 m/s for L/D = 1.44. A single peak formed at about 900 Hz in the spectrum, indicating the existence of weak periodic phenomena in the tube banks. This peak frequency also increased in proportion to the gap velocity. The Strouhal number St became 0.29, which agreed 0.3 read from Fitz-hugh’s map [9].
Figure 15 shows the measured phase delay of the surface
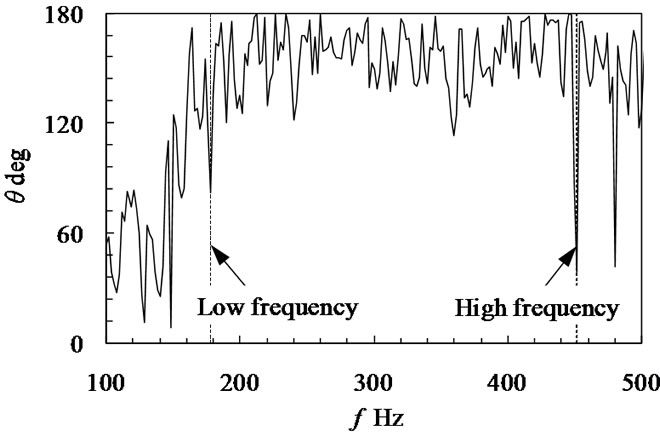
Figure 12. Phase delay between surface pressure fluctuations (Ug = 24.7 m/s, L/D = 1.33, in-line).
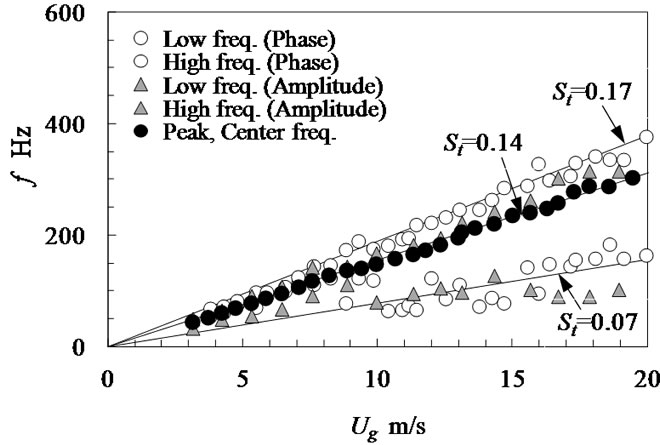
Figure 13. Frequency band of hump portion in the spectrum (L/D = 1.33, in-line).
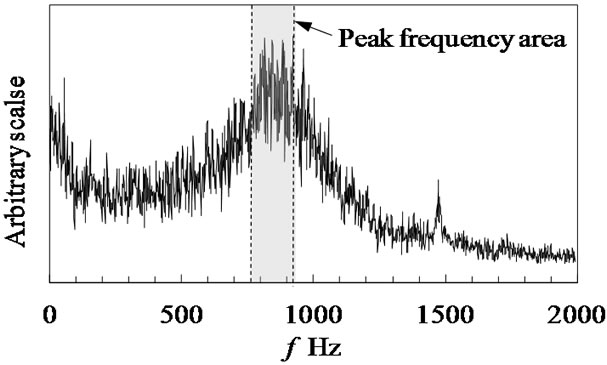
Figure 14. Surface pressure spectrum (Ug = 29.1 m/s, L/D = 1.44, staggered).
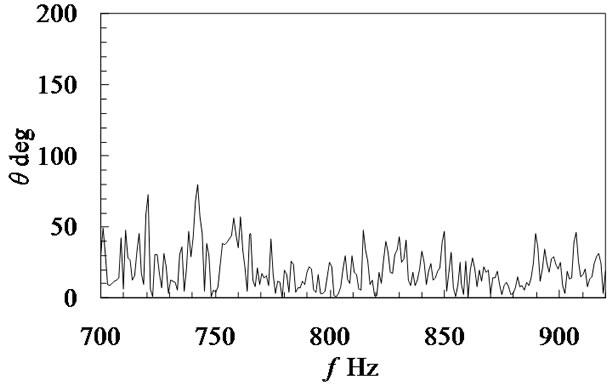
Figure 15. Phase delay between surface pressure fluctuations (Ug = 29.1 m/s, L/D = 1.44, staggered).
pressure fluctuations of Ug = 29.1 m/s in staggered tube banks for L/D = 1.44. The phase delay of surface pressure fluctuations at about 900 Hz of spectrum was about 0 degree. Note that the surface pressure fluctuations at the two points on both sides of a single tube were in phase with each other. And the frequency band at hump portion of spectrum increased in proportion to the gap velocity. It is considered that the symmetric vortices of weak periodicity were formed inside the staggered tube banks at small tube pitch ratio. This is caused by no resonance at the staggered tube banks although the acoustic damping ratio agreed with that of in-line tube banks for L/D = 1.44.
Figure 16 shows the measured Strouhal numbers of vortex shedding against the tube pitch ratio, L/D. The vortex shedding frequency was defined by the peak or center of hump portion of spectrum. The closed circles are the results of Strouhal number, based on the measured vortex shedding frequency in the no-resonance case. It is clear that the measured Strouhal numbers agreed with Strouhal number read from the chart proposed by Rae & Wharmby [10] for in-line tube banks and the chart proposed by Fitz-hugh [9] for staggered tube banks.
The gray squares are the results of Strouhal number, based on the measured resonance frequency and the onset velocity of resonance. The longitudinal mode resonance and the overtone components of transverse mode resonance were neglected. It is clear that the multiple resonances occurred for all L/D. There are a number of reasons for the occurrence of multiple resonances. One is
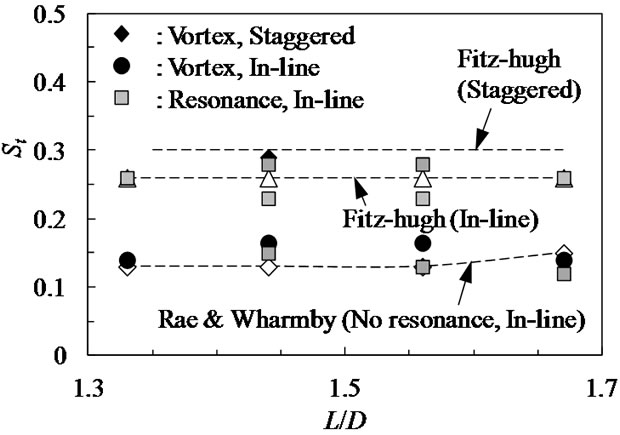
Figure 16. Measured Strouhal number against gap velocity.
that the vortex shed at broad-band frequency for small tube pitch ratio. The multiple acoustic modes for lower acoustic damping were occurred within the broad-band vortex shedding frequency. Another reason is that acoustic resonances of lower-order modes occurred at the higher gap velocity. Because the acoustical damping ratios of lower-order modes are larger than those of the higher-order mode, and the excitation energy of resonance for higher gap velocity is larger than that for lower gap velocity. It is generally known that the sound intensity induced by vortex shedding is proportional to the velocity raised to the sixth power without acoustic resonance [18]. It is clear that the measured Strouhal numbers of acoustic resonance agree well with the Strouhal numbers read from the charts proposed by Fitz-hugh [9] or Rae & Wharmby [10] for in-line tube banks. It is useful to predict the vortex shedding frequencies by using the double charts of Fitz-hugh and Rae & Wharmby due to broad-band vortex shedding frequency.
4. Conclusions
The effect of tube pitch ratio in tube banks on acoustic resonance was experimentally investigated. As a result, the following conclusions were obtained in the present experimental condition.
1) As the acoustic mode increased, the acoustic damping ratio decreased for tube pitch ratio of 1.33 - 1.67 in in-line arrangement. As the tube pitch ratio in the flow direction decreased, the acoustic damping ratio increased for all acoustic modes. The acoustic damping ratio of 1.44 in in-line arrangement agreed well with that of the staggered arrangement;
2) For same tube pitch ratio, it is easy to generate the acoustic resonance for in-line tube banks compared with that of staggered tube banks. The acoustic resonance did not occur for staggered tube banks although the acoustic resonance of 3rd and 4th mode in the transverse direction occurred in in-line tube banks. The symmetric vortices of weak periodicity were formed inside the staggered tube banks at small tube pitch ratio;
3) The multiple acoustic resonances occurred at in-line tube banks for tube pitch ratio of 1.33 - 1.67. The vortex shed at broad-band frequency for small tube pitch ratio. The multiple acoustic modes for lower acoustic damping were occurred within the broad-band vortex shedding frequency. The acoustic resonances of lower-order modes occurred at the higher gap velocity. As the tube pitch ratio increased, the onset velocity of acoustic resonance decreased and the SPL increased overall.
5. Acknowledgements
The work was partially supported by the Grant-in-Aid for Scientific Research No. 23560265 from the Japan Society for Promotion of Science (in the Japan Ministry of Education and Science) for which the authors wish to express their sincere gratitude.
REFERENCES
- M. P. Païdoussis, “A Review of Flow-Induced Vibrations in Reactors and Reactor Components,” Nuclear Engineering and Design, Vol. 74, No. 1, 1983, pp. 31-60.
- M. J. Pettigrew and C. E. Taylor, “Vibration Analysis of Shell-and-Tube Heat Exchangers: An Overview—Part 1: Flow, Damping, Fluidelastic Instability,” Journal of Fluids and Structures, Vol. 18, No. 5, 2003, pp. 469-483. doi:10.1016/j.jfluidstructs.2003.08.007
- M. J. Pettigrew and C. E. Taylor, “Vibration Analysis of Shell-and-Tube Heat Exchangers: An Overview—Part 2: Vibration Response, Fretting-Wear, Guidelines,” Journal of Fluids and Structures, Vol. 18, No. 5, 2003, pp. 485- 500. doi:10.1016/j.jfluidstructs.2003.08.008
- S. Ziada, “Vorticity Shedding and Acoustic Resonance of Tube Bundles,” Journal of the Brazilian Society of Mechanical Sciences and Engineering, Vol. 28, No. 2, 2006, pp. 186-199. doi:10.1590/S1678-58782006000200008
- P. R. Owen, “Buffeting Excitation of Boiler Tube Vibration,” Journal of Mechanical Engineering, Vol. 7, No. 4, 1965, pp. 431-439. doi:10.1243/JMES_JOUR_1965_007_065_02
- Y. N. Chen, “Flow-Induced Vibration and Noise in TubeBank Heat Exchangers Due to Von Karman Streets,” Journal of Engineering for Industry, Vol. 90, No. 1, 1968, pp. 134-146.
- D. S. Weaver, “Vortex Shedding and Acoustic Resonance in Heat Exchanger Tube Arrays,” In: M. K. Au Yang, Ed., Technology for the 90’s, ASME, New York, 1993, pp. 776-810.
- S. Ziada and A. Oengören, “Vortex Shedding in an InLine Tube Bundle with Large Tube Spacings,” Journal of Fluids and Structures, Vol. 7, No. 6, 1993, pp. 661-687. doi:10.1006/jfls.1993.1039
- J. S. Fitz-hugh, “Flow Induced Vibration in Heat Exchangers,” Proceedings of UKAEA/NPL International Symposium on Vibration Problems in Industry, Keswick, April 1973, pp. 1-17.
- G. J. Rae and J. S. Wharmby, “Strouhal Numbers for In-Line Tube Arrays,” Proceedings of International Conference on Flow Induced Vibrations, Bowness-on-Windermere, 1987, pp. 233-242.
- M. J. Pettigrew and D. J. Gorman, “Vibration of Heat Exchanger Tube Bundles in Liquid and Two-Phase Cross-Flow,” Proceedings of ASME Pressure Vessel and Piping Conference, Vol. 52, San Francisco, 1981, pp. 89-110.
- D. S. Weaver, J. A. Fitzpatrick and M. El Kashlan, “Strouhal Numbers for Heat Exchanger Tube Arrays in Cross Flow,” Journal of Pressure Vessel Technology, Vol. 109, No. 2, 1987, pp. 219-223. doi:10.1115/1.3264899
- R. D. Blevins and M. M. Bressler, “Acoustic Resonance in Heat Exchanger Tube Bundles—Part I: Physical Nature of the Phenomenon,” Journal of Pressure Vessel Technology, Vol. 10, No. 3, 1987, pp. 275-281. doi:10.1115/1.3264863
- R. D. Blevins and M. M. Bressler, “Acoustic Resonance in Heat Exchanger Tube Bundles—Part II: Prediction and Suppression of Resonance,” Journal of Pressure Vessel Technology, Vol. 109, No. 3, 1987, pp. 282-288. doi:10.1115/1.3264864
- H. Hamakawa, H. Matsue, E. Nishida and T. Fukano, “Acoustic Resonance and Vortex Shedding from Tube Banks of Boiler Plant,” Journal of Fluid Science and Technology, Vol. 3, No. 6, 2008, pp. 805-813. doi:10.1299/jfst.3.805
- F. L. Eisinger, R. E. Sullivan, J. T. Francis, “A Review of Acoustic Vibration Criteria Compared to In-Service Experience with Steam Generator In-Line Tube Banks,” Journal of Pressure Vessel Technology, Vol. 116, No. 1, 1994, pp. 17-23. doi:10.1115/1.2929552
- E. Nishida, M. Miki, N. Sadaoka, H. Hamakawa and T. Fukano, “Study on Acoustic Absorbers to Suppress Acoustic Resonance in Tube Bundles of Boiler,” Transactions of the Japan Society of Mechanical Engineers, Vol. 71C, No. 712, 2005, pp. 3458-3464.
- R. D. Blevins, “Flow-Induced Vibration,” Krieger Publishing Company, Melbourne, 1986.