Technology and Investment
Vol.06 No.03(2015), Article ID:59168,7 pages
10.4236/ti.2015.63015
China and Sub-Saharan Africa’s Economic Development: A Multipolar Specification
Abdelrasaq Nal1,2
1Department of Economics & Development Studies, Federal University Dutsin-Ma, Dutsin-Ma, Nigeria
2Institute for Economics Research on Innovation, Tshwane University of Technology, Pretoria, South Africa
Email: asnal@fudutsinma.edu.ng, abdelrasaq@yahoo.com
Copyright © 2015 by author and Scientific Research Publishing Inc.
This work is licensed under the Creative Commons Attribution International License (CC BY).
http://creativecommons.org/licenses/by/4.0/


Received 3 May 2015; accepted 24 August 2015; published 27 August 2015
ABSTRACT
Within the purview of contemporary international development discourse, China, alongside other regional powers are perceived as growth poles or drivers of global development. In the context of Africa’s development around which some of the emergent issues have been framed, analyses often proceed along a bilateral framework where the influence of China is isolated and assumed to be neither connected with nor shaped by the influences of other growth poles. Inspired by recent development in policy circles, this paper develops a multipolar framework to explain ways by which dimensions of possible interactions amongst activities of growth poles can affect development outcomes in other regions. It is then used to demonstrate how a nexus of Sino-EU activities has had limited impact on the development of Africa’s manufactured exports in comparison with similar nexus involving China and US.
Keywords:
Economic Development, Manufactured Export, Growth Pole, China, Sub-Saharan Africa

1. Introduction
Following the emergence of Asia, particularly China, as a credible challenger to the economic dominance of The West, a seemingly unending debate over what this means for global development was provoked1. In the context of Africa’s development around which some of the very important issues have been raised, analyses often proceed along a bipolar framework where the economics of interaction between China and Africa is conceptualized and inferences made (Jenkings and Edwards, [1] ; Jenkings and Edwards, [2] ; Na-Allah and Muchie, [3] ). A key assumption in literatures of this kind is usually that China is an independent actor whose influence is isolated from, unconnected with and unshaped by the influences of other global powers.
But signaling a fundamental departure from this traditional line of analysis is a recent policy move by the European Union (EU) and China to adopt a multilateral framework in their efforts to contribute towards Africa’s development. Precisely, at the tenth China-European Union (EU) Summit held in Beijing in November 2007, the seed for what was to manifest later in 2008 as a trilateral approach to development cooperation was sowed (European Commission, [4] ). Also known as the EU-China-Africa Dialogue the framework specifically aims to contribute to Africa’s development through the process of identification and pursuit of areas of common interests between EU, Africa and China while at the same time addressing differences through dialogue (Wissenbach, [5] ).
Attempts to capture the dynamics of this sort of multipolar interaction in current studies of the impact of China have been limited. One strand of analysis focuses on China as a competitor to Africa either in third markets or in attracting foreign direct investment (FDI) from third regions (Jenkins and Edwards, [2] ). A major limitation of this type of exercise is that China’s influence is still taken to be a product of its own solitary action/attraction and not of such action/attraction interacting with those of other growth drivers.
In Jenkins and Edwards [2] , however, we find what arguably, is the closest attempt yet at explaining how a Sino-Global effort could actually influence the course of development in some other locations. As argued, this may occur if for instance, foreign investment flow into China stimulates, as part of integrated production systems, complementary investment flow into neighboring regions participating in the production network. We can interpret this to mean an indirect case of China’s attraction as FDI destination interacting with the actions of FDI providers (other growth drives) to produce development outcomes in third regions.
Another way of looking at it could be to speculate in a more direct way that both China and other growth poles can individually initiate actions whose combined effects would have developmental consequences for other poles. This is the line of analysis we pursue in this paper. We conceptualize a model in which different combinations of actions undertaken by growth poles are assumed to impact differently on economic performances of other poles. Then situating the model in the context of China’s impact on Africa we demonstrate how a nexus of Sino-EU activities has had limited impact on the development of Africa’s manufactured exports in comparison with similar nexus involving China and US.
In the section that follows the reference, analytical model is developed. This is followed by a brief review of the experience of Africa with manufactured export performance in Section 3. Explaining this performance especially with respect to the continent’s relative strong showing in apparel is the focus of Section 4. The paper’s concluding remarks is contained in Section 5.
2. Analytical Construct
Assume as in Figure 1 below that we have a tripolar world comprising two growth drivers, (say χ1 and χ2) and a beneficiary pole (say, ý). Both χ1 and χ2 are developed economies while ý is relatively underdeveloped. Based

Figure 1. Tripolar world comprising two growth drivers (χ1 and χ2) and a beneficiary (ý).
on insights from literature, export performance potential of ý is taken to be a function of two major conditions: market access and supply capability (Fugazza, [6] )2.
However, because of its relative backwardness the market access and supply capability conditions facing ý is very poor and as such the economy could not record any meaningful achievement in its export drive. If we assume further that the developed economies (χ poles) are endowed with certain economic attributes that can help improve conditions in ý and stimulate its exports the following three scenarios can be conceptualized.
First Scenario: If the χ poles have large internal markets, they can extend preferential trade treatments to their imports of goods originating from ý and consequently improve the quality of market access condition facing it. However, in terms of impact on export such move will amount to naught if because of the poor quality of its supply condition ý is unable to produce and deliver the needed goods.
Second Scenario: If firms from both developed economies possess the technological capability required to produce a given good and they decide to invest directly in the economy of ý they would inadvertently be transferring this technology to the economy. This type of move can help strengthen supply capability of ý. But in terms of impact on exports this would not be sufficient as long as the other part of the equation-market access condition remains unfavourable.
Third Scenario: A third but different scenario however, obtains if one χ pole say χ1 has large internal market and the other say χ2 parades firms with strong production capabilities. Assuming they both externalize these values for the benefit of ý we can expect both supply and market access conditions of ý to improve. If this is the case, it also follows that there would be significant export performance response on the part of ý.
What this implies for an analysis of influences of growth poles on beneficiaries is that the way values externalized by the former interact with one another matter for development outcome in the latter. Abstracting from Jenkings and Edwards’ [2] charaterisation, these interactions can be captured in terms of their competitive and complimentary effect. A competitive form as in the first and second scenarios produces no real impact on development in beneficiary pole while a complimentary form as in the third scenario produces significant development outcome for ý.
However, whether it is the competitive or complimentary form of interaction that obtains, we argue that a lot depends on development attributes of the drivers. If the drivers share similar development attributes, they are more likely to externalize similar values that compete with each other and crowd out one another from the perspective of their impact on development in beneficiary pole. On the other hand, if these attributes diverge, the values they externalize can complement each other thereby assuring significant value capture by beneficiary pole.
Using stage of development as an example of this development attribute where χ1 represents country in advanced stage of economic development and χ2 represents country in emerging stage or recent arrival to the league of developed economies Figure 2 below provides an illustration of the pattern of interaction that results from simulations of possible scenarios3.

Figure 2. Pattern of value interaction for each intersection of stages of development.
In Section 4, we apply the insight developed in this Section to explain the performance of African manufactured exports in the area of apparel. As a background to this exercise however, we first present in the next section (Section 3) a brief discussion of Africa’s experience with manufactured exports.
3. Performance of African Manufactured Exports
3.1. Importance of Manufactured Exports
If recent economic performances of countries of Asia are anything to go by it would be difficult to challenge the argument that export of manufactured goods represents a viable strategic instrument of economic development. This notwithstanding, recent literature provides considerable evidence on the positive impact of manufactured exports on growth accelerations of countries (Hausmann, Pritchett and Rodrik [7] ; Pattillo et al. [8] ; Jones and Olken [9] ).
From sub-Sahara African perspective there are good reasons why manufactured export development should be of interest to its economic planners (UNCTAD, [10] ): firstly, export of manufactures provides a viable alternative to the region’s historic dependence on low value primary commodity exports. Secondly, because of their diversified demand attribute, manufactured products offer better potential for market growth than primary commodity that Africa has long relied on. Thirdly, the small size of many of the continent’s domestic markets and their inherent inability to absorb large output presents a compelling case for looking outward through exports. Such a focus on the large external market, it is further claimed, can help firms achieve scale economies required for international competitiveness (Hoekman and Ozden, [11] ).
It will be quite inaccurate to claim that African policymakers are unaware of all these and have not taken deliberate steps to promote export of their manufactures. Even if it is only at the level of policy statements we can point to number of declarations in favour of this ambition: from the Lagos Plan of Action to the recently adopted NEPAD framework, the continent’s policy makers have in one way or another sought to promote the production and export of manufactured goods (Organisation of African Unity, [12] ; African Union, [13] ). But as is the case with articulation of several other policies it should be clear from the following analysis that translating this into reality has remained a knotty problem over the years.
3.2. Africa Manufactured Export Performance
For much of the last three decades, Africa’s experience with export of manufactures has been quite dismal (UNCTAD, [10] ): between 1980 and 1999 the share of an average constituent country’s manufacturing exports to GDP was less than 10 percent; furthermore, while the continent’s share of manufacturing exports to total merchandise exports was around 26 percent between 2000 and 2006, other developing regions of East Asia, South Asia and Latin America had 91.9 percent, 56.3 percent and 54.5 percent respectively4.
Analysis at sectoral level further reveals that product areas where Africa is having some visible shares of world exports are few5 (see Table 1). Even here, many of these are allied to location specific natural resource endowments of countries: suggesting the law of comparative advantage is probably at work.
However, existence of dynamic capability may be argued in some other cases like apparel where production competence is not location specific but induced. This is why it is the product item we have taken up for closer scrutiny in the present analysis.
4. Explaining Performance of Apparel Exports
Extant literature argues that export performance of any nation is a function of both supply and demand capabilities. The current marginalization of Africa in global trade of manufactures is, according to many experts, not unconnected with the poor qualities of these conditions (Fugazza, [6] ). Supply related factors often cited include the poor access of sub-Sahara African nations to good technology of production while market access related factor such as trade barriers have been listed among explanations for the poor quality of demand for goods of African origin (Fugazza, [6] ; Na-Allah and Muchie, [14] ). It thus follows that, other things being equal, we may expect improved technological production capability and reduction of trade restrictions to associate with positive

Table 1. Sub-Saharan Africa excluding South Africa: shares in global manufactured exports, 1999-2006 (Value terms, per cent).
Source: adapted from UNCTAD [10] .
export performance.
In the case of apparel while the Chinese have emerged in recent decades as custodian of its frontier production technology its largest markets are found in the European Union (EU) and the United States (US). These attributes make the three poles strategically positioned to influence the course of apparel export development in other regions. For instance, a massive direct investment inflow from Chinese firms can help boost supply capabilities through the transfer of technology to host economy that would accompany it. On the other hand, reduction or elimination of trade restrictions in the EU and/or the US would go a long way in improving the quality of demand facing beneficiary exporters. One may therefore speculate that export performance outcome for an outside region will incontrovertibly depend on how such region engages with these growth poles.
With respect to SSA, we begin the analysis by reference to Figure 3. In this Figure, a chart illustrating the values of apparel exports from the Southern African Customs Union area (SACU) to rest of the world for the period 1995-2004 is presented6.
From Figure 3, we can easily notice three major episodes: the pre-2000; the post-2000 up till 2004; and the post 2004. The pre-2000 event is characterized by relatively insignificant export performances of countries in the Union while the post-2000 up till 2004 sees major rises and highly significant achievements. For the post 2004 period we observe a sharp decline in this performance.
The pre-2000 years is characterized by relatively weak engagement of African countries with the EU, US and China. On the demand side, exports of apparel from SSA that SACU belongs were subjected to high trade barriers in both the EU and the US markets and market related incentives were virtually nonexistent during the period. In fact, only the EU, through its Lome Convention and Generalised Systems of Preferences (GSP) had preferential market access programs that extended product coverage to apparel originating from SSA. However, due to the paltry nature of the preference margins as well as imposition of other restrictive conditions like Rules of Origin (RoO) requirements the market access values of these programmes were quite insignificant. The US GSP that was in place for the benefit of African exports at the time did not extend its coverage to apparel.
It is probably as a result of this poor access to markets in both the EU and the US that there was a limited presence of Chinese firms in the region. As both demand and supply conditions were poor, the insignificant export recorded during the period is not surprising.
Situation was however, quite different in the post-2000 up to 2004 era. There was an improved and decidedly strong engagement with the poles. This in turn helped improve the demand and supply conditions for apparel exports. Demand related developments include the establishment of two preferential trade programmes that sought to lower restrictions on exports of African apparel into the EU and the US markets: the US launched the African Growth and Opportunity Act in 2000 while the EU introduced the Everything But Arms (EBA) in 2001. In terms of market access value, these programmes were significant improvements on previous EU Schemes as not only were preferential margins substantial the RoOs were equally more liberal. As a result there was a strong export market demand for SSA apparel.
But while demand improvement is a necessary condition for export stimulation it is not sufficient unless there
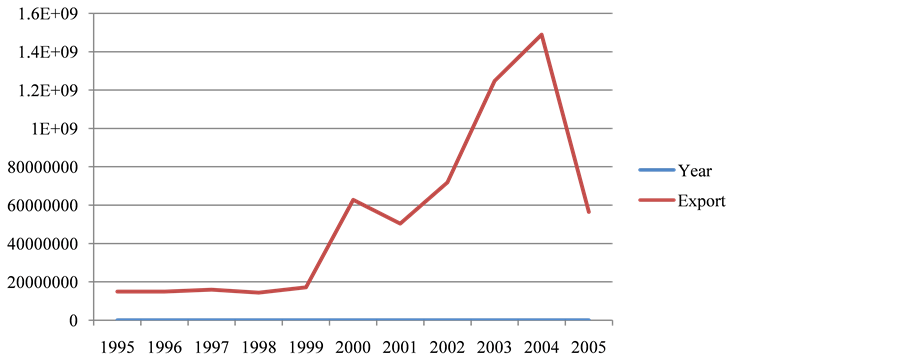
Figure 3. Value of total apparel exports from SACU to rest of the world, 1995-2004 ($US). Source: UN Comtrade.

Figure 4. Value of total apparel exports from SACU to rest of the world, EU and US, 1995-2004 ($US). Source: UN Comtrade.
is a corresponding improvement in the supply condition. This came by way of direct investment inflow from Chinese and other Asian firms. For instance, around half of the largest apparel firms that drove export in Lesotho (the leading exporter from SACU) during the post 2000 era came on board after 1999 and they were mostly from the Taiwan Province of China (UNCTAD, [15] ). Also, over 70 percent of the stock of textile and clothing firms that produced for exports in Swaziland (another leading exporter from SACU) in the post 2000 era was established by Chinese firms and virtually all of them began operation during the year 2000 and beyond (Madonsela, [16] ). The presence of these firms helped build the technological capability needed to respond to demand condition and the result was the significant export showing that is revealed in the Figure (Figure 3).
The post 2004 period however, marked a return to an era of weak international engagements with growth poles as the hitherto demand stimulating AGOA incentives lost its significance due to the erosion of preference brought about by expiration of the Multi Fiber Agreement (MFA) quota. This development echoed on the supply side via a swift and massive divestment of Chinese and Asian firms from the region (Bennett, [17] ; Kaplinsky and Morris, [18] ; Na-Allah and Muchie, [3] )
Returning to the big picture, one thing worthy of close attention is the distribution of SACU export achievements among the EU and the US. It is observed from Figure 4 that the US claimed a much larger share of the total SACU exports to Rest of the World than the EU. This reflects two things.
The first is the competitive effect of similar values (market access) externalized by two growth poles in similar stages of development (EU and US). The crowd out of exports to the EU market by the US should be expected because the US African Growth and Opportunity Act Scheme provided better market access incentives than the EU’s everything but Arms Initiative. For instance, AGOA had more liberal RoO requirements for many of its beneficiaries than EBA had.
The second is the complimentary effect of different values externalized by two growth poles in different stages of development: US and China. While the US offered demanded related market access facility, China provided supply related production capabilities. This complementarity was further enhanced by the fact that the orientation of Chinese apparel production technology was towards the US, and not the EU, market7.
5. Conclusions
As the search for better understanding of how the rise of China is impacting on development outcome in Africa continues, this paper has provided a glimpse of evidence on how a multipolar approach to the analysis can be insightful. We moved from the premise that there are development outcomes that can be detected when activities of growth poles are seen as interacting with and complimenting one another that may not be visible when each of them is considered in isolation. This framework was then applied to a Sino-Global-Africa context to study how different combinations of China’s partnerships with other growth poles influenced the course of development
in Africa. The main result of our exercise revealed that the interaction of values externalized by the EU and China had far less impact on development outcome in Africa than the interactions of similar values externalized by the US and China. In other words, when we considered the combined effect of market access priviledges and transfer of production technology that the US and China respectively externalized to African countries, we found that African exports responded far more significantly than responses attributable to similar combination of values externalized by China and EU.
What does this tell us in terms of policy message? It is simply that any growth pole interested in making meaningful impacts on development in other regions must be sensitive to how their own activities interact with activities of other growth poles. On the part of beneficiaries as well, making the most out of their integration with growth poles would require that their policymakers focus on the collective rather than the individual attractions of actors they engage with.
Cite this paper
AbdelrasaqNal,11, (2015) China and Sub-Saharan Africa’s Economic Development: A Multipolar Specification. Technology and Investment,06,132-139. doi: 10.4236/ti.2015.63015
References
- 1. Jenkins, R. and Edwards, C. (2005) The Effect of China and India’s Growth and Trade Liberalization on Poverty in Africa. Enterplan/ODG, Report to DFID DCP70. Reading.
- 2. Jenkings, R. and Edwards, C. (2006) The Economic Impacts of China and India on Sub-Saharan Africa: Trends and Prospects. Journal of Asian Economics, 17, 207-225.
http://dx.doi.org/10.1016/j.asieco.2006.02.002 - 3. Na-Allah, A. and Muchie, M. (2010) Industrial Upgrading in Sub-Sahara Africa: The Competitive Impact of China on Supplier Linkage Development Potentials of Resident Asian Entrepreneurs. International Journal of Technological Learning, Innovation and Development, 3, 272-292.
http://dx.doi.org/10.1504/IJTLID.2010.036494 - 4. European Commission (2008) The EU, Africa and China: Towards Trilateral Dialogue and Cooperation.
- 5. Wissenbach, U. (2009) The EU’s Response to China’s Africa Safari: Can Triangular Co-Operation Match Needs & Quest? The European Journal of Development Research, 21, 662-674.
http://dx.doi.org/10.1057/ejdr.2009.25 - 6. Fugazza, M. (2004) Export Performance and Its Determinants: Supply and Demand Constraints, United Nations, New York and Geneva. UNCTAD Policy Issues in International Trade and Commodities Study Series No. 26.
- 7. Hausmann, R., Pritchett, L. and Rodrik, D. (2005) Growth Accelerations. Journal of Economic Growth, 10, 303-329.
http://dx.doi.org/10.1007/s10887-005-4712-0 - 8. Pattillo, C., Gupta, S. and Carey, K. (2005) Sustaining Growth Accelerations and Pro-Poor Growth in Africa. IMF wp 05/195.
- 9. Jones, B. and Olken, B. (2006) The Anatomy of Start-Stop Growth. NBER wp No. 11528.
http://www.econ.brown.edu/econ/events/startstop.pdf - 10. UNCTAD (2008) Economic Development in Africa 2008: Export Performance Following Trade Liberalization, Some Patterns and Policy Perspectives. United Nations, New York and Geneva.
- 11. Hoekman, B. and Ozden, C. (2005) Trade Preferences and Differential Treatment of Developing Countries: A Selective Survey. Policy Research Working Paper 3566, World Bank, Washington DC.
- 12. Organisation of African Unity (1985) Lagos Plan of Action for the Economic Development of Africa 1980-2000.
http://www.nepadst.org/doclibrary/pdfs/lagos_plan.pdf - 13. African Union (2001) The New Partnership for Africa’s Development (NEPAD).
http://www.nepad.org/system/files/NEPAD%20Framework%20(English).pdf - 14. Na-Allah, A. and Muchie, M. (2012) Social Absorption Capability, Innovation Systems and Manufactured Export Responses to Preferential Trade Incentives. Research Policy, 41, 93-101.
http://dx.doi.org/10.1016/j.respol.2011.06.002 - 15. UNCTAD (2005) TNCs and the Removal of Textiles and Clothing Quota. UNCTAD/ITE/11A/2005/1. United Nations, New York and Geneva.
- 16. Mansosela, W. (2006) The Textile and Clothing Industry of Swaziland’ in Future of the Textile and Clothing Industry in Sub-Saharan Africa. In: Jauch, H. and Traub-Merz, R., Eds., Friedrich-Ebert-Stiftung, Bonn.
- 17. Bennet, M. (2006) Lesotho’s Export: Textile and Garment Industry’ in Future of the Textile and Clothing Industry in Sub-Saharan Africa, In: Jauch, H. and Traub-Merz, R., Eds., Friedrich-Ebert-Stiftung, Bonn.
- 18. Kaplinsky, R. and Morris, M. (2006) The Asian Drivers and SSA: MFA Quota Removal and the Portents for African Industrialisation?
http://asiandrivers.open.ac.uk/documents/Kaplinsky_Morris_ADs_and_SSA_OECD_Final_May_06.pdf - 19. Gereffi, G. (1994) The Organization of Buyer-Driven Global Commodity Chains: How US Retailers Shape Overseas Production Networks in Commodity Chains and Global Capitalism. In: Gereffi, G. and Korzeniewicz, M., Eds., Praeger, Westport.
NOTES

1The West here refers to two growth poles under the leadership of The European Union (EU) and The United States of America (US).

2Supply capability in this sense refers to ability of local firms to muster and deploy the right technological competence needed to produce and make available a given product item.
3The plausibility of this stage of development-economic attribute relationship hypothesis is evident in the kind of issues that normally pitch the developed countries against their counterparts from developing countries during trade negotiations. While the former is always quick at pushing for talks on topics that reflect its comparative advantage like trade in services, intellectual property rights, investment measures etc. the latter is always more interested in securing market access for its agricultural exports.

4The 26 percent share for Africa includes contributions from the North African countries of Egypt, Morocco and Tunisia. If these were removed the figure will be significantly lower.
5Visibility is defined in terms of product groups where Africa has at least 0.5 percent share of world exports.

6Much of sub-Saharan Africa exports of clothing is concentrated in the Southern part of the continent, notably Southern African Customs Union area (SACU), Mauritius and Madagascar. Member countries of SACU are South Africa, Namibia, Botswana, Swaziland and Lesotho.

7See Gereffi [19] for detail discussion on the global organization of apparel production value chain.