Technology and Investment
Vol.5 No.3(2014), Article ID:48811,20 pages
DOI:10.4236/ti.2014.53014
Network Based Technology Roadmapping for Future Markets: Case of 3D Printing
Katherine Tucker1, David Tucker1, James Eastham2, Elizabeth Gibson1, Sumir Varma2, Tugrul Daim1
1Portland State University, Portland, OR, USA
2TriQuint Semiconductor, Hillsboro, OR, USA
Email: katherine.m.tucker@gmail.com, lakehousedave@gmail.com, tugrul@etm.pdx.edu
Copyright © 2014 by authors and Scientific Research Publishing Inc.
This work is licensed under the Creative Commons Attribution International License (CC BY).
http://creativecommons.org/licenses/by/4.0/


Received 10 June 2014; revised 15 July 2014; accepted 14 August 2014
ABSTRACT
A clear and understandable Technology Roadmap (TRM) is necessary to planning and navigating change in the product development process. The fabric of the 3D printing landscape is complex and difficult to understand from single snapshot approach and a TRM is only as useful as it is understandable and easily communicable. Successful Technology Roadmapping involves expert industry analysis, technology expertise, and visual story telling. This research builds upon the principles of existing Technology Roadmapping practices to develop models that apply to the consumer market of the 3D content-to-print industry. In managing the involved complexity, multiple tools and methods have been explored, focusing on the efficacy and legibility of TRM’s. Literature review, analysis of market forces, patent analysis, and quality functional deployment (QFD) were used to establish current and future market drivers and subsequent product features. Technology forecasting and scenario analysis were then used to create product portfolios for 3D content manufactures. The application and research explored creating two future product scenario’s; a low cost (LC) product that would maintain the current state of the art performance metrics tailored to the mass market consumer and a high performance (HP) product that would continue to push the capability of the at home manufacturing performance. These bifurcating foci further complicate the visual illustration of these roadmaps. An exercise in visual display of a large blanket of networks and relationships has led to a powerful tool used to identify future reach and impacts of early technological investments.
Keywords:Technology Roadmap, 3D Printing, Technology Investment Strategies, Product Strategy, Network Based Technology Roadmap, NB-TRM

1. Introduction
3D content-to-printers can print almost anything including medical, aerospace, and automotive products to individualized home products, customized jewelry and toys. Leaders in the industry succeed leveraging their Intellectual Property in 3D printing and digital manufacturing. 3D content-to-printers have been instrumental in changing the manufacturing environment over the recent past. This emerging industry is gaining momentum. However, momentum to ensure leadership moving into the next decade must expand into the consumer market space [1] . Plans include the accelerated adoption of products and services into small scale manufacturing at home by providing more affordable and simple products. Examples of initiatives have already been launched with introduction of 3D System’s Cube™ in December, 2012 and can be followed on the cubify.com website [2] .
Because the Cube™ was a responsive action to catch the leaders in the consumer space, it is critical that the company creates a comprehensive technology roadmap (TRM) to help create a plan that supports the company’s strategic objective. While it is urgent that the range of affordable printers is extended into homes, initiatives must be executed with a comprehensive plan that tightly ties the research and development activities to the consumer market drivers. This paper not only shares a direction for future alignment of activities, but it also uncovers barriers and gaps in the current technological platform. The TRM presented in this document could be used to communicate plans and gaps to 3D content-to-print players and their development partners.
“Technology roadmapping (TRM) is a comprehensive approach for strategy planning to integrate science and technological considerations into product and business aspects” [3] . It is a tool that has been effectively used by others in the manufacturing, energy, and hi-tech industries [4] . However, to effectively use this tool, it must be modified to fit the specific needs of the 3D content-to-print business model. The literature reveals that there are many formats and types of TRMs [5] . Additionally, 3D printing is considered an emerging industry which adds to the complexity of developing a TRM [6] . In budding and complex industry, like 3D content-to-print, relationship and network mapping is an increasingly useful tool. With so much of the landscape, technological directions, and consumer values yet to be developed, relationship mapping is a powerful tool to understand the magnitude and reach of technological investments or working directions. This paper shares the research and models that have been developed to apply to the home 3D content-to-print market division in creation of this TRM.
2. Background
Three dimensional printing (3D printing) is the process of making a 3D solid object of any shape from a digital file. The technology and process was first developed by Charles Hull—a co-founder of 3D Systems; in 1984 [7] .
In this process, a sheet of photosensitive polymer material is put down, and a laser or strongly focused beam of ultraviolet light is used to “draw” an object on its surface layer–by-layer. This “exposed” object then undergoes a “cross-linking” chemical reaction using curing techniques to become a solid object [8] .
The next generation of three dimensional printing is based on a technology known as FDM or Fused Deposition Modeling, invented by Scott Crump in the late 1980’s, and commercialized by 1990 [9] , through the company Stratasys Inc, which he co-founded [10] . The FDM process works on an “additive” principle by putting down material in multiple layers, in this process, a plastic wire is threaded through a heated extrusion nozzle, which can move in an X or Y direction. The nozzle is controlled by a precision servo motor. This setup is directly linked to a computer which has a three dimensional software package. Once the nozzle is heated, the plastic will melt and can be extruded or “pushed through” the nozzle in small beads. This melted material is used to form layers, which then are built up to make the model or part [11] . The FDM method has been popularized by manufacturers of 3D printers such as Stratasys, Ltd. Some of the main applications that FDM is used for include rapid prototyping as well as in the medical field for making prosthetic and dental molds.

Table 1. Next generation product features.
Another widely used method has been Selective Laser Sintering (SLS) application. SLS Applications were originally commercialized by a company called Nova Automation, which was folded into another company DTM Corp, which then was eventually bought by 3D Systems to provide a secondary printing technology. As the name suggests, a high intensity laser is used to fuse small particles of plastic or metal together into a desired three dimensional shape by scanning cross-sections generated from a 3D digital description of the part [12] . These powders sit atop a “powder bed”. As the sintering for each layer occurs, the “bed” is lowered by one layer of thickness and subsequent application of a new layer of material. The process is then repeated till the part is completed. SLS is used for multiple applications like prototyping, toy manufacture etc. that require a high level of surface quality (finish) and resolution.
3. Methodology
With a variety of technologies and legacies driving the development of and painting the landscape of the 3D content-to-print market it was important to engage methodologies that assessed not only these technologies and features but also assessed the market forces and drivers. While important to know the current and future capabilities it is also important to understand and develop the current and future desires of the market.
A methodological approach was used to manage the complexity in the development of this TRM with the help of tools such as QFD [4] [13] [14] . Figure 1 shows how the flow was iterative and required multiple literature searches, data analysis methods and modified tools.
3.1. Market Forces
3D printing is changing the manufacturing environment. Many authors are starting to believe that “a third industrial revolution” is coming in the form of small scale manufacturing [15] [16] . One author [17] attributes this trend to “the growing consumer focus on localism, craftsmanship and sustainability.” Supporting this shift in culture and values, new manufacturing techniques allow for faster product innovations and changes. This trend will intensify as local manufacturers can quickly respond to changing local tastes of consumers. The third driving force is manufacturing cost reductions. Manufacturing efficiencies are being realized because “tools are changing in a number of remarkable ways [18] .” Many advances in conventional production equipment will result in shrinking factories and the need for factory workers. The location of manufacturing will change from a many produced in few locations model to fewer being produced in many locations model. The literature supports that the manufacturing environment is facing another industrial emergence with the additive manufacturing technology [19] .
3.2. Market Drivers
Market Drivers are the primary forces that would drive adoption of 3D printers. The following attributes were selected as primary market drivers based on the literature and market review.
Total Cost: The total cost describes the total amount of money that will be spent for the printer materials being used, software packages, as well as any external designs purchased [20] .
Usability of Software: This is a subjective driver, defining the ease of use of the software that is bundled with the printer. Due to the large variety of design formats, there are certain incompatibilities that exist between designs in one format being translated to a different one [21] -[23] .
Production Time: This describes the speed of manufacture of the product [19] [24] [25] .
Product Quality: This is defined as the finish and layering capability of the manufactured object, and how close to the original design, a manufactured object appears to be.
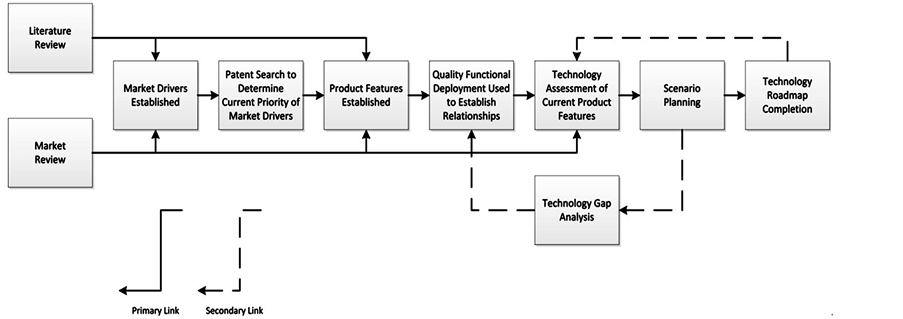
Figure 1. Methodology and flow of TRM development process.
Design Availability: Deals with the number of available design files for each model or part that are available to manufacture. This is important due to the potential for Intellectual Property issues, and was a main driver by number of citations [26] .
Safety: Safety as a market driver refers to any literature or patent references that had an improvement impact on the manufactured product. For example, this would refer to whether the object or model had an increase in the safety level, or a reduction in the smell of materials used etc. [22] .
Types of Materials Available: This refers to the availability of materials for 3-D printing. From the patent review, this was one of the highest referenced market drivers, therefore one of the most focused on areas from a development perspective [27] .
On Demand Manufacturing: Refers to the ability to manufacture in series of one. Effectively–at the press of a button. This is an attribute that driver that, although was not really cited as being as significant as others in the patent review; was very highly trending in the literature review with multiple articles citing the market strategy of many 3D printing companies being dependent on this factor [28] .
Customization: Customization refers to the degree to add personalization to the manufactured object [29] [30] .
Reverse Engineering: This driver referred to the ability of the printer to be able to potentially “break down” an object into a digitized map, which could then be used to build other objects that would be identical to the original [26] .
Product Size: Describes the maximum size that an object can be manufactured [31] .
3.3. Product Features and Technology Assessment
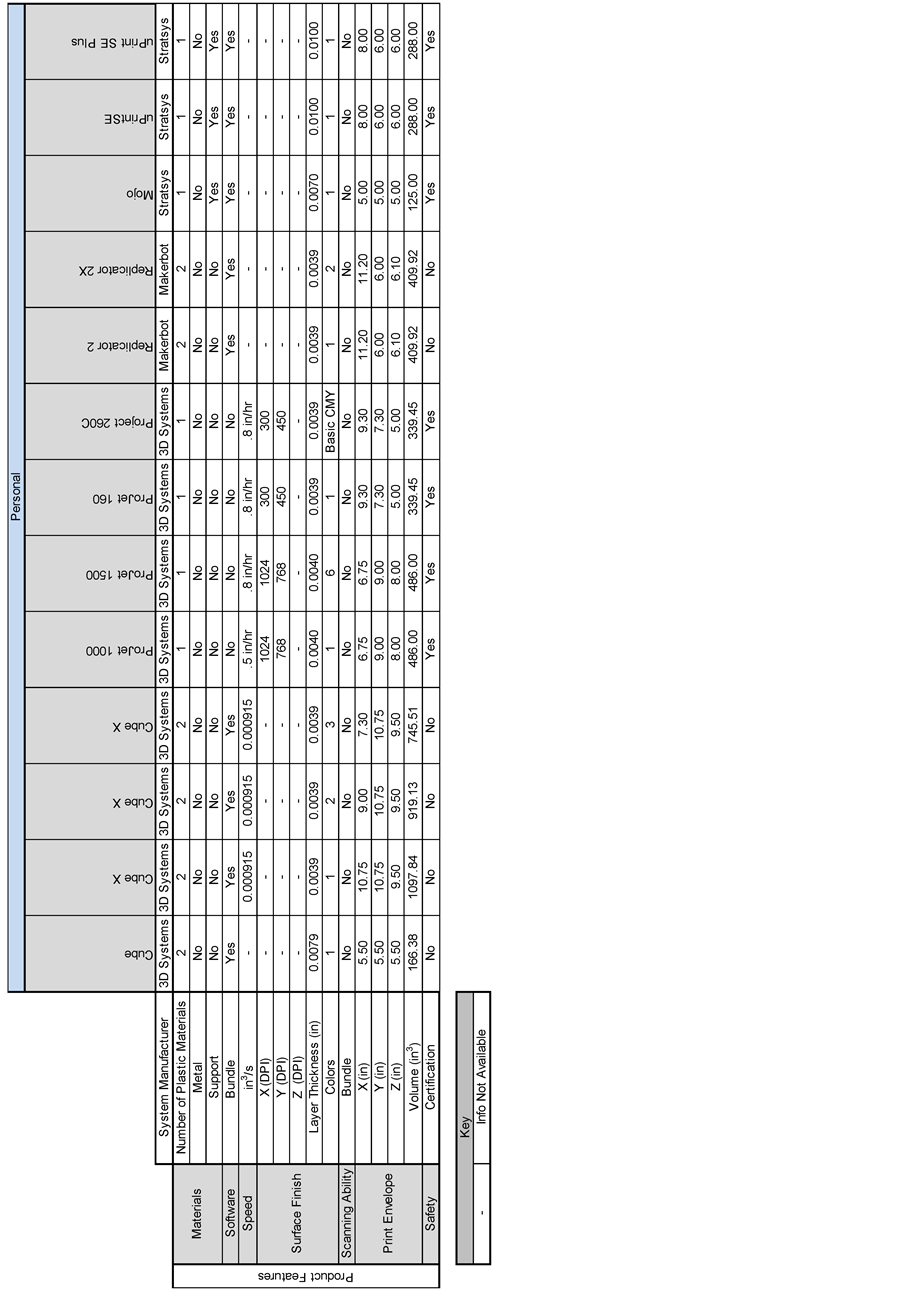
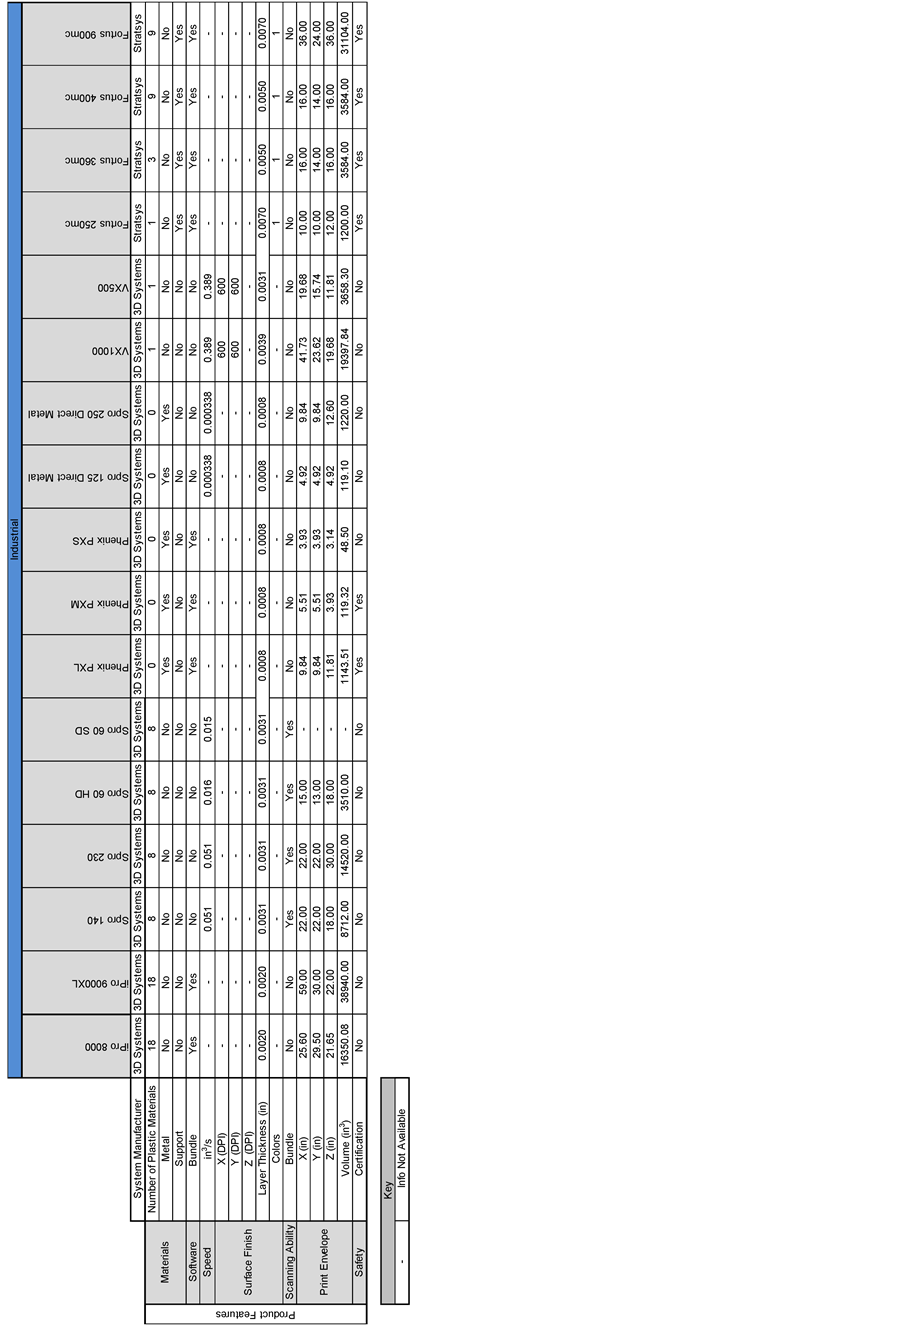
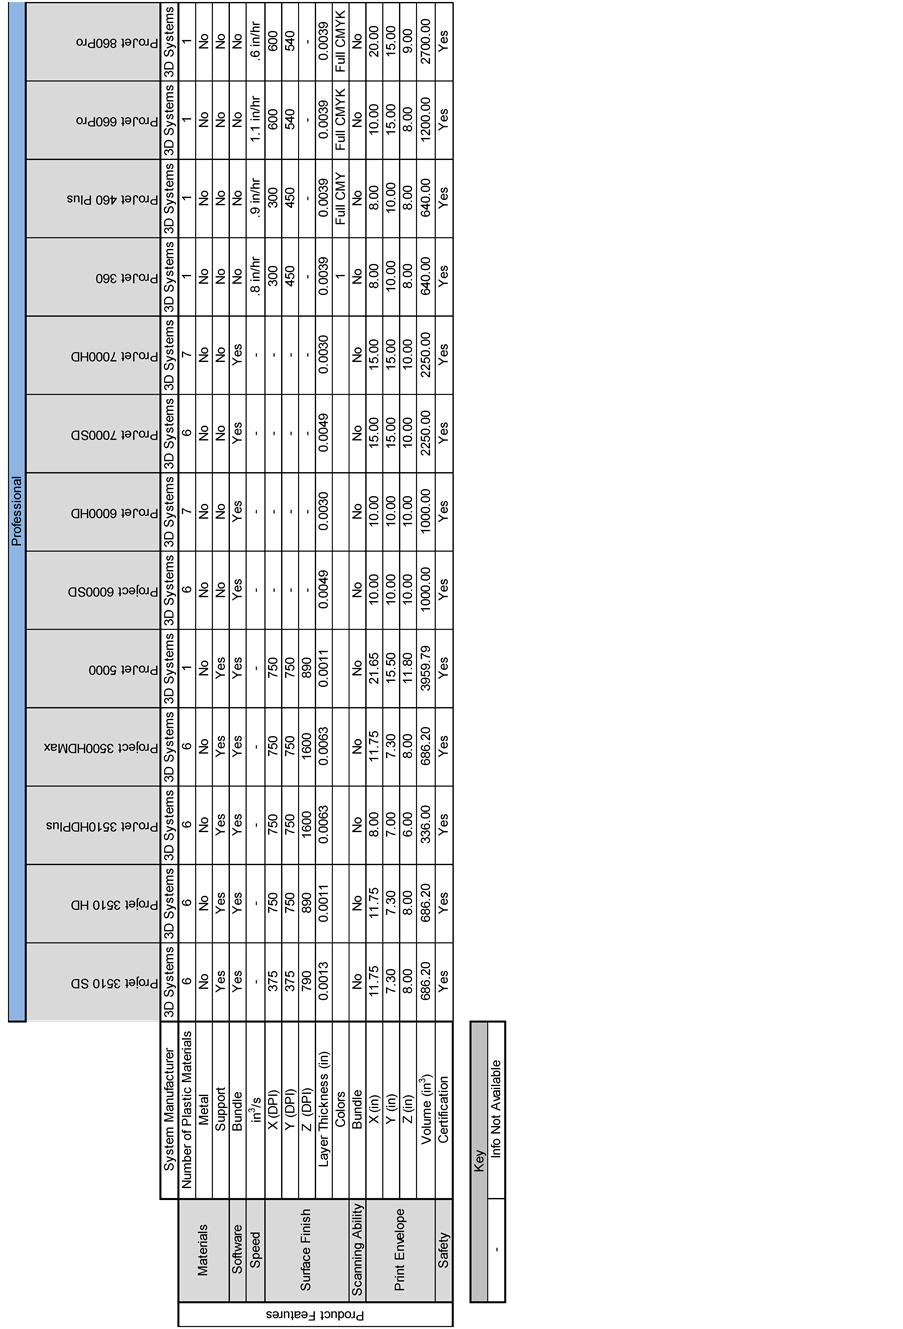
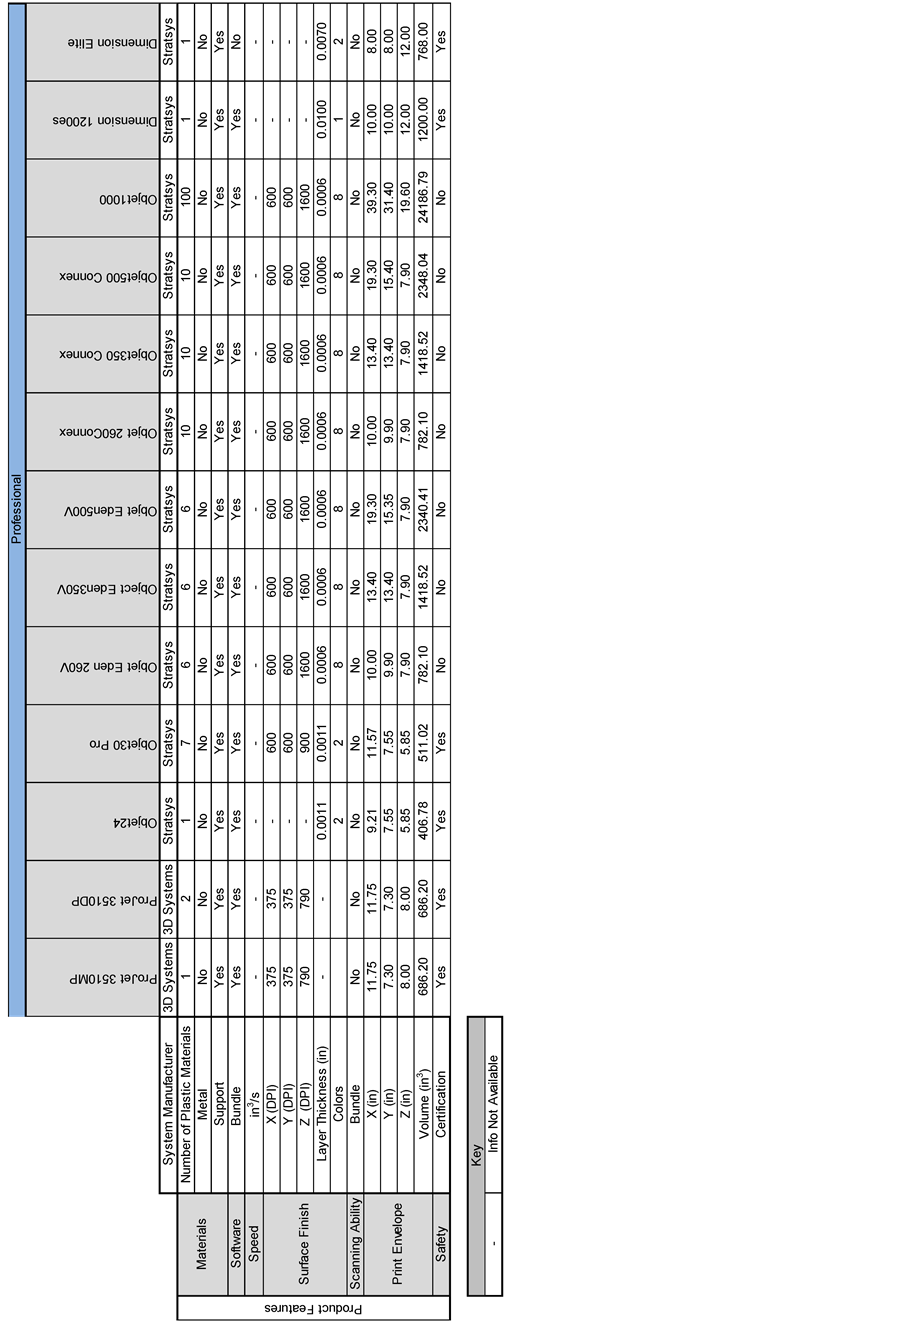
A technology assessment matrix was completed for the product features available in the marketplace today. To complete this assessment the products of Stratasys, Makerbot, and 3D Systems were benchmarked across their commercially available products in the personal, professional, and industrial product spaces. Company websites and public datasheets were used for this benchmark activity. To conduct this assessment technical brochure for the various products were reviewed online for the following product features.
Materials: Materials is defined as the type of physical matter used for the 3D process.
Speed: Speed describes how fast the 3D printer deposits material while making objects. Speed is listed in manufacture datasheets as mm/sec.
Price: The price of the initial hardware purchase and bundled software and starter materials; does not include on-going material costs, maintenance, or other fees.
Software: The software product feature describes the ease of use of the system for the typical home consumer. Current generation printers come with bundled software which supports the various ‘standard’ file formats.
Surface Finish (Resolution & Color): Resolution, or fineness of features, is directly related to the perceived quality of the printed object. A finer resolution results in smoother more detailed object features. Resolution for 3D printers is measured in microns or mm and represents the minimum height of material the printer is capable of depositing.
Scanning Ability: Scanning ability allows the user to create replicas of existing objects. A scanner is used to create a digital design file which can then be used directly or manipulated by the user. This allows users to ‘reverse engineer’ objects to avoid the need of recreating complex drawing or obtaining digital design files from the original sources.
Print Envelope: The print envelope is simply the maximum size (volume) object which can be produced by the 3D printer. A larger print envelope requires a larger 3D printer.
Safety: In addition to the obvious safety features (e.g. unit doesn’t shock the user, or cause other harm), the process of depositing the materials should be safe to the consumer. As mentioned above, heated materials can produce fumes and these fumes may be harmful to the consumer.
Using the information listed in the product brochures, an assessment table was created for each of the 3D printing categories. The Technology Assessment Tables for professional and industrial printers are listed in the attached Appendix B.
3.4. Quality Functional Deployment
To correlate the market drivers to product features a Quality Functional Deployment matrix [13] [14] was utilized. The purpose of the QFD was to connect the market drivers to the product features and establish priorities of each of the product features. To complete this analysis the priorities of the market drivers were established by data mining the United States Patent and Trademark database (www.uspto.gov). This method was used to essentially capture the commercial interest of the each market driver and assign the priority for the driver. The attached (Table A1 and Table A2) in Appendix A, titled Patent Mining Methods, identifies the process that was utilized to conduct the analysis including search keywords and dates for searching. Figure 2 illustrates the prioritization and influence that the driver has on the 3D Printing industry.
Using the priorities from the patent mining on the Market Drivers a Quality Functional Deployment Matrix was populated to correlate the market drivers to the product features identified in the technology assessment tables created previously. The goal of this analysis was to transform the priorities of the market drivers to product features and apply a prioritization to the product feature. To complete this, the market drivers where listed across the top row of the QFD. The bottom row identifies the priority that resulted from the patent mining exercise. To complete the QFD for the 3D printer application, the team first identified the product features required to support the market drivers. The second step was to apply the direction for improvement for each of the product features with respect to the market drivers. Next, the correlations between the different market drivers was identified, documenting the influence that each market drivers potentially has on the alternate market drivers. Relationships were then established between the market drivers and the product features.
The final step of the QFD assessment is to then transfer the market driver priorities to the Product Feature priorities. To complete this step, the relationships were transposed to either a 1 = strong, 0 = No Relationship, or −1 = inverse relationship. Assigning these numerical values the priorities can be transposed onto the product features. The attached Appendix C titled Quality Functional Deployment and Product Feature Prioritization illustrates the process that was used to transpose these items. Figure 3 shows the populated QFD matrix and the corresponding relationships that where built from the steps identified above.
The following radial plot (Figure 4) identifies and compares the priorities of the product features from the above QFD. As indicated by the plot the product features with the highest priority are material, speed, surface finish, and print envelope. This analysis indicates that the company should work on these higher hitters to get the most benefit from their R & D activity.
3.5. Technology Forecasting and Scenario Analysis
Based on market research, two future scenarios for the product line were created. A low cost (LC) product line would be required in the future which would maintain current state of the art performance metrics while being tailored to the mass market home consumer. A high performance (HP) product line would continue to push the envelope of at home manufacturing performance for the more sophisticated users. The HP product line would
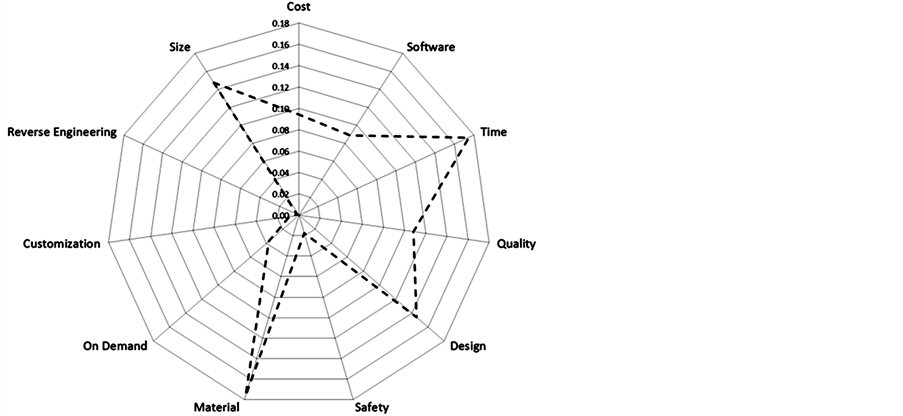
Figure 2. Market driver radial plot.
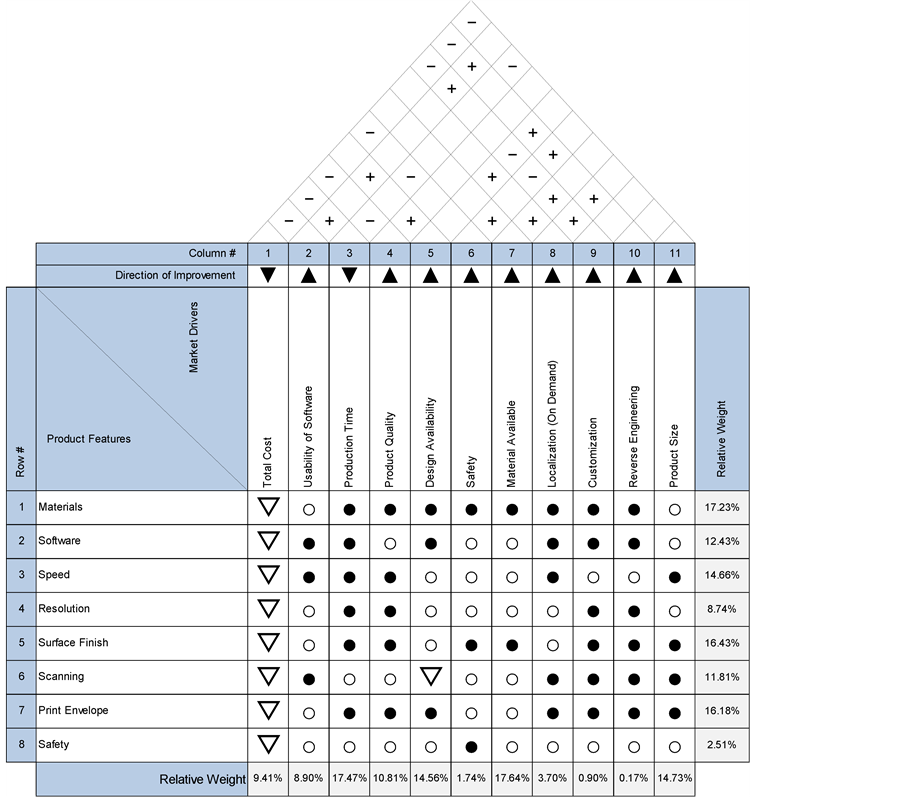
Figure 3. Quality functional deployment.
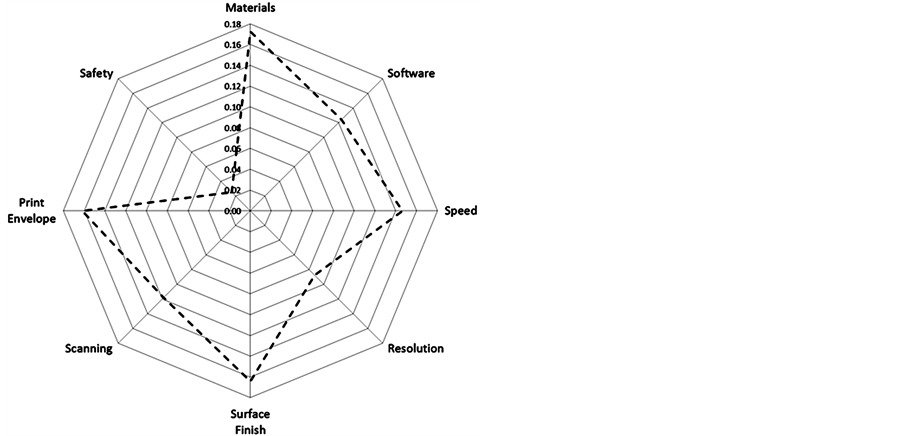
Figure 4. Product feature prioritization.
provide a platform development opportunity which could be leveraged by the LC product line, allowing the LC line to benefit from the HP R & D investments. The product line split would take place after two generations of the existing product once essential market drivers could be met (i.e. resolution, speed, colors, etc.).
Printer resolution was forecasted using an exponential trend based on actual thickness improvements and benchmarked against semiconductor feature size from 1971 to 2012 [32] [33] . Actual 3D home printer resolution trends from 2009 to 2013 seem to be following a similar trend to that of early semiconductor feature size. The trend was used to forecast future resolution out in time. Figure 5 shows the actual vs. predicted trend for layer resolution. The predicted values were used for forecasting future product requirements.
Speed was forecasted using pages per minute trends in home laser printing [34] . Home laser printing speeds have increased from <10 pages-per-minute (PPM) in the late 1980s to over 50 ppm in 2001. This trend was used as a benchmark for predicting 3D printing speeds. The power curve for predicted 3D printing speed can be seen in Figure 6.
Print envelope/volume was forecasted by looking at the maximum size the team felt the average consumer would need in terms of objects and the maximum size in terms of the actual printer appliance they could tolerate in their home. This prediction was somewhat subjective as research was limited in this area. Existing 3D printer envelopes were used to establish a somewhat linear trend which was capped off at 24” × 24” × 24”. The feeling was that most objects a consumer would need to make would be less than this size. A prediction was also made that most consumers could tolerate an appliance roughly the size of a standard cooking oven, which also has an internal cooking area/volume of 24” × 24 × 24”. Figure 7 shows the existing volumes (left) and the predicted volumes with capped line (right).
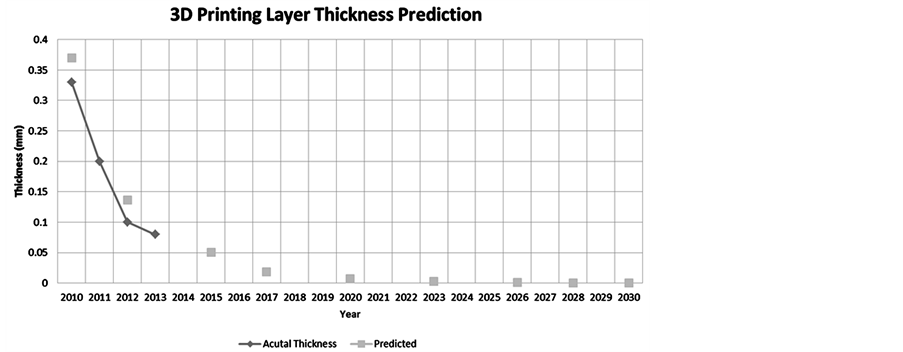
Figure 5. Layer thickness (resolution) actual (2009 to 2013).
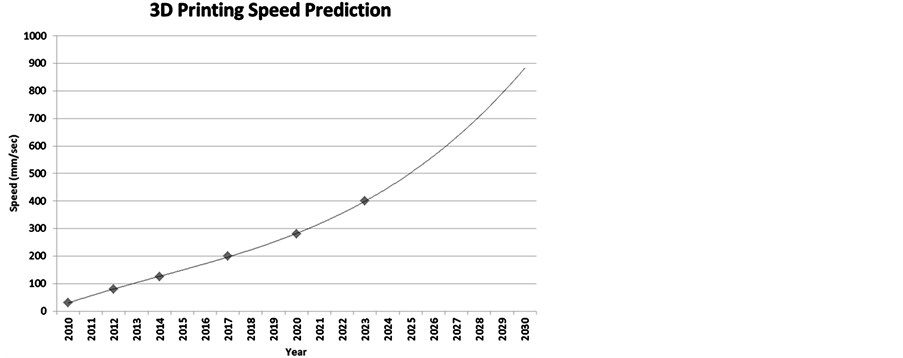
Figure 6. Predicted 3D printings speeds.
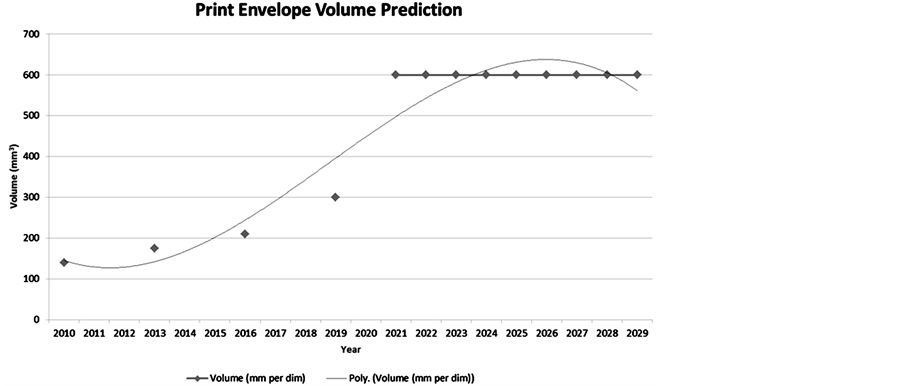
Figure 7. Print volume forecast.
3.6. Future Specifications
Based on the forecasts above, future product features were derived. Next generation, current Next Generation +1, will feature a 3 color surface finish, an enlarged print envelope, faster speed, better resolution, and other improvements. The following generation, Generation +2 product features offer more material choices, speeds of 200 mm/sec, and resolutions of .019mm. Specifications of both systems are listed in Table1
Two separate QFDs were completed to help guide the LC and HP product line product features. These QFDs are shown in Figure 8 and Figure 9 respectfully. Based on the QFD analysis, the LC product line would focus on low cost, shown as “Total Cost”, and safety. The assumption for the LC line would be that the other drivers and product features would be considered “good enough” for the average consumer and only incremental improvements would be required. Cost and Safety would become the primary drives for the LC line. For the HP line, the top product features will be materials, surface finish, and print envelope.
3.7. Network Based Technology Roadmap
Technology Roadmaps (TRM) are often several if not hundreds of pages long, which can create a disjointed story requiring a lot of cross-referencing and flipping around. With the right framework and guidance, the TRM is an effective and desirable strategy communication tool [35] . However, the visual language of strategy and innovation mapping is still not fully developed. Often information is laid out on one map, and loses effectiveness as a communication tool due to illegibility. While it is clear that the general direction of the technology momentum is forward it is hard to establish which variable dependencies and relationships.
Figure 10 is an example of how the TRM would be used to communicate interactions between quantifiable variables and viscerally subjective variables, such as future partners. Through the literature reviews, the patent analysis, Quality Functional Deployment matrices, and forecasting methodologies the Market Drivers and Product Features have a solid priority, which is indicated in by fill level of the corresponding bubble. These variables are influenced primarily by forces external to the organization and little can be done to create a change in priority. Market Drivers and progression of Product Features are predictable and understood as a known quantity.
Subject to internal influences are Technology Developments and Strategic Partnerships. Futures are full of uncertainty and determining priority of technologies and relationships in which to invest leaves a lot to chance and are hard to communicate. This blended Network TRM offers a method for prioritization of decisions that are sometimes left up to a gut feeling. The following TRM defines the importance of Technologies and Strategic Partnerships through its influence in the overall roadmap. Rather than succumbing to inefficiencies in blanket investing, the TRM identifies the efficacy of each variable, indicated by bubble size, by magnifying size based on the number of connections or relationship lines. The larger the bubble, the bigger bang for the investment buck. With a short read of the TRM it is immediately quantifiably clear where current interests lie as well as how impactful each variable is on the map to the future, hence informing opportunities for investments.
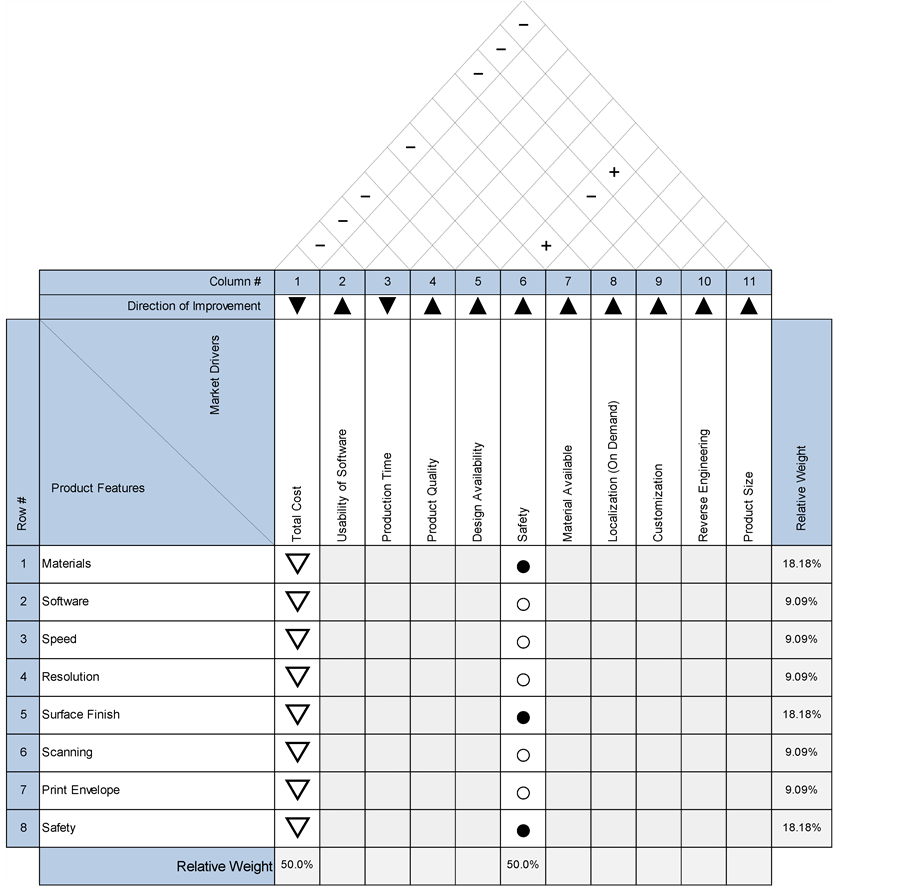
Figure 8. Low Cost QFD.
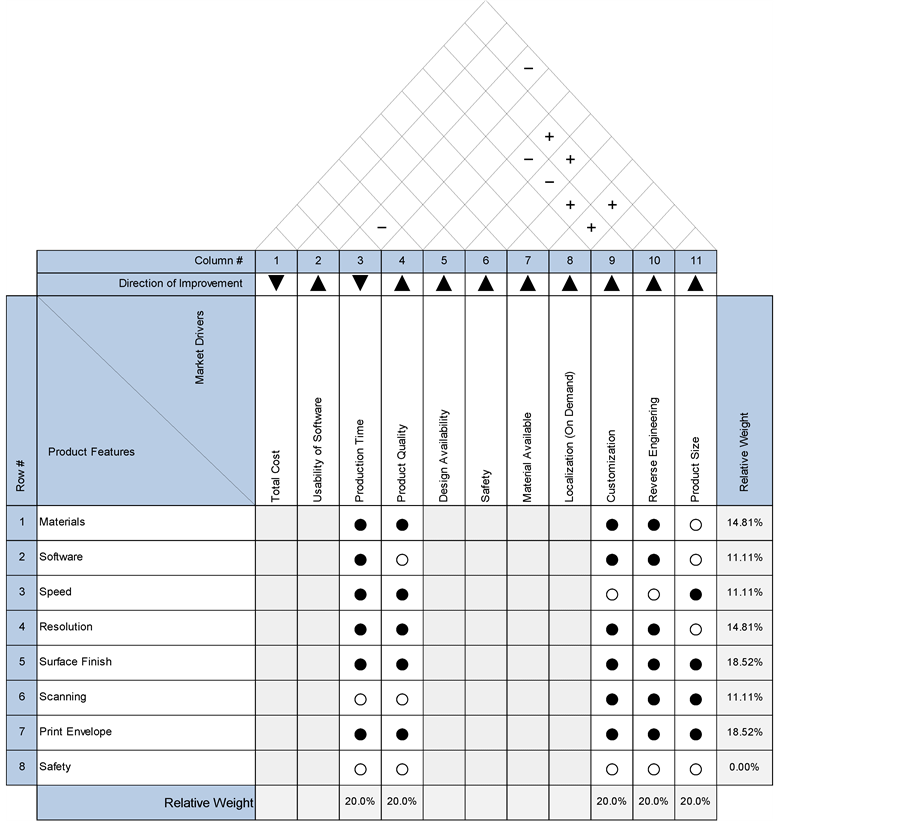
Figure 9. High performance QFD.
4. Conclusions
The amount of information needed to manage multiple product lines, technology initiatives, resources, and changes in market drivers muddle the strategy and confuse the planning process. The Technology Road Map is a keen tool for, first, unloading all of the relevant information, disregarding the unrelated information, and communicating a message through a variety of paths.
Through the methodology development of the TRM, 3D printer companies have a clear and deep understanding of the competitive landscape, internal strengths in technologies, and associated gaps/opportunities, which need to be addressed to further solidify their place in the consumer 3D printing market. Literature review and patent analysis established and prioritized Market Drivers. A detailed product roadmap was developed using the product features priorities established in the QFD Matrix along with forecasting trends using similarly high-end tech products as a trending benchmark.
A comprehensive Network Based TRM was prepared which helped visually communicate the relationship between R & D resources (internal and external), technology projects, product features, and market drivers. These graphical relationships can be used as a communication tool for the various functional groups within an organization. The use of a Network Based TRM provides several benefits to the organizations and can be coupled with alternate methodologies such as scenario planning, and critical chain. Table 2 compares some of the strengths and weaknesses of this methodology.
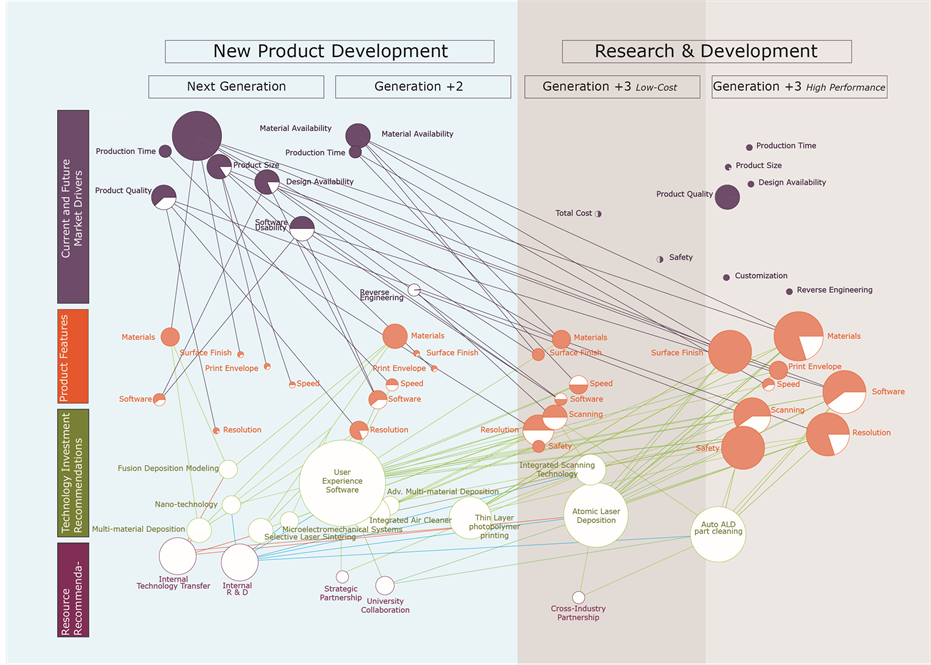
Figure 10. Network based technology roadmap.
Table 2. Network based TRM.
In this Network Based TRM, it is clear that established 3D printer companies have the technology opportunity to remain at the forefront of consumer technology by simply transferring existing technologies from the internal professional and industrial divisions. Laying the plan for the technology transfers ensures that the right parties start collaborating at the right time. With this clarity of strategy, an established company may determine that a new Internal Technology Transfer Team should be established to ensure a frequent and successful internal collaboration between product divisions. After all, the TRM does not make the decisions; it makes the decisions better informed.
References
- 3D Systems (2013) 3D Systems Investor Day Presentation. 2013 Edition, Rock Hill.
- Cubify—Express Yourself in 3D. http://cubify.com/cube/specs.aspx
- Daim, T.U. and Oliver, T. (2008) Implementing Technology Roadmap Process in the Energy Services Sector: A Case Study of a Government Agency. Technological Forecasting and Social Change, 75, 687-720. http://dx.doi.org/10.1016/j.techfore.2007.04.006
- Phaal, R., Farrukh, C.J.P. and Probert, D.R. (2004) Technology Roadmapping—A Planning Framework for Evolution and Revolution. Technological Forecasting and Social Change, 71, 5-26. http://dx.doi.org/10.1016/S0040-1625(03)00072-6
- Groenveld, P. (2007)Roadmapping Integrates Business and Technology. Research Technology Management, 50, 49-58.
- Tenenbaum, D. (2013) 3-D Printing: Wave of the Future. The Why Files University of Wisconsin-Madison. http://whyfiles.org/2013/3-d-printing-wave-of-the-future/
- 3D Systems Stereolithography Process. http://www.youtube.com/watch?v=V3URKrviXd8
- Excell, J. and Nathan, S. (2010) The Rise of Additive Manufacturing. The Engineer. http://www.theengineer.co.uk/in-depth/the-big-story/the-rise-of-additive-manufacturing/1002560.article
- Perez, B. (2013) 3D Printing Pioneer Scott Crump’s Kitchen Experiment—South China Morning Post. South China Morning Post.
- FDM Technology, about Fused Deposition Modeling. Strataysys Websibe, 2013. http://www.stratasys.com/3d-printers/technology/fdm-technology
- FDM (Fused Deposition Modeling). RP World. Net, Summary Corporation. http://rpworld.net/cms/index.php/additive-manufacturing/rp-rapid-prototyping/fdm-fused-deposition-modeling-.html
- Lou, A. and Grosvenor, C. (2012) Selective Laser Sintering, Birth of an Industry. University of Austin Cockrell School of Engineering. http://www.me.utexas.edu/news/2012/0712_sls_history.php#ch4
- Chan, L.K. and Wu, M.L. (2002) Quality Function Deployment: A Literature Review. European Journal of Operational Research, 143, 463-497.
- Mohr, J.J., Sengupta, S. and Slater, S. (2009) Marketing of High-Technology Products and Innovations. 2nd Edition, Prentice Hall, New Jersey, 132.
- Whadcock, I. (2012) A Third Industrial Revolution. The Economist, New York.
- Wagreich, S. (2013) Just Press Print: The New Industrial Age. Inc. Magazine. http://www.inc.com/magazine/201305/sam-wagreich/just-press-print-the-new-industrial-age.html
- Wand, J. (2013) How a Small Distillery Is Rethinking Manufacturing. http://www.entrepreneur.com/article/225765#ixzz2Yy5td1jv
- Steadman, I. (2013) The Race to Build the First 3D-Printed Building.
- Savitz, E. (2012) Manufacturing the Future: 10 Trends to Come in 3D Printing. Forbes. http://www.forbes.com/sites/ciocentral/2012/12/07/manufacturing-the-future-10-trends-to-come-in-3d-printing/
- Does A $347 3-D Printer Mean the Future Is Here? Or Just Paper-Thin Progress?
- Sharma, R. (2013) What Is the Thinking behind Microsoft’s 3D Printed Future? Forbes. http://www.forbes.com/sites/rakeshsharma/2013/07/19/what-is-the-thinking-behind-microsofts-3d-printed-future/
- Moilanen, J. (2012) Statistical Studies of Peer Production. Manufacturing in Motion: First Survey on 3D Printing Com-munity. http://surveys.peerproduction.net/2012/05/manufacturing-in-motion/2/
- Jewell, C. (2013) 3-D Printing and the Future of Stuff. WIPO Magazine, Geneva.
- Lipson, H. and Kurman, M. (2013) What We Do Know about the Future of 3D Printing. http://bigthink.com/in-their-own-words/what-we-do-know-about-the-future-of-3d-printing
- Friedman, P. (2012) The Achilles’ Heel of 3D Printing. Innovation Investment Journal.
- Allen, N. (2013) Why 3D Printing Is Overhyped (I Should Know, I Do It For a Living). Gizmodo. http://gizmodo.com/why-3d-printing-is-overhyped-i-should-know-i-do-it-fo-508176750
- Li, B. and Church, K. (2007) 3D Printing with Active Mixing and Depositing & Patterning of Materials. Whitepaper, nScrypt, Maryland.
- Lane, B. (2012) Are On-Demand Manufacturing Sites Changing the Market? Thomasnet News: Industry Market Trends. http://news.thomasnet.com/IMT/2012/08/07/are-on-demand-manufacturing-sites-changing-the-market/
- Rawsthorn, A. (2013) Catching up to 3D Printing; Digital Manufacturing Takes off as Technology Gets ever More Efficient. International Herald Tribune, 3-5.
- Zoran, A. (2013) Hybrid Basketry: Interweaving Digital Practice within Contemporary Craft. Leonardo, 46, 324-331. http://dx.doi.org/10.1162/LEON_a_00603
- Lemu, H.G. (2012) Study of Capabilities and Limitations of 3D Printing Technology. AIP Conference Proceedings, 1431, 857-865.
- Making Silicone Chips. Intel. http://www.intel.com/content/www/us/en/history/museum-making-silicon.html
- Lecture: IC Fabrication Technology-History. University of S. Alabama, Mobile, Alabama.
- Years, T., Laserjet, H.P. and Printers, I. (2004) Twenty Years of Innovation: HP LaserJet and Inkjet Printers 1984- 2004. 1-25.
- Phaal, R. and Muller, G. (2009) An Architectural Framework for Roadmapping: Towards Visual Strategy. Technological Forecasting and Social Change, 76, 39-49. http://dx.doi.org/10.1016/j.techfore.2008.03.018
Appendix A—Patent Mining Methods
The patent mining procedure was completed utilizing the advanced search on the United States Patent and Trademark full text and image search [29] . To complete analysis the database was queried utilizing the criteria in Table A1. The number of patents returned was then recorded in Table A1.
The patent responses from the above queries were then placed in the following table and analyzed with respect to the entire data set. The patent priority was established by dividing the keyword search by the total number of 3D printing patents. The patent priority was then normalized by taking each patent priority and dividing it by the summation of all of the patent priorities from the data set. The following table (Table A2) and expressions identify the results and formulas utilized for this analysis.
Table A1. Patent search criteria.
Table A2. Patent search results.
Expression A1: Patent Priority Formula

where:
Pi: Patent Priority (Percentage) for feature i Ki: Keyword search appearance count for feature i T: Total number of patents searched (i.e. 349)
i: Product feature of interest (i.e. Cost, Software)
Expression A2: Normalized Value Formula

where:
NVi: Patent Priority (Percentage) for feature i Ki: Keyword search appearance count for feature i Pj: Patent prioirity for feature j N: Total number of prodcut features (i.e. Cost, Software).
Appendix B—Technology Assessment Tables
Appendix C—Quality Functional Deployment and Product Feature Prioritization
A QFD matrix was completed to transpose the market driver priorities to the product feature priorities. This was completed by assigning numerical values to the correlations between market drivers and product features, a 1 = strong, 0 = No Relationship, or −1 = inverse relationship. The market drivers were transposed by multiplying the correlations by the market driver normalized values and summing them across all of the market drivers. The product feature priority was then normalized by taking each patent priority and dividing it by the summation of all of the priorities from the data set. The following table (Table C1) identifies the populated matrix and final results from the analysis.
Figure C1: Product Feature Priority Formula Product Feature Priority = (((Cost^2)*Cost Normalized Value) + ((Software^2)* Software Normalized Value) + ((Time^2)*Time Normalized Value) + ((Quality^2)Quality Normalized Value) + ((Design^2)*Design Normalized Value) + ((Safety^2)*Safety Normalized Value)+((Material^2)*Material Normalized Value) + ((On Demand^2)*On Demand Normalized Value) + ((Customization^2)*Customization Normalized Value) + ((Reverse Engineering^2)*Reverse Engineering Normalized Value) + ((Size^2)*Size Normalized Value)).
Figure C2: Normalized Value Formula Normalized Value = Product Feature Priority/Sum of Product Feature Priorities “Materials, Software… Safety”.
Table C1. Product feature prioritization.