Technology and Investment
Vol.3 No.4(2012), Article ID:24771,15 pages DOI:10.4236/ti.2012.34030
Technology Development via Human Resources Exploitation: Evidence from Southeast Asian Countries
Department of International Business and Trade, Degree of MICE Management and International Marketing, Shu-Te University, Kaohsiung, Taiwan
Email: cscsyh@.stu.edu.tw
Received August 23, 2012; revised September 23, 2012; accepted October 1, 2012
Keywords: Technology Development; Human Resources; Southeast Asian Countries
ABSTRACT
The purpose of this article is to summarize and integrate the articles appearing in this special issue within the unique technology development (TD) and human resources (HR) of Southeast Asian countries. This paper examines how the synergy between TD and HR can lead to improved national economic performance. We proposed that better HR exploitation can sustain the capabilities of TD. Thus, the detail indexes are first evaluated with each category, which constructs the basic meanings of TD and HR. Consequently, the contexts of TD are clustered by different patterns with similar attributes in each nation. Each pattern can monitor the performance of HR in specific TD pattern. In this empirical study, we discover that the leading three countries (Singapore, Malaysia, and Thailand) have a strong positive rank correlation between TD and HR; In contrast, the rest of countries are poor rank correlation with regard to the two categories. These results mention that the level of TD, which depends on HR exploitation, is an important indicator of technological capability and even a proof of economic growth. We also examine the TD policies with strategic grid and offer a better road path of TD to follow, not only for those type countries to retune their policy, but also to parallel development in HR areas—such as the level of education upgrading, labor force environment improving, man power utilizing. Finally, Southeast Asian countries should calibrate feasible HR when use it to elaborate TD.
1. Introduction
In the knowledge economy era, human resources (HR) have been regarded as the core asset of business to support the decision makers by using technology development (TD) to transform this asset to business knowledge for enhancing competitive advantage. Consequently, the depth of need and the importance of fostering the capability of HR are usually magnified in less developed (LDC) or developing countries (DC), where the marginal error is narrow due to limited or few HR. In addition, the need to develop both technologies that are transferred from the foreign agency and from indigenous research based on local HR for upgrading their technology skills is of exponential importance for the economic growth of those countries. Apparently, HR is the key element when using TD to promote economic performance. For example, Swierczek and Shrestha [1] evidenced that TD (i.e. technological capital investment and technical HR exploit) has positive impact to business performance (i.e. productivity) in the case of Japanese and Asia-Pacific banks. Yuthavong [2] also revealed that new human and social capital are needed to enhance all essential elements such as productivity-based learning, transfer of technology and development of managerial capability for the transition into a sustainable competitive economy. Konstadakopulos and Dimitrios [3] found that economic development is primarily the result of investment in capital, HR, entrepreneurship, TD, innovation and the appropriateness of institutional structures. Furthermore, TD stresses the importance of mobilizing and deploying technology based resources in combination with other HR and capabilities [4,5]. From the above studies, we recognized that TD and HR are the two key elements when we discuss the issue of how to promote business competitive advantage. However, to our knowledge, the issues of the interrelationship between TD and HR in country level or extremely in regional economic organization are seldom discussed.
TD can be derived from external or internal sources. Most LDC or DC relies on imported technology because of the absence of the internal capability to produce needed technological resources on the part of a country [6]. Although LDC and DC can bring in technical skills from developed countries, even fill gaps in their research capabilities, they still have a problem in how to transfer the technology to local companies and raise the technology level of their HR systems, e.g. education system, research environment, government budgets and projects, and the interrelationships between private company and public research institutions. Thus, the question of HR exploitation is gradually discussed by researchers. For example, researchers have viewed HR roles as transitioning from operational, administrative, functionally oriented, and reactive modes toward more strategic, consultative, business oriented, and proactive modes [7]. Ulrich has argued that these roles are imperative if HR professionals expect to create value and deliver results to their firm or country.
Given the growing pressure for HR professionals to become more of a business partner and deliver beyond day-to-day tasks to support the development and implementation of organizational strategy [8,9], HR has gradually played a more strategic role. In this role, HR decision makers may manage strategic activities, provide client services, and help build national human capital, as well as manage national change, especially with regard to the needs of TD. To find the way to exploit HR, Chee [10] addressed the importance of how HR could be enhanced through technical training, retraining and labor adjustment to meet new demands in the production process. Clark [11] also discussed the returns to human capital investment in the case of Russia and found significant and positive returns to education and training. Heijke et al. [12] further pointed out that human capital competences can distinguish discipline-specific competences, general academic competences, and management competences. Each competence is acquired from school, postgraduate, and work environment. Those training environments may have a direct or indirect pay-off in the labor market. Thus, better HR exploitation in country level can offer a specific technology workforce to boost a country’s national TD.
On the other hand, some research areas essentially deal with the choice of new technology-based tools for managing people [13] or enhancing work skill [14-19]. HR managers are looking for tools that can help them to understand better those issues on which they have to make decisions—such as managing people with the help of technological tools and the impact of technology on the performance of people at work [20]. From the above viewpoint, TD and HR have bidirectional influence on each other.
The research region, the Southeast Asian (SEA) countries, has undergone the most striking economic growth and shown an ever-increasing interdependence in the last few decades. This region has been a major contributor to global prosperity and stability. For example, its growth path was led by Japan in the 1960s and by newly industrialized countries such as South Korea and Taiwan in the 1970s and the 1980s. The new economic relationship of regionalism has been shaped by the changing world economy since the end of the Cold War. Although many countries were hit by the economic crisis in 1997, many researchers still see the regional economy as a fast growth area. After the four original tigers—Singapore, South Korea, Hong Kong, and Taiwan, which all had significant high-tech industrial development policies in order to stimulate economic growth [21], the new four—Thailand, Malaysia, Indonesia, and China are also taking advantage of their natural resources and are flourishing economically [22]. Jomo [23] further debated that it is clear from Northeast Asian experiences that there is a strong need to stimulate state-business collaboration in creating and coordinating institutions to enhance HR for technological upgrading. Southeast Asia, except for Singapore, has lacked comparable HR support to facilitate a rapid transition to higher TD. Also, the failure to develop the necessary institutions for the absorption and development of technologies in the real business sector must have limited the Southeast Asian region’s growth potential. Institutional deficiencies in Southeast Asia can be seen in the weakness or lack of institutions supporting technological deepening, HR, technology diffusion as well as disciplinary mechanisms [24,25]. Thus, by analyzing the items of sub-category for TD and HR, the context meaning between TD and HR is expected.
The organization of this paper is arranged as follows: Section 2 describes the research framework and data structure. The subsequent sections discuss the data sources and methodology. The empirical studies of SEA countries are discussed in Section 4. The conclusions and discussions are mentioned in Section 5.
2. The Research Framework and Methodology
HR exploitation usually has been regarded as important management capabilities that can use this to develop their indigenous technical ability and to enhance further their TD. We support that HR, TD, and economic growth form a triad which supports their sustaining development. Based on this concept, we present a conceptual framework to study the interrelationship between TD and HR and try to examine the variation of actual achievement of TD and HR. Following this framework, the basic items of each sub-category in the TD and HR dimension are defined to evaluate the achievement of each item.
2.1. Research Framework
From a theoretical viewpoint, technology is a critical tool used in stimulating a country’s economic growth. The TD of some countries is limited by their cultural context, unqualified HR, low productivity, and government management capability. And although some countries may follow similar paths in their TD, they may also differ in terms of the different influences of such development on economic growth. Based on these assumptions, we construct a conceptual framework to track the path of TD and examine the variations between the perceived importance of TD and its practical achievements with regards to HR.
Figure 1 shows the basic conceptual structure that this paper follows. We explain Figure 1 as follows:
• The achievements of TD: The basic items included under the heading of TD have been taken from different well-known competitiveness research groups and have been adopted by the research team comprising researchers from 10 SEA countries. Each subcategory of TD consists of hard and soft data, which were collected from 10 SEA countries. The data come from official publications and expert opinions collected by the different team members in different countries. These data are used to monitor the TD of these countries, and include basic infrastructure, information technology, energy status, R&D, technology management, technology environment, and patents and copyrights.
• Clustering: We use clustering tools to inspect the different patterns of TD in SEA countries. We then examine the significance of TD in terms of each subcategory from the outcome of TD patterns.
• Comparing the relationship between TD and HR for each pattern: The indices of TD and HR are calculated by using the weight algorithm before comparing the relationship between TD and HR. The main objective of clustering is to distinguish the TD patterns from different countries. Based on these results, we can monitor the effectiveness of TD for each SEA country.
• Retuning the current HR policies: At this stage, we examine the variations between TD and HR and retune the HR policies. These variations can be detected by using a rank correlation and strategic grid; the sub-category relationships between TD and HR in each pattern can then be observed, and the differences can be used to explain why the lower-TD countries exhibit poor economic growth. Finally, we reexamine the importance of HR and give some recommendations on how to retune HR policies.
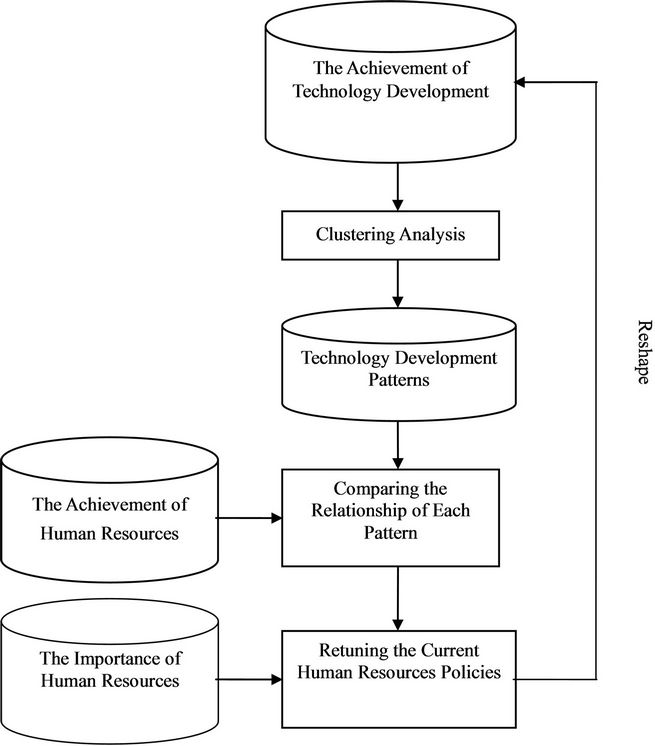
Figure 1. The research framework of TD with HR.
2.2. The Methodology for Calculating the Importance Assigned to Each Sub-Category
In order to collect data, the original sources were surveyed using questionnaires. Each questionnaire included questions regarding the perceived importance of all sub-categories and the achievement levels for items in each sub-category. The respondents were asked to evaluate the relative importance of each sub-category. Possible ratings ranged from 0 to 100; the more important the sub-category, the higher the rating. Oij is used to define the rating. The importance wij that this ith expert assigned to the jth sub-category is then calculated using Equation (1). Finally the average importance Wj of this jth subcategory according to a specific nation’s expertis determined by Equation (2).
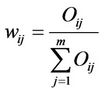 (1)
(1)
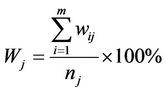 (2)
(2)
where Oij: The jth sub-category of the ith sample with a range from 0 to 100.
wij: The importance of the jth sub-category of the ith sample.
nj: The number of samples in the jth sub-category.
m: The number of sub-categories for TD or HR.
Wj: The average importance of the jth sub-category and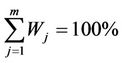 .
.
2.3. The Methodology for Calculating the Technology Development Index and Human Resources Index
IDX is defined as the sum of the products of the weight and the average achievement value of each jth sub-category included either in the TD or HR scale (e.g. TDI or HRI); that is,
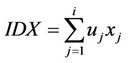 (3)
(3)
where uj: The average importance rating of the jth sub-category.
i: The number of sub-categories for each category of TD or HR.
xj: The average achievement value of the jth sub-category.
Additionally, the value of each sub-category is defined as the simple average of the ratings of all its items. So, xs can be represented as:
 (4)
(4)
where l: The number of items in the sth sub-category.
xst: The achievement value of the tth item in the sth sub-category.
3. Data Sources and Data Structure
This section explains the data sources and organizes the basic items of each sub-category in the TD and HR dimensions to evaluate the achievements of each item. All hard data are calculated by using the averages of each sub-category from the years 1999 to 2001.
3.1. Data Sources for TD and HR
The importance ratings for each category and some soft data relating to each sub-category are collected from ten different SEA countries. The original sampling plan was to select 25 respondents from the private sector, 10 from the public sector, and 15 from the academic sector. Due to technical disturbances, such as incomplete questionnaires and missing data, the configuration of actual valid samples varies among the countries surveyed. Therefore, the overall importance rating for each category is obtained by calculating the simple average of importance ratings collected from each country.
3.2. The Data Structure of TD and HR
A variety of factors influences a country’s TD and HR. For example, TD can be divided into seven sub-categories, namely basic infrastructure, information technology, energy status, R&D, technology management, technology environment, and patents and copyrights [26,27]. HR is also divided into four categories, namely manpower use, cost of wages and employee benefits, turnover, and labor disputes or industrial disputes and union power [28,29]. In order to investigate the influences of the perceived value of TD via HR with respect to the perceived importance of category as surveyed in ten SEA countries, the TD and HR in this research are defined as follows:
• Sub-categories of TD The data structure of TD consists of seven sub-categories, each sub-category being further divided into several items of hard and soft data. In Table 1, the detailed items in each sub-category of TD are listed. There are twenty six hard data and eight soft data items in this table. The items of each sub-category refer to items developed by the Institute for Management Development (IMD), the World Bank (WB), and the International Monetary
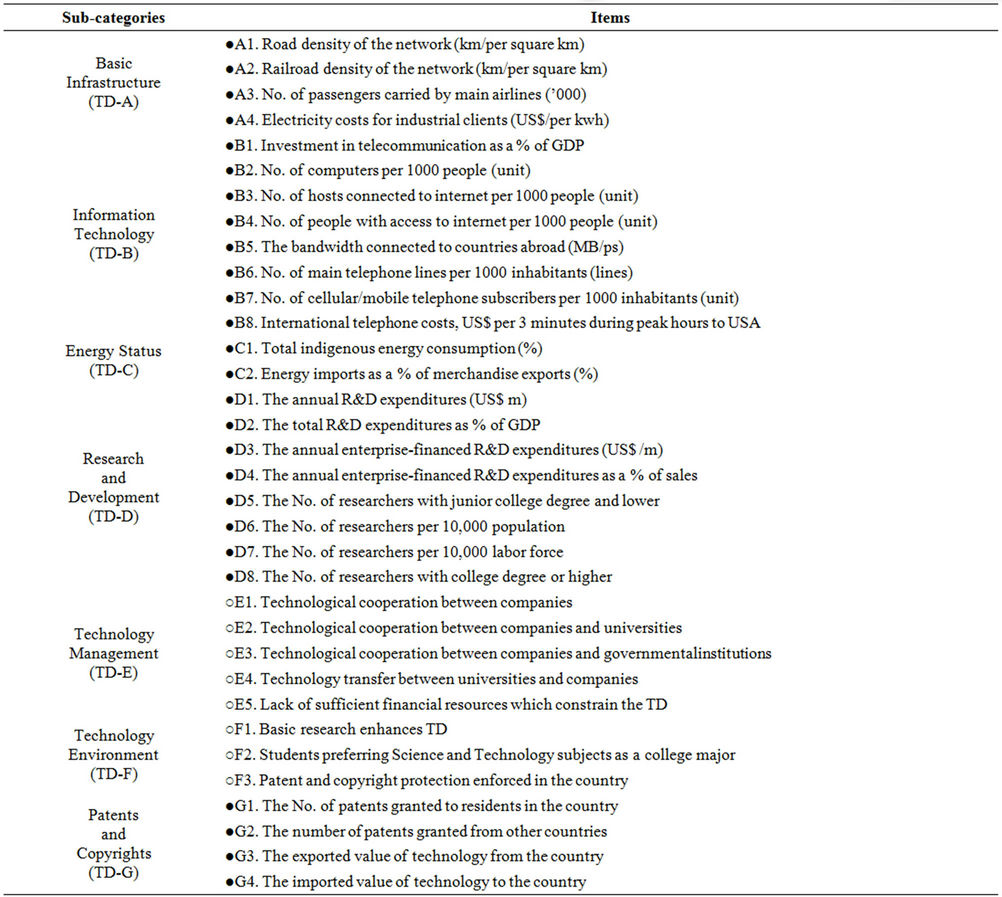
Table 1. The list of items for each TD sub-category.
Fund (IMF), as well as to the situational context of SEA countries. Hard data and soft data are employed to calculate the Technology Development Index (TDI). On the one hand, the hard data (basic infrastructure, information technology, energy status, R&D, and patents and copyrights) are collected from secondary sources such as the Asia Development Bank (ADB), government publications, and yearbooks, which are partially supplemented by local universities research teams. On the other hand, the soft data on technology management and technology environment are collected from primary sources.
• The sub-category of HR The data structure of HR consists of four sub-categories; each sub-category is further divided into several items of hard or soft data. There are ten hard data and eight soft data in Table 2. The items of each sub-category are referenced from IMD and other literature [30- 32]. Hard data and soft data are employed to calculate the Human Resources Index (HRI). The data collection methods and sources are similar to those for TD.
4. Empirical Studies
The following empirical studies follow the conceptual framework in Section 2 and were performed in SEA countries. They consist of the calculation of TDI and HRI, clustering pattern of TD, a comparison of the interrelationship between the TD and HR for each pattern, and retuning the HR policies if variations between the TD and HR exist.
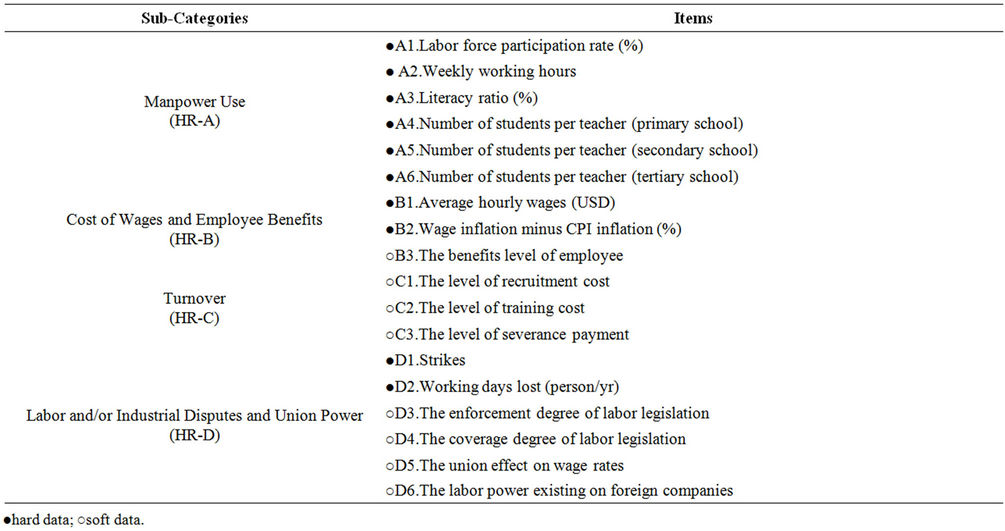
Table 2. The list of items for each HR sub-category.
4.1. The Achievement and Importance of TD
The achievement of each item of the five categories is listed in Table 3. Partial data for each item of sub-category was omitted due to technical difficulties such as no official publication on related information, missing data, etc. Thus, the sub-category of R&D and patents and copyrights are omitted in this study. The value in each item is standardized by the following equation:
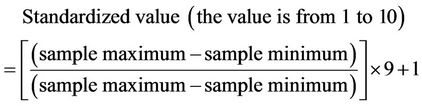 (5)
(5)
The importance of each category collected from the SEA countries is calculated by Equations (1) and (2). The values are also standardized from original data, which are calculated on a scale of 100. After calculating the achievement and importance data, we can summarize the TDI via Equation (3) and all of these data are listed in Table 4. From the rank of TDI, the first three leading countries for TD are Singapore (7.87), Malaysia (5.68), and Thailand (5.24) respectively. In contrast, the last three countries are Vietnam (3.68), Cambodia (2.99) and Myanmar (2.03).
4.2. The Achievement of HR
The HRI also consists of two parts; the first part is the rating of eight soft data items from experts’ opinions and the other part of data are collected from official government data. In evaluating the survey data, the rating score can reveal a country’s HR (listed in Table 5). From Table 5, we discover that Singapore outperforms other SEA countries, followed by Brunei, Malaysia, Thailand, Indonesia, Laos, and the Philippines respectively. Vietnam, Cambodia, and Myanmar had poorer HR. The key reasons for these three countries’ poor performance are the unclear HR policies, such as low manpower use, cost of wages and employee benefits, and employee turnover as well as the insufficient educational system, such as low student per teacher rate during the survey period.
In examining the soft data, we can also use Equation (5) to standardize data among the different units. To implement the sub-category of HR, each item of sub-category and the average of four sub-categories are listed in Table 6. From the performance of manpower use, Brunei, Singapore, Indonesia, Malaysia, and Thailand have superior performances except Brunei’s and Malaysia’s low labor force participation rate and Thailand’s low number of students per teacher (tertiary school). In addition, Brunei, Singapore, and Laos outperform the items of cost of wages & benefits level of employee. In contrast, Cambodia, Myanmar, and Vietnam have weakness in this sub-category. From the rate of turnover, Singapore, Brunei, and Malaysia have higher recruitment cost, training cost, and severance payment than other SEA countries. Additionally, in the sub-category of labor and /or industrial disputes and union power, Cambodia has a higher number of strikes and working days lost, Singapore, Malaysia, and the Philippines also have higher union effect on wage rates. Myanmar has lower the enforcement degree
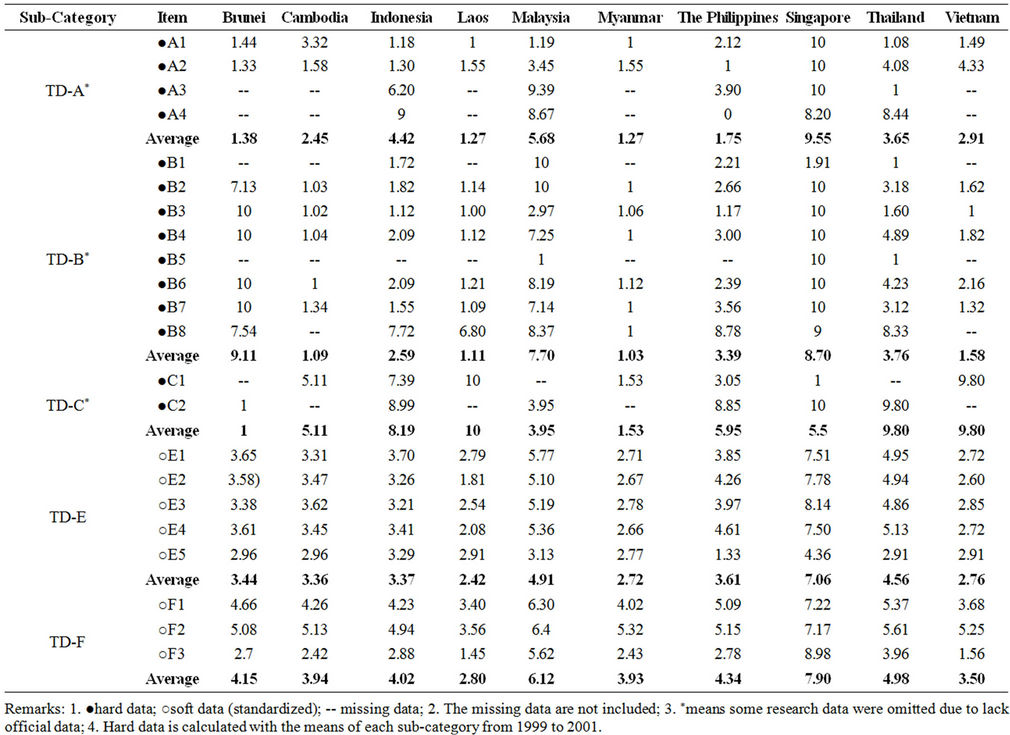
Table 3. The achievement of technology development index (standardized data).
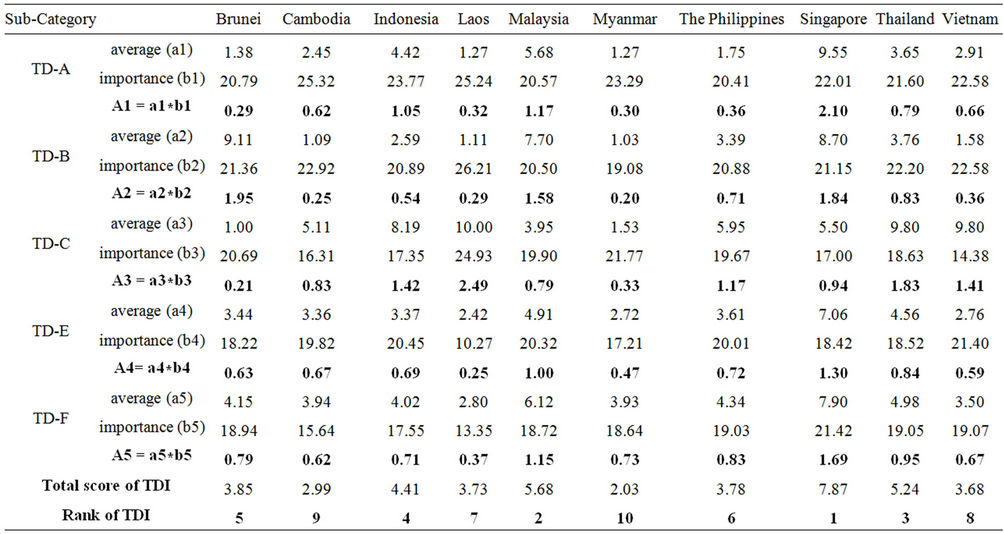
Table 4. The TDI of SEA countries.
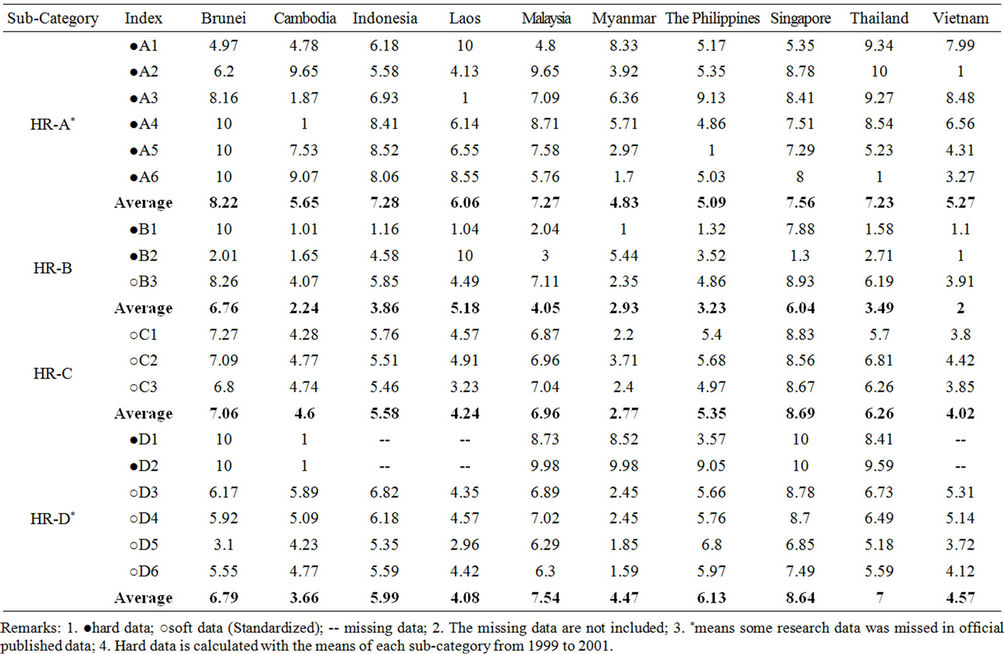
Table 5. The achievement of Human Resources (standardized data).
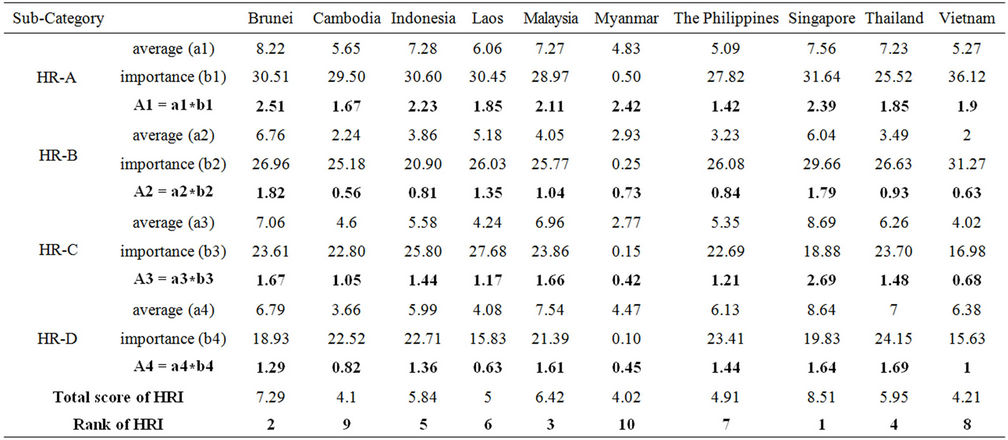
Table 6. The HRI of SEA countries.
of labor legislation, the coverage degree of labor legislation, the union effect on wage rates, and the labor power existing on foreign companies. Indonesia, Laos, and Vietnam have lack of data in items of number of strikes and working days lost.
The human resources index is calculated by Equation (3). From the total HRI score (as listed in Table 6) standpoint; the first four nations are Singapore (8.51), Brunei (7.29), Malaysia (6.42) and Thailand (5.95). The rest rankings are Indonesia (5.84), Laos (5), the Philippines (4.91), Vietnam (4.21), Cambodia (4.1) and Myanmar (4.02) respectively.
4.3. The TD Patterns of Achievement in SEA Countries
A hierarchical cluster analysis technique (using STATISTICA software) was used to study the TD data. In addition, the process of cluster analysis is based on two options, the hierarchical agglomerative method and Ward’s minimum variance method, to find the characteristics similarto all units. The former was used to determine the appropriate number of clusters; the latter was used to determine the cluster linkage. The results are presented in a tree diagram (depicted in Figure 2). A two-cluster solution was used to group TD patterns having similar profiles.
We define each cluster as “pattern type of TD” and examine variances among them with the K-means method. We discovered that the information technology and technology environment sub-categories in the TD category were significant under K-means testing (p value < 0.05), and the results are shown in Table 7.It is found that Pattern 1 countries include Singapore, Malaysia, and Brunei; Pattern 2 countries include Thailand, Indonesia, the Philippines, Cambodia, Laos, Myanmar, and Vietnam. From the viewpoint of achievements of TD, we discovered that pattern 1 countries perform better in the basic infrastructure, information technology, technology management, and technology environment sub-categories. In terms of IT sub-category, Pattern 1 countries possess an especially great advantage over those of Pattern 2.
4.4. The Rank Correlation between HR and TD for Each Pattern
Globalization and resources leverage are the key issues of discussing national environment. Many decision makers confront the challenge of competition and use TD to elaborate their economic growth. In particular, the prominence of information technology has grown substantially in recent years. Taiwan and South Korea, as a good example, had a great advancement in TD due to feasible HR plan in technology education and related system or policies. Thus, we examine the interrelationships between HR and TD and try to discover the differences for each pattern countries. Owing to the limitation of small sample (country level data) of this empirical study, we used rank correlation to indicate the relative magnitude of observations in nonparametric tests for comparison of treatments. The Spearman rank correlation coefficient is also employed as a test statistic to test a hypothesis of no association between HR and TD for each sub-category.
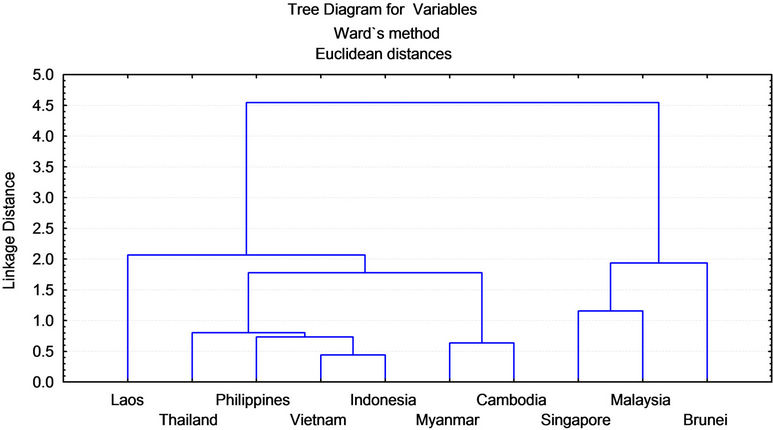
Figure 2. The tree of linkage distance for TD.
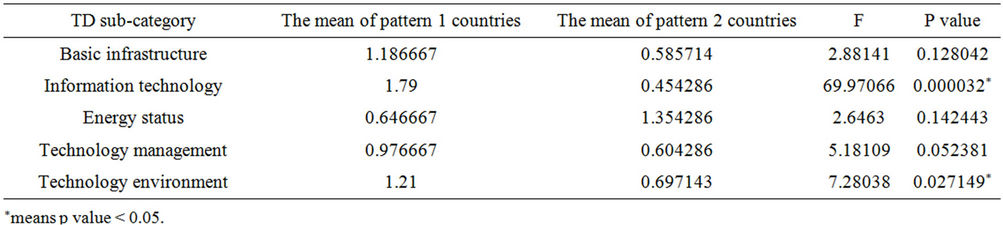
Table 7. The analysis of K-means.
The detail rank correlations are listed in Table 8. In the two patterns of each sub-category, we discover that turnover and labor and/or industrial disputes and union power have a positive correlation with basic infrastructure, information technology (except labor and/or industrial disputes and union power in Pattern 1 countries), energy status, technology management, and technology environment in two patterns. Pattern 1 countries have positive correlation with information technology in sub-category of manpower use and cost of wages and employee benefits. In addition, Pattern 2 countries have positive correlation with information technology and energy status in sub-category of cost of wages and employee benefits.
In the context of Table 8, we discover that Pattern 1 countries have insufficient HR to support TD. The main reason is due to the bias of TD in Brunei. Singapore and Malaysia still have superior performance in those of category. In addition, the utilizations of HR have taken advantage on information technology and the labor relation (i.e. labor and/or industrial disputes and union power) sustains a better relationship in most sub-category of TD (except information technology). Furthermore, turnover maintains positive relationship with TD, which means better turnover rate, can stimulate TD in Pattern 1 countries as well as Pattern 2 countries.
Pattern 2 countries have positive correlation with TD in turnover and labor and/or industrial disputes and union power (except information technology). These results are similar to the results from pattern 1 countries. In addition, the utilization of manpower use has worse performance on TD. Only cost of wages and employee benefits has positive correlation with information technology. However, those performances are still laggard than Pattern 1 countries.
From above the Spearman rank correlation analysis for each pattern, the results focus on the relationship of the sub-category of TD and HR. Thus, we intend to analyze the variances existed between TD and HR. Throughout these variances discussion, we can calibrate suitable HR policies to fulfill the TD. Based on above concept, we use the strategic grid to explain with two dimensions of TDI and HRI (depicted in Figure 3) and four types of grid are found. These types are Fitting, Retuning, Inadequate, and Ignoring. Further, the surveyed data for each sub-category are identified by their characteristics within the strategic grid. The four types are defined as follows:
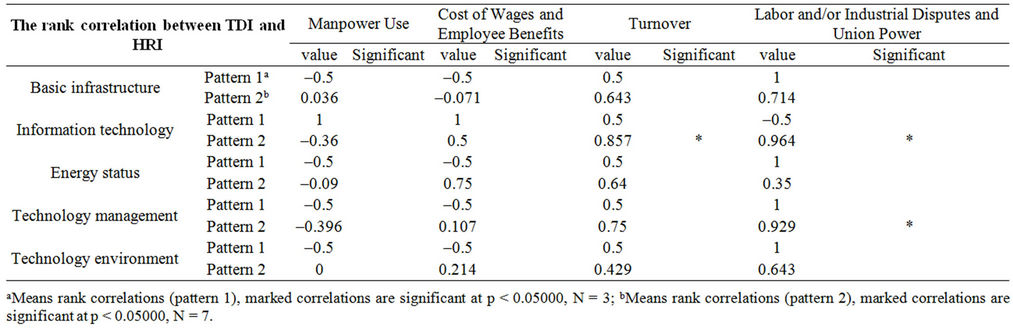
Table 8. The rank correlations between TDI and HRI sub-category.
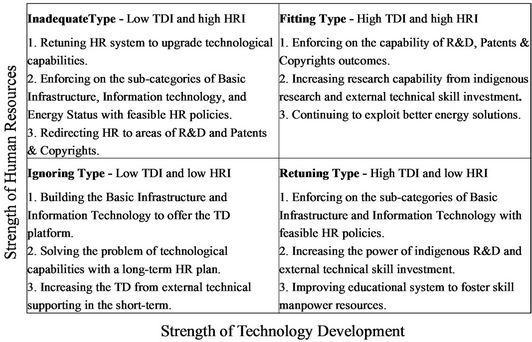
Figure 3. The strategic grid of TD and HR policies.
• Fitting type—The countries in this type has a harmonic correlation between TD and HR.
• Retuning type—The countries in this type is in a state what TD outperforms HR. Thus, these countries should retune their HR strategy to expand their benefits in accordance with their existing status.
• Inadequate type—The countries in this type have more serious variations than type 2 countries have. These countries have an inconsistent outcome between TD and HR. These variations indicate that their strategies are incoherent with the leverage of their resources. Closed inspection and review of TD and HR policies would be critical before development takes off.
• Ignoring type—The countries in this type has the most serious variation among the four types. Basically, these countries lack resources to improve their infrastructure for TD. There is no clear policy for the long-term HR of these countries.
Figure 4 presents the scatters plot with two dimensions of TDI and HRI. From the context of Figure 4, we can separate SEA countries into 4 types.
A. Fitting Type Nations:
Singapore and Malaysia are belonged to Pattern 1 countries. But, Singapore has greater performance than Malaysia in some HR sub-categories, such as cost of wages & employee benefits, turnover, and labor and/or industrial disputes and union power sub-categories. These results show that the synergy of HR bring better HR environment to support TD. In fact, Singapore has enforced the educational budget in past decade and has a better development in tertiary manpower. In contrast, Singapore has poor performance on the sub-categories of energy status, R&D, and patents and copyrights; indicating that the research capabilities are the key issues that Singapore needs to pay attention to improve by their advanced HR policies.
Malaysia is next to Singapore owing to their worse HR, such as cost of wages & employee benefits and turnover two sub-categories. However, Malaysia has begun to engage the industries to improve informational work place, especially in human resources management (HRM) within organization [33]. Therefore, increasing the capability of R&D and better basic infrastructure with regard to the better educational system and labor environment improvement are suggested.
B. Retuning Type Nations:
Although Thailand is belonged to Pattern 2 countries, Thailand has better performance than other Pattern 2 countries. To compare to Singapore and Malaysia, Thailand has similar track with Malaysia in HR and has poor cost of wages and employee benefits comparing to Singapore. This is due to a low average hourly wages and the benefits level of employee. Thus, Thailand should retune its HR policies in order to improve their employee welfare, such as compensation system, benefits system, and work security. By the way of improving employee benefits, the performance of TD can be upgraded. In addition, Thailand has hindered by its weak technological infrastructure, such as basic infrastructure, technology management, and technology environment. Therefore, improving the basic technological infrastructure including hardware and software is another important issue.

Figure 4. The scatter plot of SEA countries.
C. Inadequate Type Nations:
Broadly speaking, SEA is rich in energy resources. It is a major producer of oil and gas in the Asia-Pacific region. Brunei and Indonesia are ranked among the world’s top five liquid natural gas (LNG) producers. SEA controls some 40 per cent of the entire oil and gas resources in the Asia-Pacific region and oil & gas exports generate an annual value of US $48 billion for the SEA economies [34]. But, the plentiful resources can’t bring benefit to their TD. For example, Brunei is limiting in their poor Basic Infrastructure in technology and business. Although Brunei has a better HR (in fact, Brunei has high importance in manpower use sub-category) because of their high number of students per teacher (include primary, secondary, and tertiary school), Brunei is still a laggard in labor and/or industrial disputes and union power sub-category. Therefore, Brunei has a big growing space to retune their HR strategies in order to reshape their basic infrastructure and information technology.
D. Ignoring Type Nations:
These type nations include most of Pattern 2 countries, such as Indonesia, Laos, the Philippines, Vietnam, Cambodia, and Myanmar. Basically, these countries have weak basic infrastructure as well as are lack of information technology (especially in Myanmar and Cambodia). Although they had pay attention to their manpower use (according to their importance of each sub-category), the quality of manpower and tertiary educational system are worse than Pattern 1 countries have. Thus, the whole socio-economic system still sustains at agro-cultural level. They need to improve the infrastructure of HR and TD in order to improve investment environment and attract international investment on technology. According to Table 9, we discovered that Vietnam and the Philippines had better FDI than other ignoring type countries. But, these two countries also had negative growth during 1999 to 2003. Furthermore, technological manpower is depended on their educational system improvement in totality. The Philippines, Cambodia, and Myanmar have impressed worse rate of students per teacher; Laos and Cambodia have low literacy rate in their survey data. Thus, poor knowledge environment leads to a lower skill manpower using and is lack of the sufficient resources to improve their technological skill. These countries suffer from the dilemma both TD and HR in future study. Also, some countries such as Cambodia, Laos, Vietnam, and Myanmar, had a low economic competitiveness that had led to the lower wages and benefits. Thus, improving the economic growth through better TD and HR is the emerging topic for these countries.
Indonesia has superior performance in TD and worse performance in HR when compare to Brunei. Although, its TD’s performance is better than Brunei, the results are apparently less than Pattern 1 countries. From examining the foreign direct investment (FDI) from 1999 to 2003 (listed in Table 8), Pattern 2 countries have worse than pattern 1 countries results. The key reason is that Indonesia had four years’ negative growth due to their unstable investment environment. Also, these results lead to worse TD. Thus, how to use the outcome of natural resources and the suitable HR to foster the infrastructure of TD is the key issue for Indonesia. Consequently, combining the synergy of energy resources, HR, and technological environment sustaining can speed up the development of technological skill.
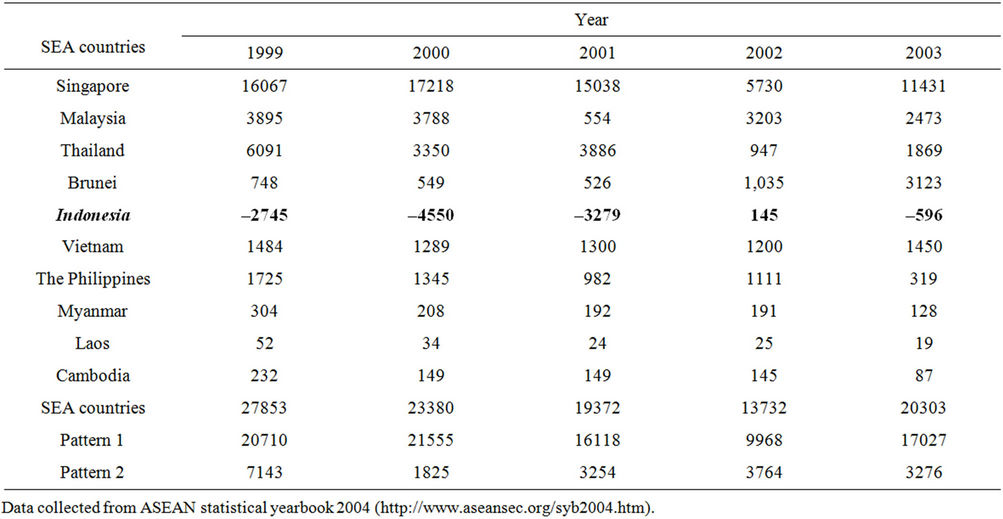
Table 9. FDI inflows into SEA countries from 1999 to 2003 (US $ Million).
In summary, Pattern 1 countries have superior FDI to Pattern 2 countries. That is the reason why Pattern 1 countries have better TD performance than Pattern 2 countries have. These results are also identified from their national competitiveness of IMD or WEF. Thus, the context of this strategic grid has applied a clear path to describe the relationship between TD and HR. In addition, analyzing these relationships among SEA countries can explore the importance of HRM in DC and LDC when these countries eager to develop their TD.
5. Conclusions and Discussions
In this research, we have proposed a framework to discuss the interrelationships between TD and HR. From the empirical studies, two patterns of TD were discovered from cluster analysis in SEA countries. We use these country’s patterns to monitor the relationship and detect the variations between TD and HR from two patterns. Each index of sub-category is calculated from the predefined methodology. The phenomenon of relationship can explain the supplementary effect of HR that contributes toward the TD.
From the attribute of TD patterns, Pattern 1 countries include Singapore, Malaysia and Brunei, which are defined high TD countries; Pattern 2 countries include the rest of countries, which are defined low TD countries. In addition, throughout the correlation test with each subcategory of TD and HR, the sub-categories of TD have highly rank correlations with turnover and labor and/or industrial disputes and union power in most part of Pattern 1 and Pattern 2 countries. Especially, information technology has taken advantage on manpower use and cost wages and employee benefits in Pattern 1 countries. In contrast, Pattern 2 countries have lower rank correlations in manpower use and cost wages and employee benefits. In addition, turnover and labor and/or industrial disputes and union power have positive correlation with information technology and technology management. Although those achievements have positive correlation, their performances are laggard to pattern 1 countries. Consequently, these results were evidenced from their national competitiveness of IMD and WEF. Furthermore, the detailed items of each sub-category in surveyed data can represent the strong and weak point of TD and HR in their countries.
After examining the characteristics of TD patterns, we further employ strategic grid to compare the four types of countries with the results of relationships. Singapore and Malaysia belong to fitting type and Pattern 1 countries, which have highly relationship between TD and HR. Thailand, belong to retuning type and Pattern 2 countries, which need to improve their employee benefits and basic infrastructure. Brunei, belong to inadequate type and Pattern 2 countries, which have unbalance resources utilization between TD and HR. The rest of SEA countries belong to ignoring type and Pattern 2 countries, which have weak relationship between TD and HR. In fact, Pattern 2 countries also have worse performance of TD in the past. Furthermore, we inspect the importance of each sub-category for HR; Pattern 2 countries try to pay more attention to focusing on manpower use in order to solve their labor force problem. On the contrary, other sub-categories seem to lose focusing by their inadequate HR policy. From the achievement of sub-categories of TD, Pattern 1 countries almost have superior performance to Pattern 2 countries. But, how to utilize the HR are the complex issues both for Pattern 1 and Pattern 2 countries. They may have different problems in their growth stage of TD life cycle if the HR policies have invalid used. Thus, in this empirical study, we give a brief account of the interrelationship between TD and HR for SEA countries. These results not only show the characteristics of pattern countries, but provide the clues for decision makers to reshape their HR policies.
Although this paper focuses on the experiences of SEA countries in leveraging its technology and HR, it is important to note that the lessons learned are broadly applicable to both LDC and DC. The insights gained from this study are useful to both researchers and practitioners to better understand the need for complementary national resources in leveraging technology effectively. Such insights may also provide important avenues for future research in terms of determining appropriate technology and HR strategies for enhancing technology with complementary resources.
Finally, we also suffer from lack of official data in some less-developed countries. Thus, the sub-category of R&D and patents and copyrights are not discussed in this study. However, we present a visible framework to analyze the TD and HR in whole SEA countries and to depict the variations existed in different countries. Also, an evidence of distinct TD which depends on better HR exploitation is discovered. In future studies, researchers can discuss the determinants of economic performance, HRM, and management capabilities with TD. SEA countries have faced a big challenge to organize and maintain their relationships balanced between competition and cooperation as the much larger, rapidly growing regional economies of China and India continue to rise.
6. Acknowledgements
This research was partially supported by National Science Council, Taiwan, under Grant NSC 90-2416-H- 006-041, NSC91-2416-H-006-027, and NSC92-2416-H- 006-001. The authors wish to express their special thanks to Dr. Chiang Kao, organizer of this project, and other team members from 10 countries in Southeast Asia.
REFERENCES
- F. W. Swierczek and P. K. Shrestha, “Information Technology and Productivity: A Comparison of Japanese and Asia-Pacific Banks,” Journal of High Technology Management Research, Vol. 14, No. 2, 2003, pp. 269-288. HUdoi:10.1016/S1047-8310(03)00025-7U
- Y. Yuthavong, “The Future of Science and Technology in Southeast Asia,” International Journal of Technology Management, Vol. 22, No. 5, 2001, pp. 617-627. HUdoi:10.1504/IJTM.2001.002981U
- Konstadakopulos and Dimitrios, “The Challenge of Technological Development for ASEAN: Intraregional and International Co-Operation,” ASEAN Economic Bulletin, Vol. 19, No. 1, 2002, p. 100. HUdoi:10.1355/AE19-1GU
- A. S. Bharadwaj, “A Resource-Based Perspective on Information Technology Capability and Firm Performance: An Empirical Investigation,” MIS Quarterly, Vol. 24, No. 1, 2000, pp.169-196. HUdoi:10.2307/3250983U
- V. Sambamurthy, A. Bharadwaj and V. Grover, “Shaping Agility through Digital Options: Reconceptualizing the Role of Information Technology in Contemporary Firms,” MIS Quarterly, Vol. 27, No. 2, 2003, pp. 237-264.
- R. C. Wicklein, “Designing for Appropriate Technology in Developing Countries,” Technology in Society, Vol. 20, No. 3, 1998, pp. 371-375. HUdoi:10.1016/S0160-791X(98)00022-0U
- D. Ulrich, “Human Resource Champions,” Harvard Business School Press, Boston, 1997.
- E. H. Burack, M. D. Burack, D. M. Miller and K. Morgan, “New Paradigm Approaches in Strategic Management,” Group and Organization Management, Vol. 19, No. 2, 1994, pp. 141-159. HUdoi:10.1177/1059601194192002U
- K. Carrig, “Reshaping Human Resources for the Next Century-Lessons from a High Flying Airline,” Human Resources Management, Vol. 36, No. 2, 1997, pp. 277-289. HUdoi:10.1002/(SICI)1099-050X(199722)36:2<277::AID-HRM8>3.0.CO;2-UU
- W. T. Chee, “Workforce Productivity Enhancement and Technological Upgrading in Singapore,” ASEAN Economic Bulletin, Vol. 14, No. 1, 1997, pp. 46-56. HUdoi:10.1355/AE14-1DU
- A. Clark, “Returns to Human Capital Investment in a Transition Economy—The Case of Russia, 1994-1998,” International Journal of Manpower, Vol. 24, No. 1, 2003, pp. 11-30. HUdoi:10.1108/01437720310464945U
- H. Heijke, C. Meng and G. Ramaekers, “An Investigation into the Role of Human Capital Competences and Their Pay-Off,” International Journal of Manpower, Vol. 24, No. 7, 2003, pp. 750-773.
- V. Y. Haines and A. Petit, “Conditions for Successful Human Resources Information Systems,” Human Resource Management, Vol. 36, No. 2, 1997, pp. 261-275. HUdoi:10.1002/(SICI)1099-050X(199722)36:2<261::AID-HRM7>3.0.CO;2-VU
- E. N. Wolff, “Technology and the Demand for Skills,” STI Review, No. 18, 1996, pp. 95-123.
- J. DiNardo and J. S. Pischke, “The Returns to Computer Use Revisited: Have Pencils Changed the Wage Structure Too?” Quarter Journal of Economics, Vol. 112, No. 1, 1997, pp. 291-303. HUdoi:10.1162/003355397555190U
- D. H. Autor, L. F. Katz and A. B. Krueger, “Computing Inequality: Have Computers Changed the Labour Market?” Quarterly Journal of Economics, Vol. 113, No. 4, 1998, pp. 1169-1213. HUdoi:10.1162/003355398555874U
- E. Berman, J. Bound and S. Machin, “Implications of Skill-Based Technological Change: International Evidence,” Quarterly Journal of Economics, Vol. 113, No. 4, 1998, pp. 1245-1279. HUdoi:10.1162/003355398555892U
- S. Machin, “Technology and Changes in Skill Structure: Evidence from Seven OECD Countries,” Quarterly Journal of Economics, Vol. 113, No. 4, 1998, pp. 1215-1244. HUdoi:10.1162/003355398555883U
- G. H. Hwang, “Information and Communication Technologies and Changes in Skills,” International Journal of Manpower, Vol. 24, No. 1, 2003, pp. 60-82. HUdoi:10.1108/01437720310464972U
- J. J. Chanaron, “Technological Management: A Tentative Research Agenda,” International Journal of Technology Management, Vol. 23, No. 6, 2002, pp. 618-629. HUdoi:10.1504/IJTM.2002.003029U
- C. W. Hsu and H. C. Chiang, “The Government Strategy for the Upgrading of Industrial Technology in Taiwan,” Technovation, Vol. 21, No. 2, 2001, pp. 123-132. HUdoi:10.1016/S0166-4972(00)00029-8U
- W. J. Keegan, “Global Marketing Management,” Prentice-Hall International, Inc., Upper Saddle River, 2002.
- K. S. Jomo, “Reforming East Asia for Sustainable Development,” Asia Business & Management, Vol. 2, No. 1, 2003, pp. 7-38. HUdoi:10.1057/palgrave.abm.9200026U
- K. S. Jomo and G. Felker, “Technology, Competitiveness and the State: Malaysia’s Industrial Technology Policies,” Routledge, London, 1999.
- R. Rasiah, “Pre-Crisis Economic Weakness and Vulnerabilities,” In: K. S. Jomo, Ed., Malaysian Eclipse: Economic Crisis and Recovery, Zed Books, London, 2001.
- T. Y. Wang, S. C. Chien and Yin Soe, “National Competitiveness of Myanmar—A View from Resource-Based Strategies,” Asia Pacific Management Review, Vol. 9, No. 20, 2004, pp. 263-283.
- T. Y. Wang, H. Y. Lee, E. A. Zamora, S. D. Talisayon, V. T. Supangco, B. P. B. Gutierrez and E. E. Patalinghug, “A Research Framework for Evaluating the Competitiveness of Developing Countries: An Example of the Philippines,” Asia Pacific Management Review, Vol. 9, No. 20, 2004, pp. 301-321.
- C. Lin, H. S. Hsieh, N. Yuok, C. Savary and V. Sum, “Evaluating the Competitiveness of Least-Developed Countries—The example of Cambodia,” Asia Pacific Management Review, Vol. 9, No. 20, 2004, pp. 205-227.
- C. Lin, H. J. Tseng and S. Chirathivat, “An Evaluation on National Competitiveness of Thailand after Financial Crisis,” Asia Pacific Management Review, Vol. 9, No. 20, 2004, pp. 335-352.
- T. N. Garavan, “Strategic Human Resource Development,” International Journal of Manpower, Vol. 12, No. 6, 1991, pp. 21-34. HUdoi:10.1108/EUM0000000000889U
- B. Campell and E. Yeo, “Perceptions of Appropriate Leadership Style: Participation versus Consultation across Two Cultures,” Asia Pacific Journal of Management, Vol. 10, No. 1, 1994, pp. 1-19. HUdoi:10.1007/BF01732221U
- M. E. Berman, P. J. West and X. Wang, “Using Performance Measurement in Human Resource Management,” Review of Public Personnel Administration, Vol. 19, No. 2, 1999, pp. 5-31. HUdoi:10.1177/0734371X9901900202U
- R. Othman and C. Teh, “On Developing the Unformatted Work Place: HRM Issues in Malaysia,” Human Resource Management Review, Vol. 13, No. 3, 2003, pp. 393-406. HUdoi:10.1016/S1053-4822(03)00042-1U
- Association of Southeast Asian Nations, “Energy Security and High Oil Prices: Impact on Economic Growth of ASEAN Countries,” ASEAN Energy Business Forum, Siam Reap, 2005.