Technology and Investment
Vol.2 No.3(2011), Article ID:6978,8 pages DOI:10.4236/ti.2011.23017
Effects of Indigenous Innovation Policy on the S & T Outputs in China Evidence from the Higher Education System
Department of Public Management, Xiamen University, Xiamen, China
E-mail: lynn_xm@hotmail.com
Received April 26, 2011; revised May 27, 2011; accepted June 6, 2011
Keywords: Indigenous Innovation Policy, S & T Outputs, the Higher Education System
Abstract
This paper evaluated the effects of indigenous innovation policies changes in 1996 and 2002 on the S & T outputs in the Chinese higher education system. I used interrupted time series design with yearly measures of number of SCI articles, average citation per item in 5 years, number of invention patent application accepted and invention patent granted from 1980 to 2008. The results showed statistically significant increases in the four output measures after the 1996 and 2002 innovation policies were adopted by the Chinese universities. In terms of effect size, the increases were 133% and 82% in number of SCI articles and 41% and 37% in citation impact for the two policy changes. The effect sizes are more noteworthy with 177% and 202% increases in patent applied 146% and 256% increase in patent granted for the two policy changes. The results supported all hypotheses and are basically consisted with prior research done by other scholars. However, small size sample and no control group are the two limitations of this research and future research could consider about the possibility to combine time series data and cross-sector data.
1. Introduction
After the adoption of open door policy, China experienced steadily growing S & T competition with other countries in the development of international economic and trade intercourse. In reaction to this competition, Chinese government endeavored to reform its S & T system and developed a complicated national innovation system. In this process, different innovation actors made specific policies to ensure the development of indigenous innovation. The higher education system also involved or being involved into this system and took efforts to mobilize university faculties to contribute to S & T innovation in China through certain policies. Along with these efforts, millions and billions of R & D funds was input into the higher education system, which raised the question of policy effect on S & T outputs. What is the performance of the innovation policy in the higher education system in terms of S & T outputs? Have the universities’ scientists and technicians stimulated by the policies and produced more and better?
The indigenous innovation policy to foster S & T research activities in universities experienced obvious shifts along with the S & T development strategy of the nation. There were relatively 3 logically related stages of the indigenous innovation policy in the higher education system: stage of passive involvement in 1996 in responding to enterprise-centered innovation strategy, stage of emphasizing roles of prestigious universities in 2002 in responding to national innovation strategy, and stage of promoting development of local universities and colleges in 2006 in responding to regional innovation strategy.
The first stage was marked by the policy documents for carrying out the strategic plan of revitalizing the nation through science and education. This strategic plan, named Decision of Promoting S & T Development, was developed by the Central Committee of Chinese Communist Party and the State Council in 1995. It highlighted the importance of basic research and advocated the cooperation among universities, public research institutions and enterprises. To carry out the strategic plan, the State Economic and Trade Commission issued its suggestions for promoting enterprise-centered technological innovation in August 1996. Along with the suggestions, there was a technological innovation project plan in which the importance of cooperation among enterprises, public research institutions and universities was restated. It also outlined detailed implementation steps for facilitating the cooperation among these three entities. In 1996, the focus of technological innovation project was to select 100 enterprises and guarantee their cooperation with public research institutions and universities. This number was expected to expand to 1000 in 1997 and 1998. In this context, the Chinese higher education system is getting more and more involved in the indigenous innovation movement and become more and more interested in research with a practical use.
The second stage is symbolized by two policy documents. One of them is the suggestions for further promoting the capability of endogenous innovation put forward by the Ministry of Science and Technology (MOST), the Ministry of Education (MOE), Chinese Academy of Sciences, Chinese Academy of Engineering and the National Nature Science Foundation on June 11, 2002. In this document, the importance of endogenous innovation in the natural science field is strengthened by suggestions for reforming S & T management system and evaluation system, training and recruiting innovative talents, paying attention to the development of key S & T bases and so on. The other one, issued half month later by the MOST and the MOE, was actually the extension of the first one. It proposed some recommendations for putting into full use of the higher education system in S & T innovation. In order to promote the innovative capability in the higher education system, it specially concerned the development of prestigious universities in advance by suggesting reorganization of national key laboratories, establishment of innovative bases and national large-scale scientific equipment centers in selected universities.
In 2006, the Medium and Long Term S & T Strategic Plan was adopted by the nation. At the same time, the idea that regional innovation system must be developed to compliment the development of national innovation system permeated into the S & T innovation policy. As a result, the higher education system shifted its attention from the innovative capability of the prestigious universities to all universities especially the local universities by making a new policy on April 26, 2006, titled as “Recommendations on Further Promoting Local Universities and Colleges’ S & T Innovation”, to promote the performance of local universities in S & T innovation.
How did the innovation policy affect S & T outputs? This paper tries to provide some observation on this. In the second section, hypotheses will be presented based on literature review. Then, it goes to the methodologies it employed to collect and analyze data in Section 3. The results of single variable description and multivariable regression follow immediately in Section 4. At the final part, I will conclude my finding and discuss the results.
2. Literature Review and Hypotheses
Although these are very important questions both in innovation and policy arena, there are few literatures provide answers to them. Most literatures of innovation policy focus on the improvement of the innovation policy using ideas or concepts derived from the process of innovation theory evolvement [1-3], special countries’ or regions’ practice [4-6] or particular failures of the innovation policy/practice [7]. Only small fraction of contributions addressed the effects of innovation policy on three distinct topics. The first topic is S & T policies’ influence on economic development. On this topic, some scholars [8,9] straightly discussed the relationship between innovation policy and economic development, others [10-12] substituted the policy with R & D expenditures and addressed the relationship between expenditures and economic development. Whatever the choice of them, they generally concluded with positive results. The second topic is the relationship between government innovation policy and firms behavior. Some contributors [13,14] presented empirical evidence of the firms’ reactions to government innovation policies or intervention and revealed some important factors that affect firms’ reactions to government innovation policy. Others, such as Jennifer L. Woolley and Renee M. Rottener [15], found that innovation policy could strongly support the formation of new firms. The third topic concerns measurement of the observed changes in S & T input/output or the relationship between S & T input and output after innovation policies were adopted. Ali Uzun [16] measured the performance of Turkey’s S & T policy by describing its changes in R & D expenditures and scientific output (number of SCI papers) during 1983 to 2003. Several Chinese articles addressed the relationship between S & T input and output in the context of innovation policy. What they concerned most is the relationship in or among provincial governments [17,18] or at the national level [19,20] in selected year or years. Although different measures or statistical methods were employed, they generally conclude with positive results. Literature specifically discussed the effects of innovation policy in the universities was very scarce. Until now, only Yuqing Li, Baoying Qian, Suyan Tian and Heng Zhao [21] conducted a research on the relationship between S & T input and output of 10 universities using data from 1995 to 2002. Their findings revealed mismatch between input and output. Statistically significant correlation existed between S & T research projects and articles, SCI articles (negative relation) and authenticated achievement, between S & T expenditures and articles, SCI articles and patent application accepted. The number of R & D full-time personnel could not exert significant influence on S & T output.
Obviously, the third policy impact topic is immediately related to this research especially those discussed the relationship between input and output in Chinese. However, these articles generally relied on cross-sectional data or relatively very limited time series data which could not cover the innovation policy changes. In addition, the observation of Yuqing Li, Baoying Qian, Suyan Tian and Heng Zhao was too coverage-limited with only 10 universities to reflect the real influence of the innovation policies on the whole higher education system. In one word, there is an urgent need for research on innovation policy and the S & T output in universities in China. This paper endeavors to analyze their relationship using data from 1980 to 2008. The primary research question in this study is as follows: what impact, if any, does the presence of indigenous innovation policy have on the S & T output in the higher education system? To address this overarching research question, the following primary hypothesis was formulated:
H: The presence of indigenous innovation policy tends to increase the S & T output in the higher education system.
Under this primary hypothesis, secondary hypotheses need to be formulated based on the definition of S & T outputs. Most scholars [22-27] agreed the number of publication and citation are proper scientific output measures, and they normally deriving these data from SCI database. As to the appropriate proxy indicator of technological output, they preferred the number of patents although some authors [28] criticized the use of this variable. Although Chinese scholars relatively defined S & T output more general, there were several Chinese scholars [29-32] did agree with their international colleagues. Thus, the proxy indicators for S & T output in this research are SCI articles for measurement of scientific output and invention patents for measurement of technological output. Both of them can be gauged in terms of their quantity and quality. Number of SCI articles measures its quantity and average citation per item in five continuous years gauges its quality. For invention patents, number of invention patent application accepted shows its quantity and invention patent granted reflects its quality.
Therefore, the following four secondary hypotheses were developed:
• H1: The presence of indigenous innovation policy tends to increase the number of SCI articles.
• H2: The presence of indigenous innovation policy tends to increase the average citation per item of SCI articles
• H3: The presence of indigenous innovation policy tends to increase the number of invention patent application accepted.
• H4: The presence of indigenous innovation policy tends to increase the number of invention patent granted.
Although all the three policy changes could affect the S & T outputs, this research will only study 1996 and 2002 policy changes. The reason lies in the fact that S & T innovation policy can not exert effects on the output immediately and the international accepted approach to deal with the time lag problem in S & T activities and output [33] is to employ a two-year lag of influence.
3. Methodology and Data
3.1. Measures and Data Collection
The dependent variables are above-mentioned four S & T outputs. The central data source exploited for invention patents is the Yearbook of Chinese Science and Technology Statistics. Prior to 1985, the invention patents data in the Yearbook were divided into domestic and foreign, official and non-official. Since 1985, it further differentiated these patents by the types of applicators/ inventors’ affiliations under the items of domestic and official patents. These organization types include universities and colleges, research institutions, industrial and mineral enterprises, and government agencies and organizations. The data used in this research is extracted from the item of “universities and colleges”. Therefore, the two variables of invention patents data start from 1985 and ended in 2008.
The data of SCI articles is extracted from the Science Citation Index Expanded (SCI-E) of ISI Web of Science. The parameters used to screen the articles were “university” and “Peoples R China” in “Address” and “article” in “Document type”. The time span is from 1980 to 2008. After the articles were selected for each year, the Web of Science can generate a citation report automatically. Using this citation report, average citation per item in the first five years was calculated by adding the citation counts from the year the articles were indexed to four years later and then divided by the number of articles. Therefore, the time span of the number of SCI articles is from 1980 to 2008, while the citation of SCI covers 1980 to 2005.
The independent variables are those which can gauge the two innovation policy changes. For each policy change, three independent variables are employed. A counter variable is employed that is coded one for the first year of the analysis, two for the second year, and three for the third year and so forth. This counter variable is called TIME. Theoretically, the two policy changes can share one TIME variable. However, this research created two TIME variables (TIME80 for invention patents and TIME85 for SCI articles) because of the data availability. The second independent variable, which aims to measure the short term effect, is dichotomous in nature and is coded zero for observations before the policy intervention began to take effect and one for those thereafter. This variable is called POLICY. For 1996 policy change, the years before 1998 are coded as zero and one for 1998 and thereafter (POLICY96). For 2002 policy change, the turning point is 2004, zero for the year before 2004, and one for 2004 and after (POLICY02). The remaining independent variable which tries to catch the long term effect is a post-intervention counter that is also coded in the following manner: coded as zero for observations prior to the policy intervention and one for first year after the intervention, two for the next year, three for the next year, and so on. This variable is called AFTER. The 1996 policy change has a variable AFTER96 with year 1998 starts coded as one and the 2002 policy change has a variable AFTER02 with year 2004 starts coded as one.
3.2. Statistical Analysis
The interrupted time-series analysis was employed in this research. The interruption is the 1996 and 2002 policy changes. To estimate the effects of the two policy changes, the independent policy indicators need to be extracted into a policy factor through principal component analysis process. However, because of the data of invention patents and SCI articles have different time span, the principle component analysis were carried out twice and each with 5 independent variables. A Policy Factor 80 was extracted for SCI articles and a Policy Factor 85 for invention patents. Then, the two SCI articles indicators were regressed on the Policy Factor 80 and the invention patents indicators were regressed on the Policy Factor 85.
Extraction of Policy Factor 80. The KMO value of the five independent variables for SCI articles (TIME80, POLICY96, POLICY02, AFTER96 and AFTER02) is 0.777 and the approx Chi-Square value is 163.567 (df = 10, p = 0.000), which means they are suitable for factor analysis. The principal component analysis extracted only one policy component of which the initial eigenvalue is 4.007. With the selected factor, its total contribution rate had reached 80.149 per cent. According to the coefficient matrix for calculating the factors’ scores based on regression calculation, the coefficients for the five independent variables are as follow: POLICY96 (.210), POLICY02 (.224), TIME80 (.219), AFTER96 (.245) and AFTER02 (.217).
Extraction of Policy Factor 85. The KMO value of the five variables for invention patents (TIME85, POLICY96, POLICY02, AFTER96 and AFTER02) is 0.792 and the value of approx Chi-Square is 136.407 (df = 10, p = 0.000), and one policy component is extracted (its initial eigenvalue is 4.049 and total contribution rate is 80.973 per cent). According to the coefficient matrix, the coefficients for the five independent variables are: POLICY96 (.204), POLICY02 (.221), TIME80 (.226), AFTER96 (.243) and AFTER02 (.215).
All the regression models were estimated by SPSS 16.0. When the problem of serial correlation aroused, the transformation or alternation of the models was needed. In this research, three models were changed into polynomial regression models to avoid such problem. All the final models fit the data well and explained substantial proportions of the variance in the S & T outputs over time. Every model had R2 of over 0.90 (adjusted R2 was lower but still over 0.90) and all of them were statistically significant at the level of 0.000. Finally, parameter estimates in terms of changes in the four output indicators were transformed into four standardized metrics of effect: percentage change in the output immediately prior to a given innovation policy change plus two year lags, namely percentage change between 1997 and 1998 and between 2003 and 2004.
4. Results
4.1. Single Variable Description
The mean of number of SCI articles is 18196.55 with a standard deviation of 24131.188, the mean of average citation per item is 3.7242 with a standard deviation of 1.79512. For the invention patent applied and granted, their means are separately 5081.88 and 1670.25 with standard deviations of 1681.915 and 573.759.
Figure 1 plots the four S & T output indicators’ Z score
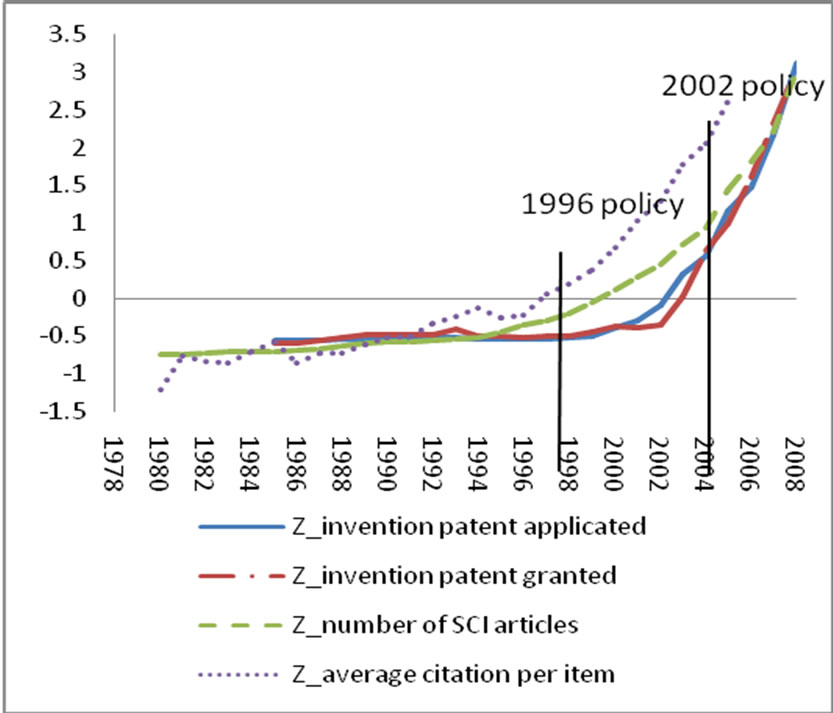
Figure 1. Z scores of the S & T output indicators.
changes. It shows that the invention patent indicators were very stationary with almost unobservable minor changes before 1998. Between 1998 and 2004, the indicator of application accepted was gradually growing while the patent granted number stayed at a lower development speed for 4 years and suddenly climbed up sharply. After 2004, both patent indicators demonstrated a rapid increase. Relatively, the SCI article indicators showed bigger fluctuations before the policies were adopted. After 1998, the development paces of both indicators were obviously faster than before. The speed shown in the number of SCI articles was even higher than citation impact indicator after 2004. Generally, based on the observation of the changes of S & T output indicators’ Z scores, the introduction of innovation policies into the higher education system in China resulted in apparent increases in both scientific and technological outputs.
4.2. Multi-regression Analysis Results
Results show statistically significant increases in the quantity and quality of the S & T outputs in the higher education system after the 1996 and 2002 innovation policy were adopted. In addition, the effect sizes of the two policy changes were apparently significant.
Number of SCI articles. Estimated increases in this output are of clear substantive importance: the 1996 policy change was followed by 133% change in the number of SCI articles, and the 2002 policy change was followed by 82% change in the quantity of SCI articles (See Table 1). These results indicated that the 1996 policy change had higher (51%) effects on this output than the 2002 policy change did. According to the regression model, the number of SCI articles annual increase fitted well in a second degree curve. In the first year after the innovation policies exerted influence, the number of SCI articles increased about 23,000 items. In the second year, there were about 40,000 items added to the total counts. The speed of annual increase was getting even faster because of square of the parameter of policy factor 80’ presence in the model.
Average citation per item. Citation impact indicator of SCI articles also demonstrated obvious effects of the policy changes, although the effects of related policy were not as big as in the prior indicator. As illustrated in Table 2, the 1996 policy change was followed by 41% changes in the citation impact, and the 2002 policy arrangement brought 37% changes to the quality indicator of the SCI articles. Similar to the situation of the other SCI article indicator, the 1996 policy change exerted more influence than the 2002 policy change did on this output indicator, even though this difference was not so apparent (0.03%). Table 2 showed that annual increase of citation per item was as high as 2.558 times after the policy were adopted and it is statistically significant.
Invention patent application accepted. The estimate percentage changes in this output were clearly larger than those in the SCI articles. The percentage change between 1997 and 1998 was 177% and it even climbed up to 200% between 2003 and 2004 (Table 3). Meanwhile, the percentage change comparison indicated different result from the prior two indicators. This indicator received more effects from the policy change of 2002 than from the 1996 policy change. The parameters in Table 3 indicated that more than 6000 pieces of application increase in this output at the first year after policy effects exerted. From the second year and on, the annual increase was getting faster at the speed of a second degree polynomial increase. For the second year, the increase in this indicator was about 13,000 pieces. This number steeply climbed up to about 20,000 in the third year.

Table 1. Multi-regression model for No. of SCI articles with policy factor 80.
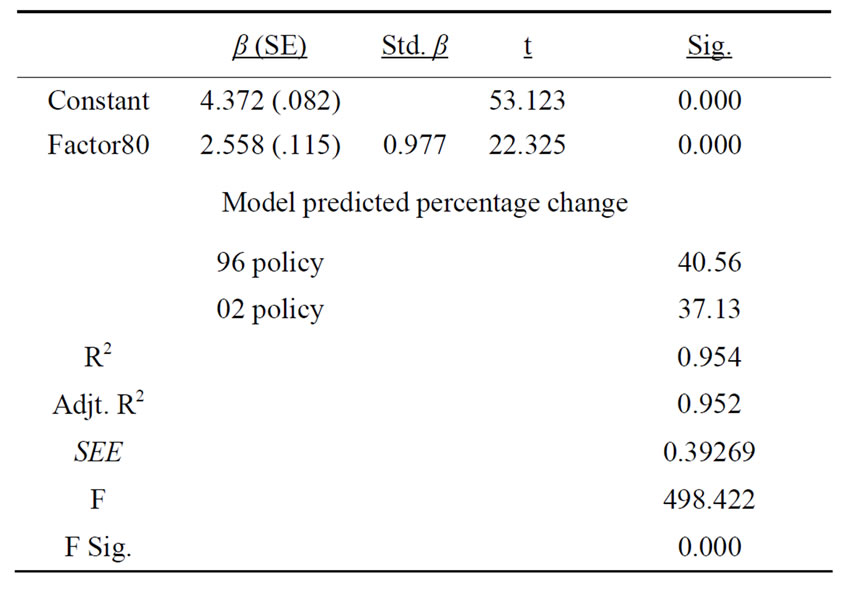
Table 2. Multi-regression Model for Average Citation per Item with Policy Factor 80.
Invention patent granted. Similar to the quantity indicator of invention patent, the percentage change in this output was obviously bigger than those in the SCI article indicators. The 1996 policy was followed by 146% changes in patent granted. The percentage changes followed by 2002 policy change were even soaring up to 257%. Table 4 illustrated a higher effect size of 2002 policy than 1996 policy in terms of the percentage change of the patent granted after the policy changed. The model in Table 4 implied that more than 2000 pieces of application increase in this output at the first year after policy effects exerted. From the second year and on, the annual increase was getting higher at the speed of a second degree polynomial increase.
5. Conclusions and Discussion
This research found significant effects of the innovation

Table 3. Multi-regression model for No. of invention patent application accepted with policy factor 85.

Table 4. Multi-regression Model for Invention Patent Granted with Policy Factor 85.
policies on the S & T output in the higher education system in China. All the four models’ goodness of fit is excellent with each of the models explained more than 90% of the variance in the S & T outputs over time. These findings indicate that the innovation policy apparently increased the S & T outputs (SCI articles and invention patents). Hence, all the previously formulated hypotheses are supported by my research. The results are also consistent with some previous researches [34], in terms of the SCI articles and invention patents. However, my findings can only partially support the observation of Yuqing Li, Baoying Qian, Suyan Tian and Heng Zhao [35]. According to their research, negative relationship existed between research projects and the number of SCI articles in higher education system, while my research found very significant positive relationship between the policies and quantity of SCI articles.
Some questions might be raised about the speed reduction of percentage change in the number of SCI articles between 1996 and 2002 policy changes. As Figure 1 illustrated, number of SCI articles and their citation impact started to increase right before the adoption of innovation policy. This fact reminded us the necessity to consider about other factors that might affect this S & T output in the universities, such as the criteria used for academic promotion and doctoral student graduation. In 1992, Nanjing University regulated that SCI articles be main indicator used for its faculty members’ promotion in academic ranks and doctoral students’ graduation [36]. Peking University and Tsinghua University reacted immediately by copying this innovation onto their faculties and doctoral students. Afterwards, SCI articles became a heavy burden for those who wanted to get promotion in academic ranks or doctorate degrees in most Chinese universities. Bearing this information in mind, I think the personnel regulation in Chinese universities is another important factor in deciding the effect size in the number of SCI articles besides of the innovation policy.
The significant increase of invention patents and the different influence between the two policy changes on these indicators can be easily explained by the innovation policies. In universities, there was no arrangement to attract their faculties’ attention on patents before the policies. The 1996 policy released university faculties’ innovation capability through the arrangement of encouraging cooperation between enterprises, universities and public research institutions. Further more, the 2002 policy specifically encouraged university faculties to apply for patents and made arrangements for rewarding inventors and protecting intelligent properties. Apparently, these policy arrangements were proved effective by the percentage changes in these invention patent indicators.
Another question that could be raised is the lowest effect size of citation impact compared with other output indicators. The reasonable explanation is that this indicator can not be pushed into a “catch-up-movement” by the current policy arrangement. Moreover, there is a trade-off between the quantity and quality of SCI articles. Such situation indicated that some modification of the innovation policies needs to be made to guarantee increase of this indicator. The core point of policy modification is to help universities shift their attention to the quality of SCI articles as mentioned in the 2002 innovation policy documents. To hit this target, the policy makers need to guide the universities to reward the authors of SCI articles according to the citation impact of their articles. Generally, the Chinese universities pay attention to and reward the authors by the number of their SCI articles. The feasible way to attract them to citation impact is to adjust the measures used for evaluating universities. In China, the universities get financial support from the Central Government based on such evaluation. The current measures highlight the quantity of SCI articles, which definitely promote the SCI articles’ increase in quantity but can not guide the universities to pay attention to the citation impact. To improve the effect size of the policy on this indicator, the current measures must be tailored to strengthen the importance of citation impact of SCI articles.
This research has two limitations. First of all, I have not used a control group in this research because it is impossible to find an appropriate control group for this research. This is one of the problems Chester L. Britt, Gary Kleck, and David J. Bordua [37] found in interrupted time series design articles. Without appropriate control group which is not exposed to the intervention, it will be difficult to rule out competing hypothesis or noises made by factors other than the intervention discussed. The second limitation is related to the small size of the samples. The case number of every indicator was below 30 either because of the data availability (patents) or because of the concern that big difference before and after 1980 might twist the information of SCI articles and misled this research. Such small sample size may also guide this research to inappropriate conclusion. Thus, future studies need to consider about the possibility to combine time series data with cross-sector data (such as comparing results between Chinese universities and Indian universities). Meanwhile, further studies need to be carried out as the years pass and more post-policy data become available.
Given these limitations presented in this research, however, they could not overthrow the results. The reasons for this are twofold. First, the effect sizes in the four outputs were very big. The net impact of the policy may be lowered down after other factors were ruled out. However, when we consider about the positive results found in other scholars’ research in terms of the relationship between S & T input and output, the direction of the effects in this research would very likely keep positive. Second, each one of the four output indicators in this research showed very significant changes after the policy were adopted, which could be a strong evidence to manifest the hypothesis that the policy led to increase in the S & T outputs.
6. Acknowledgements
I would like to thank Prof. Wenxuan Yu at Nanyang Technological University, Singapore for his help in my data collecting. I am also very grateful for the thoughtful comments from anonymous referrers.
7. References
[1] R. K. Woolthuisa, M. Lankhuizenb and V. Gilsing, “A System Failure Framework for Innovation Policy Design,” Technovation, Vol. 33, No. 5, 2005, pp. 609-619.
[2] T. D. Tsoutsos and Y. A. Stamboulis, “The Sustainable Diffusion of Renewable Energy Technologies as an Example of an Innovation-Focused Policy,” Technovation, Vol. 25, No. 5, 2005, pp. 753-761.
[3] A. Rosiello and L. Orsenig, “A Critical Assessment of Regional Innovation Policy in Pharmaceutical Biotechnology,” European Planning Studies, Vol. 16, No. 3, 2008, pp. 337-357. doi:10.1080/09654310801920599
[4] Henk J. Van Zuylen and K. Matthias Weber, “Strategies for European Innovation Policy in the Transport Field,” Technological Forecasting & Social Change, Vol. 69, No. 9, 2002, pp. 929-951. doi:10.1016/S0040-1625(02)00191-9
[5] H. Godoe and S. Nygaard, “System Failure, Innovation Policy and Patents: Fuel Cells and Related Hydrogen Technology in Norway 1990-2002,” Energy Policy, Vol. 34, No. 13, 2006, pp. 1697-1708. doi:10.1016/j.enpol.2004.12.016
[6] G. Avnimelech, “A Five-phase Entrepreneurial Oriented Innovation and Technology Policy Profile: The Israeli Experience,” European Planning Studies, Vol. 16, No. 1, 2008, pp. 81-98. doi:10.1080/09654310701747985
[7] C. Tamásy, “Rethinking Technology-Oriented Business Incubators: Developing a Robust Policy Instrument for Entrepreneurship, Innovation, and Regional Development?” Growth and Change, Vol. 38, No. 3, 2007, pp. 460-473. doi:10.1111/j.1468-2257.2007.00379.x
[8] Q. W. Lu, “China’s Leap into the Information Age: Innovation and Organization in the Computer Industry,” Oxford University Press, Oxford, 2000.
[9] W. Lazonick, “Indigenous Innovation and Economic Development: Lessons from China’s Leap into the Information Age,” Industry and Innovation, Vol. 11, No. 4, 2004, pp. 273-297. doi:10.1080/1366271042000289360
[10] E. Mansfield, “Contribution of R & D to Economic Growth in the United States,” Science, Vol. 175, No. 4021, 1972, pp. 477-486. doi:10.1126/science.175.4021.477
[11] Z. Griliches, “The Search for R & D Spillovers,” Scandinavian Journal of Economics, Vol. 94, Supplement, 1992, pp. S29-S47. doi:10.2307/3440244
[12] J. Mairesse and P. Mohnen, “Accounting for Innovation and Measuring Innovativeness: An Illustrative Framework and an Application,” American Economic Review, Vol. 92, No. 2, 2002, pp. 226-230. doi:10.1257/000282802320189302
[13] X. L. Huang, B. Schroder and P. Steffens, “The Chinese Steel Industry in Transition: Industry Perspective on Innovation Policy,” R & D Management, Vol. 11, No. 4, 1999, pp. 17-25. doi:10.1111/1467-9310.00113
[14] E. Barbieri, M. R. Di Tommaso and M. L. Huang, “Industrial Development Policy and Innovation in Southern China: Government Targets and Firms’ Behavior,” European Planning Studies, Vol. 11, No. 2, 2010, pp. 83-105. doi:10.1080/09654310903343542
[15] J. L. Woolley and R. M. Rottener, “Innovation Policy and Nanotechnology Entrepreneurship,” Entrepreneurship Theory and Practice, Vol. 32, No. 5, 2008, pp. 791-811. doi:10.1111/j.1540-6520.2008.00256.x
[16] A. Uzun, “Science and Technology Policy in Turkey: National Strategies for Innovation and Change during the 1983-2003 Period and Beyond,” Scientometrics, Vol. 66, No. 3, 2006, pp. 551-559. doi:10.1007/s11192-006-0040-1
[17] Q. Z. Yan and W. Y. Miao, “A Study on the Correlation between Scientific Input and Output in Henan Province,” Henan Social Sciences, Vol. 15, No. 2, 2006, pp. 147-150.
[18] T. L. Lan, Z. J. Yang, Z. H. Luo, “Gray Correlation Analysis on the Scientific Input and Output in Guangzi,” Journal of Beijing University of Aeronautics and Astronautics, Vol. 21, No. 1, 2008, pp. 21-23.
[19] X. L. Geng, “Effects of Scientific Inputs on Scientific Outputs from 1995 to 2007 in China,” Science and Technology Management Research, Vol. 29, No. 5, 2009, pp. 171-172.
[20] F. Y. Dong, “Correlation between Scientific Input and Output and Prediction of It,” Technology Economics, Vol. 128, No. 17, 2009. pp. 22-26.
[21] Y. Q. Li, B. Y. Qian, S. T. Tian and H. Zhao, “Study on the Determinants of Scientific Outputs in Universities,” Journal of Nanjing Agricultural University, Vol. 5, No. 2, 2005, pp. 50-54.
[22] S. Bhattacharya and M. Meyer, “Large Firms and the Science-Technology Interface: Patents, Patent Citations, and Scientific Output of Multinational Corporations in Thin Films,” Scientometrics, Vol. 58, No. 2, 2003, pp. 265-279. doi:10.1023/A:1026284510104
[23] R. J. W. Tijssen, “Is the Commercialisation of Scientific Research Affecting the Production of Public Knowledge? Global Trends in the Output of Corporate Research Articles,” Research Policy, Vol. 33, No. 5, 2004, pp. 709-733. doi:10.1016/j.respol.2003.11.002
[24] H. Horta and F. M. Veloso, “Opening the Box: Comparing EU and US Scientific output by Scientific Field,” Technological Forecasting and Social Change, Vol. 74, No. 8, 2007, pp. 1334-1356. doi:10.1016/j.techfore.2007.02.013
[25] B. Goldfarb, “The Effect of Government Contracting on Academic Research: Does the Source of Funding Affect Scientific Output?” Research Policy, Vol. 37, no. 1, 2008, pp. 41-58. doi:10.1016/j.respol.2007.07.011
[26] D. Czarnitzki, K. Kraft and S. Thorwarth, “The Knowledge Production of ‘R’ and ‘D’,” Economics Letters, Vol. 105, No. 1, 2009, pp. 141-143. doi:10.1016/j.econlet.2009.06.020
[27] A. Borrego, M. Barrios, A. Villarroya and C. Olle, “Scientific Output and Impact of Postdoctoral Scientists: A Gender Perspective,” Scientometrics, Vol. 83, No. 1, 2010, pp. 93-101. doi:10.1007/s11192-009-0025-y
[28] Z. Griliches, “Patent Statistics as Economic Indicators: A Survey,” Journal of Economic Literature, Vol. 28, No. 4, 1990, pp. 1661-1707.
[29] H. F. Liu, Q. Q. yang, “Evaluation of China’s Scientific Outputs Based on Articles and Patents,” Scientific Management Research, Vol. 26, No. 8, 2008, pp. 48-50.
[30] N. Y. Huang and Y. S. Wu, “Comparative Study on the Scientific Output Indicators between Taiwan and Mainland China,” Studies in Science of Science, Vol. 20, No. 6, 2002, pp. 604-610.
[31] J. W. Yao, “Status Quo and Countermeasures of China’s R & D Outputs,” Scientific Management Research, Vol. 20, No. 6, 2002, pp. 21-25.
[32] T. Qin, “Study on the R & D Expenditures and Scientific Outputs in Developing Economies,” Chinese Scientific & Technological Forum, Vol. 20, No. 4, 2004, pp. 131-135.
[33] Z. G. Fu, “Why Nanjing University Consecutively Beat Other Universities in Terms of SCI Articles for Seven Years?” People’s Daily Overseas Edition, 2000, p. A9.
[34] C. L. Britt, G. Kleck and D. J. Bordua, “A Reassessment of the D. C. Gun Law: Some Cautionary Notes on the Use of Interrupted Time Series Designs for Policy Impact Assessment,” Law & Society Review, Vol. 30, No. 6, 1996, pp. 361-380.