Technology and Investment
Vol.2 No.2(2011), Article ID:5165,11 pages DOI:10.4236/ti.2011.22009
Beginning Consolidation in the Renewable Energy Industry and Bidders’ M & A-Success*
1Department of Business, Economics and Law, Chair of Corporate Finance,
Tech University Darmstadt, Darmstadt, Germany
2Sustainable Business Institute, Oestrich-Winkel, Germany
E-mail: ettenhuber@bwl.tu-darmstadt.de
Received October 16, 2010; revised February 14, 2011; accepted February 18, 2011
Keywords: Mergers and Acquisitions, Event Study, Bidder Performance, Renewable Energy Industry, Financial Crisis
Abstract
In this paper we examine stock price reactions to mergers and acquisitions in a particular industry, the renewable energy industry. We focus on acquirers and document positive abnormal returns on a sample of 337 completed M & A-transactions announced during 2000 to 2009. We show that acquirer size, market-to-book ratio and deals announced in the recent financial crisis negatively correlate with acquirer returns. Acquirers from outside the renewable industry tend to earn positive abnormal results.
1. Introduction
The renewable energy industry has seen rapid growth over the last decade. Fuelled by growing concerns about climate change and dwindling fossil fuel resources, governments have put aggressive stimulus packages in place to grow new businesses and support established players in the industry. The use of solar, wind, hydro, geothermal and tidal energy sources as well as biomass is widely regarded as a key element of future energy supply. In 2008 more power capacity was added from renewable energy sources than from conventional means in both the European Union and the United States [1].
The growth of the industry has induced a wide range of companies, new ventures and established companies alike, to enter the market. Utility companies are buying into renewable energy to decrease their carbon footprint and diversify their energy sources; big industrials are increasing their exposure to benefit from the attractive growth rates associated with the sector; innovative technologies are being picked up by rivals to increase efficiency in business models that are yet largely dependent on government stimulus. These developments have led to a strong increase in mergers and acquisitions (M & A) activity. While the five years from 2000 through 2004 saw an aggregate of 216 deals, this number was recorded in 2008 alone. Wind and solar account for the bulk of transactions, but activity in biogas and hydro has accelerated as business models mature.
In the light of this growing M & A-activity, this paper examines the wealth effects of renewable energy industry transactions. Research on the general impact of M&Atransactions has produced rich evidence on the existence of wealth effects, particularly on the generous premiums enjoyed by target firm shareholders. Andrade et al. [2] in their study of 3688 mergers find an average abnormal return to target shareholders of 16% over a three day period around the transaction announcement. Reviewing 13 and 21 M & A-studies respectively, Campa and Hernando [3] and Bruner [4] support this result and conclude that the short-term announcement return ranges between 15 and 30% depending on the observation period.
Empirical studies on acquirer returns provide more ambiguous results and have frequently been found to be zero or negative [5]. This has often been associated with biased or opportunistic behavior of the acquiring firm’s management. Roll’s hubris theory [6] suggests that managers are prone to overconfidence, leading to an overestimation of synergy potential and subsequent mispricing of transactions. Jensen [7] argues that in the presence of free cash flows and asymmetric information managers have incentives to engage in negative net present value projects rather than returning funds to shareholders. The corresponding rise in firm size is likely to be accompanied by an increase in the manager’s prestige, salary and other nonmonetary private benefits. Mitchell and Mulherin [8] provide a less gloomy rational for acquirers to engage in M&A activity. They suggest that takeover activity is driven by—and often an appropriate response to—industry-wide shocks. They argue that due to the varying nature and impact of such shocks, e.g. inventions or regulation, the prospects of firms after a transaction may vary across industries and their respective environment. If this holds true then acquirer returns should differ across industries and might well add value to acquirer shareholders.
Since then the number of industry specific studies on transaction wealth effects has increased. Cummins and Weiss [9] and Beitel et al. [10] provide evidence on the positive returns to acquirers for transactions in the financial services industry (insurance and banking, respectively). Gross und Lindstaedt [11] document positive acquirer returns for the automotive, media, telecom, financial services and pharma/chemical industries, albeit with a sample constructed from a relatively narrow and potentially upward-biased time period (Jan ’98 - Aug ’01).
The following characteristics make renewable energy a particularly interesting industry to study wealth effects: Energy is an enormous market at the beginning of a major structural change. This change is gathering speed as 1) scientists now generally agree that anthropogenic greenhouse gas emissions are very likely to be the main reason for global warming [12], 2) renewable energy business models mature and break even making them attractive for corporate investors, 3) major energy providers, industrials and car makers that have long betted on the gradual improvement of conventional technologies are now investing in renewable energy and 4) governments are aggressively driving the development of renewable energy to meet the growing energy demand, reduce supply side risks and create renewable energy hubs to support employment in their respective country. Assuming a long-term substitution of conventional energy resources and the presence of similar scale economies that have led to oligopolistic structures in many energy markets, the speed of growth could be a critical success factor in the emergence of new market leaders. If this holds true then external growth by means of acquisitions could send a positive signal on the prospects of the acquirer of being among the future winners of the industry.
A second argument for the difference of the renewable energy sector is the “green premium” frequently reported. Klassen and McLaughlin [13] find significant positive returns for strong environmental management and significant negative returns for weak environmental management as indicated by environmental performance awards and crises, respectively. Bauer et al. [14] show that a portfolio of firms with high environmental scores outperformed a portfolio of firms with low scores by 6% per annum over the period 1997-2003. Linking previous fund research to corporate finance Chan [15] analyses 372 “environmental-oriented” equity issuers consisting of ecologically and socially friendly companies as well as firms with strong corporate governance systems in the period of 1990-2007. Contrary to most cross-section studies on IPO- [16] and SEO-performance [17], Chan [15] finds statistically significant positive shortand long-term returns after controlling for size, market-tobook ratio and momentum indicators. Chan [15] suggests that these “green” companies are perceived to be less prone to corporate social crises and environmental disasters and thus command a premium to non-green firms. If returns of ecologically friendly companies are indeed perceived as being more sustainable then the acquisition of such a company could convey information on the strategy of the acquirer and the goal of its management to produce sustainable returns. This effect could be particularly valuable to diversified acquirers not yet involved in renewable energy who could “spread” the effect over non-green assets (e.g. industrials).
Another remarkable aspect of renewable energy is the presence of climate externalities. It relates to the fact that not all benefits of producing environmentally friendly energy can be captured by the shareholders and thus leads to a socially suboptimal pricing thereof. The European Commission through the ExternE Project has tried to quantify the true costs of electricity generation including the impact on human health, agriculture and ecosystems. Applying a system that charges the heavyemitters, or provides benefits to non-emitters, the cost of producing electricity from coal or oil would almost double. The results have contributed to the EU introducing a carbon emission trading system which aims at mitigating one aspect of the reported cost gap associated with conventional means of energy production. The superior returns of renewable energy could be interpreted as an increasing likelihood—with governments and many companies pushing for a structural change—that energy production will ultimately be priced closer to its “true” cost. Consolidation could produce more powerful industry players which in turn could exert more influence on policy makers to change the pricing system. Consolidation would send a positive signal on the prospects of the industry, including the acquirer.
Finally, renewable energy is a heterogeneous industry offering insights in value effects of markets at different development stages and consolidation levels. No single renewable energy source has evolved as the dominating carrier and its now generally agreed that future renewable energy supply will most likely consist of a portfolio of technologies and sources. Wind and hydro were the earliest to enter the market and display the highest concentration levels. Solar and especially biomass are less concentrated and are expected to be subject to considerable M & A-activity in the coming years. We would expect acquirer gains to be higher (or losses lower) in less concentrated industries owing to the wider range of potential targets and non-transparent synergy gains reducing the bargaining power of targets.
In our study, we analyze a total of 337 renewable energy transactions in the decade from 2000-2009. Our emphasis is on bidder returns and we widely neglect to report the wealth effects for target shareholders. Our results show that:
• Transactions in the renewable energy industry can increase acquiring shareholder wealth.
• The size of the acquirer and its market-to-book ratio negatively correlate with acquirer returns in the renewable energy industry, potentially indicating that shareholders assume discretionary spending and empire building by acquiring firms’ management.
• Firms from outside the industry can potentially gain a ‘green premium’ by buying into renewable energy, indicated by the positive impact of such transaction on acquirer returns.
The remainder of the paper is organized as follows: Section 2 reviews related literature. In Section 3 we discuss the sample selection procedure and the econometric approach. In Section 4 we present univariate and multivariate analyses of share price announcement effects to mergers and acquisitions. Section 5 summarizes the findings and concludes.
2. Literature Review
For the related utility sector Becker-Blease et al. [18], Berry [19] and Bartunek et al. [20] find large positive abnormal returns to target shareholders, significantly negative abnormal returns to acquirer shareholders and small but significant gains to the combined entity. Mentz and Schiereck [21] document significantly positive abnormal returns to both the acquirer and the combined entity in cross-border transactions of the automotive supply industry. Acquisitions in high-tech industries, on the other hand, tend to have a negative wealth impact on acquirers, likely because the capital market perceives that bidders overpay for the growth potential [22].
The majority of M & A studies focus on public targets, even though over 80% of all acquisitions involve a privately held company or a subsidiary [23]. There is substantial evidence that the organizational form of the target plays an important role. Contrasting the results for buyers of publicly listed companies, a multitude of studies find that acquirers of private firms earn significantly positive abnormal returns, ranging from 1.3% to 2.1% [23-28]. A variety of potential explanations for this phenomenon is discussed. Since private companies are often small and not well-known, takeovers are less driven by adverse managerial incentives related to prestige and firm size [25]. Private firms are usually owned by only few individuals. In case the acquirer pays with stock, the target owners form a large block in the merged company, which is likely to improve the monitoring of the acquirer’s management. The willingness to hold a large block also signals the quality of the buyer [28]. The takeover market for private companies is typically illiquid and there is little bidder competition. Target owners who are eager to sell thus have weaker bargaining power and accept lower premiums [24]. This argument becomes especially relevant when a company is too small to successfully operate on its own and seeks to be taken over by a strong partner [24].
Hite et al. [29] and Sichermann and Pettway [30] examine the divesture of subsidiaries, single divisions and other operating assets. They report a significantly positive abnormal return to both the seller and the acquirer. Fuller et al. [23] and Moeller et al. [27] find that buyers of subsidiaries earn even higher abnormal returns than acquirers of privately held firms. A reason commonly considered is that sellers increase their activity focus and that the proceeds of the sale can be invested in more profitable projects available to the seller [29]. These gains might lead sellers to accept a lower premium. Besides the organizational form of the target, the size of the acquirer has an influence on the success of a merger. Moeller et al. [27] document that small acquirers earn significantly higher abnormal returns than large acquirers. A possible explanation might be that large companies usually have higher free cash flows that encourage discretionary spending and empire-building. It is more frequent in small companies that ownership and management is not separated, naturally decreasing agency cost.
The size of the target relative to the acquirer also tends to affect abnormal returns. On one hand, the target needs to be sufficiently large to provide synergy potential and to positively affect the acquirer’s shareholders. On the other hand, large targets are complex, which complicates the integration process. The findings in the literature are somewhat ambiguous. In a study of bank mergers, Beitel et al. [10] report slightly higher abnormal returns to acquirers of relatively small targets. Focusing on private and subsidiary targets both Fuller et al. [23] and Draper and Paudyal [31] find a positive relationship between relative size and abnormal returns to acquirers. In these cases, the higher value creation potential seems to compensate for the difficulties of integrating a more complex target. The implications of geographical diversification on abnormal returns to acquirers have also been regarded in several M & A studies. Engaging in cross-border deals provides access to new markets and growth opportunities. However, cultural and legal barriers might make it difficult to realize synergy gains [3]. The overall evidence suggests that acquirers benefit more in national, i.e. geographically focused mergers than in cross-border transactions [3,18,32].
3. Data and Methodology
3.1. Data
Relevant transactions were identified using the Thomson One Banker database. Due to a lack of a unique renewable energy industry classification a restricted universe of 26 SIC-codes, which had been identified to contain renewable energy assets by means of industry reports, were used. The broad universe of completed transactions within these industries during 01/01/2000 and 10/15/2009 is narrowed down by querying either the target business description or the deal synopsis for a set of key terms associated with the industry. The remaining transactions are cross-checked individually to correctly identify transactions involving a renewable energy target. After eliminating transactions valued at US $5 million or less the initial sample reduces to 1034 transactions. In a second step, we exclude all transactions that do not comply with the following criteria:
• The bidder acquires a majority stake in the target either by an outright acquisition of more than 50% or raising her stake to more than 50% in a transaction involving at least 25%.
• Stock prices are available 252 trading days before the announcement to 20 days after the announcement.
• The security underlying a deal is frequently traded (liquid) indicated by a price change and positive trading volume for at least half of the model estimation period.
This procedure reduces the sample to a total of 337 transactions. The majority of transactions took place in Europe and North America. In more than half of the cases the acquirer was headquartered in the United States Germany, Canada or Spain. Table 1 provides an overview of selected characteristics of the transactions. Over two thirds of the deals are deemed “operational”, i.e. include a target that owns or operates renewable energy assets. Transactions in the hydropower sector almost entirely belong to this group. The same is true for biomass where over half of the acquisitions involve producers of biodiesel or ethanol. While the majority of wind power transactions are operational, there is also a significant number of “technology” deals defined as equipment or systems manufacturers. Table 1 also documents the importance of companies from outside the sector. Almost 30% of the buyers are utilities that add renewable energy assets to their existing portfolio of conventional power plants. In about 10% of the cases, the acquisition is undertaken by pure financial investors. The acquirers named “Others” include, among others, industrial conglomerates and oil companies. Only about one third of the acquirers are renewable energy companies themselves, the large majority of which executed a horizontal acquisition. Vertical deals are defined as those involving two companies on different stages of the value chain, for example a manufacturer of wind turbines and a wind park operator. Cases in which a renewable energy company purchases a target from another subsector, labeled “diversifying deals” here, are very rare. Only a small number of targets in the sample are publicly listed. The majority is either privately held or a subsidiary. The latter category encompasses single renewable power assets or divisions of the selling company. In about half of the transactions acquirer and target are headquartered in the same country. Cross-border transactions split up almost evenly into intra-continental and cross-continental transactions. In terms of geographic focus, the subsectors show roughly the same distribution as the complete sample.
3.2. Methodology
We use standard event study methodology to assess the value implications of the sample transactions. We apply OLS-regression methodology for a time series of 252 trading days (one full trading year) prior to the event window. Stock returns are calculated with prices adjusted for changes in capital structure (e.g. secondary offerings, dividends). As for the market return, we employ the local benchmark index, predominantly industry indices, as for each stock proposed by Datastream. The calculation was also carried out using broader local indices which yielded qualitatively similar results (not reported here). Abnormal returns of a stock in the event windows are calculated by subtracting the expected stock return from the market model from the observed stock return in the event window. The longest event window is 41 days: T = [−20, 20] days, with t = 0 marking the announcement day of a transaction. To check the robustness of our findings we conduct analyses with eight additional event windows to capture information leakage and allow for a delayed processing of the information by the market.
As suggested by Harrington and Shrider [33], we utilize the test statistic of Boehmer et al. [34] to test the significance of cumulated abnormal returns. The test statistic z is to reflect a variance increase of abnormal returns
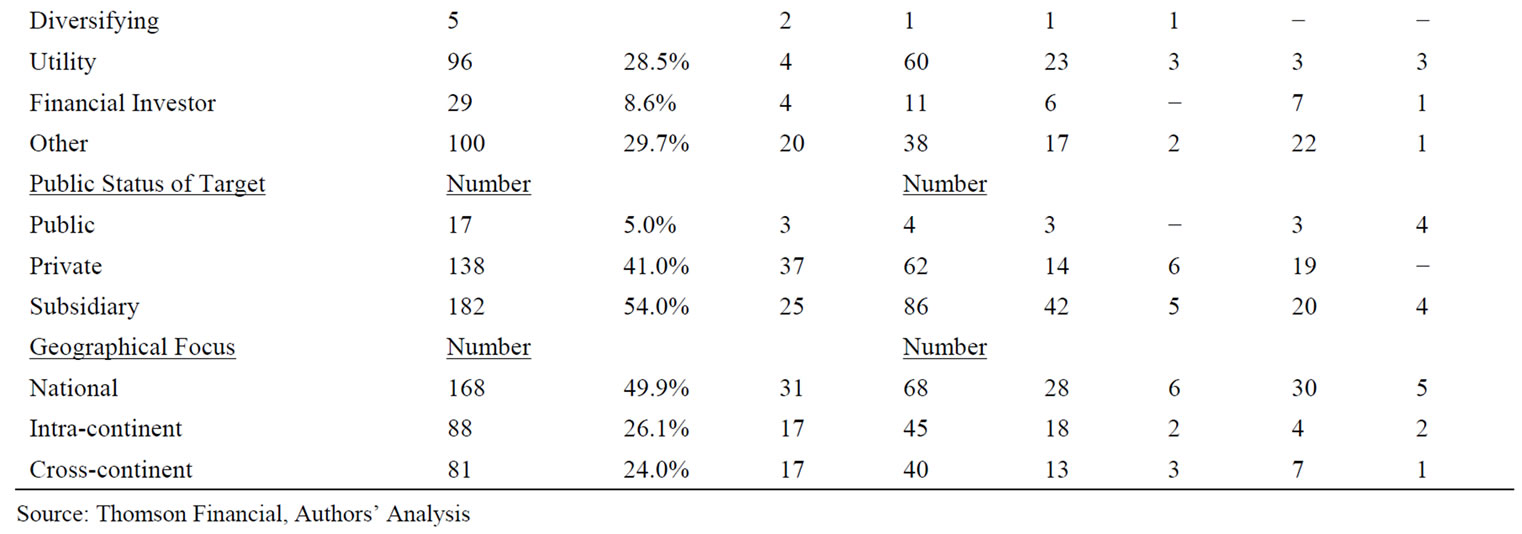
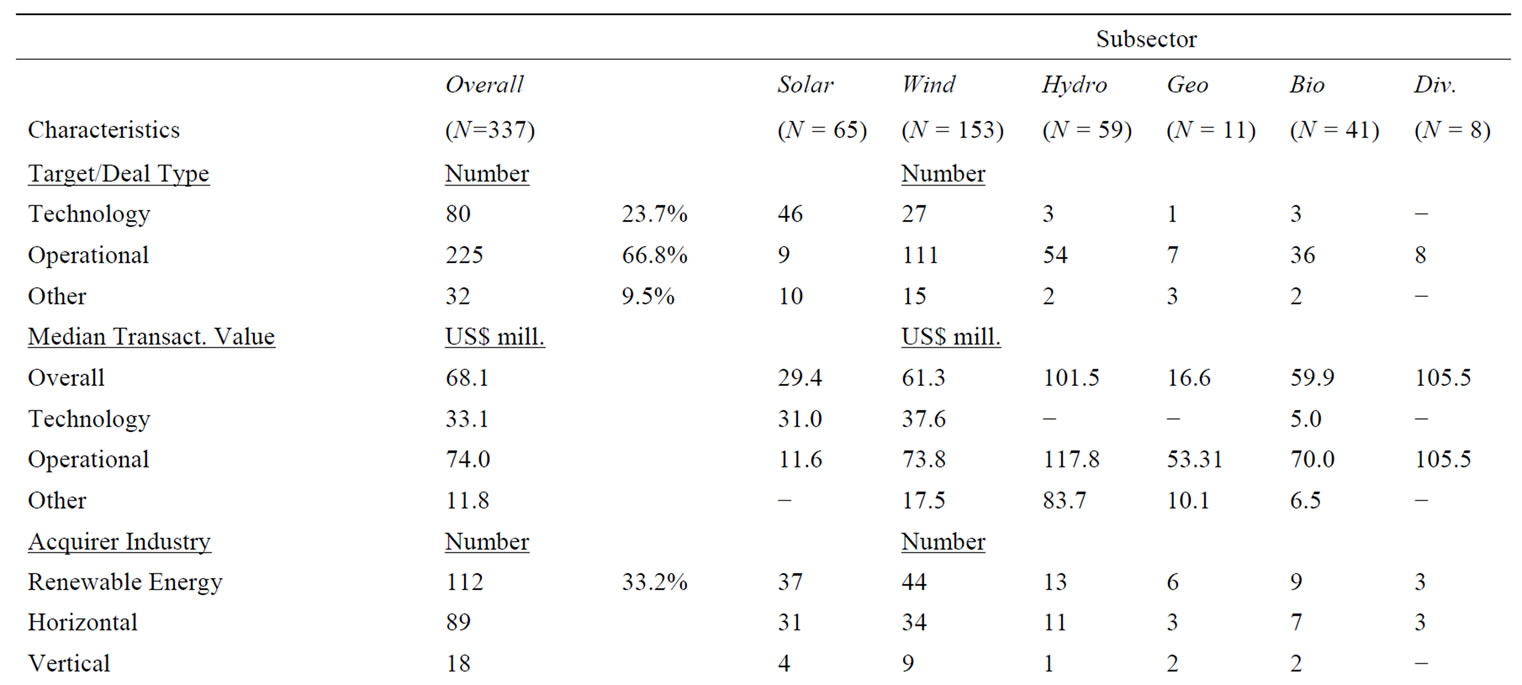
Table 1. Sample description and transaction characteristics.
in the event window. The latter includes a standardization of cumulated abnormal returns that is performed following Mikkelson and Partch [35]. For the combined entity the adjusted standardization factor is calculated as proposed by Houston and Ryngaert [36]. In addition to these parametric tests, the non-parametric Wilcoxon signed-rank test is employed to assess the statistical significance of median cumulated abnormal returns or percentages of positive cumulated abnormal returns, respectively. The difference in mean cumulated abnormal returns is tested with a standard t-test as used by DeLong [32].
4. Results
Table 2 shows—contrary to most cross-sectional studies [2,4]—results which document strong abnormal returns for acquirers of renewable energy assets. The average gain adds to 1.56% in the [0, 1] event window and 2.19% in the [−5, 5] window, both statistically significant. These values are likely to be upward-driven by outliers as suggested by the somewhat lower corresponding median CARs of 0.38% and 0.57%. Save for the last event window [1, 20], the majority of transactions in the respective windows show positive abnormal returns.
For completeness Table 2 also includes targets’ and combined entities’ abnormal returns despite the small sample sizes (17 and 8 for targets and combined entities, respectively) which are a result of the limited availability of target data. The returns to publicly traded renewable energy targets are consistent with findings in the M&A literature and show that target shareholders earn a significant premium. On the announcement day alone the ACAR is 15.78%. Over the period of 41 days around the event the average (median) abnormal return cumulates to a significant 27.17% (median 31.99%), with 76.5% of the targets enjoying positive abnormal returns. Since both acquirer and target shareholders earn positive abnormal returns, the result for the combined entities must suffer from a small sample size (eight) for which data on


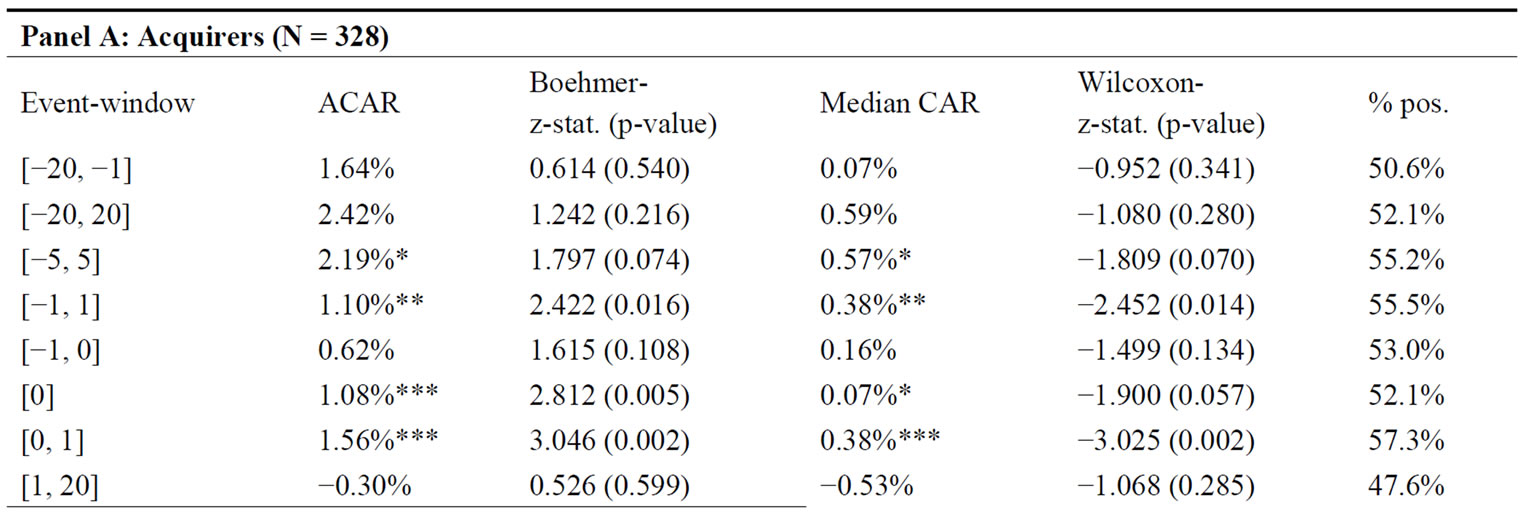
Table 2. Cumulated abnormal returns—entire sample.
both parties are available. Looking at the [−20, 20] event window suggests that a diversified shareholder suffers a reduction of wealth. However, apart from this window, the result of the combined analysis, showing statistically significant returns near the announcement, does mirror those of the separate acquirer and target returns.
The heterogeneity of the renewable energy industry may cause wealth effects to accrue in some sub-sectors where consolidation is perceived particularly beneficial. In order to detect possible differences the sample is divided into solar, wind, hydro, bio and geothermal acquisitions. The short-term abnormal returns to acquirers by sub-sectors are reported in Table 3. On average, acquirers of solar targets nominally earn the highest returns with 11.52% over the 41 days around the announcement. 60.3% of the solar transactions yielded positive CARs to the acquirer in the longest event window. Solar remains a fragmented industry which is expected to further consolidate in the coming years owing to the vast capacities installed recently and the reduction of solar subsidies by key countries. The market seems to award early consolidation movers who benefit from a wide range of potential targets and synergy potential available in the solar industry. The abnormal returns in another fragmented industry—biomass—support this view. Buyers of targets in this sector experience a two-day value gain of 4.33% at the announcement. Wind and Hydro also report positive returns to acquirers, albeit at a lower level.
Both markets are characterized by a higher level of consolidation and the predominant types of transactions are operational. Wind deals account for the largest number of transactions in the sample. They have led to the ten leading wind companies in 2008 accounting for a combined market share of 84%.
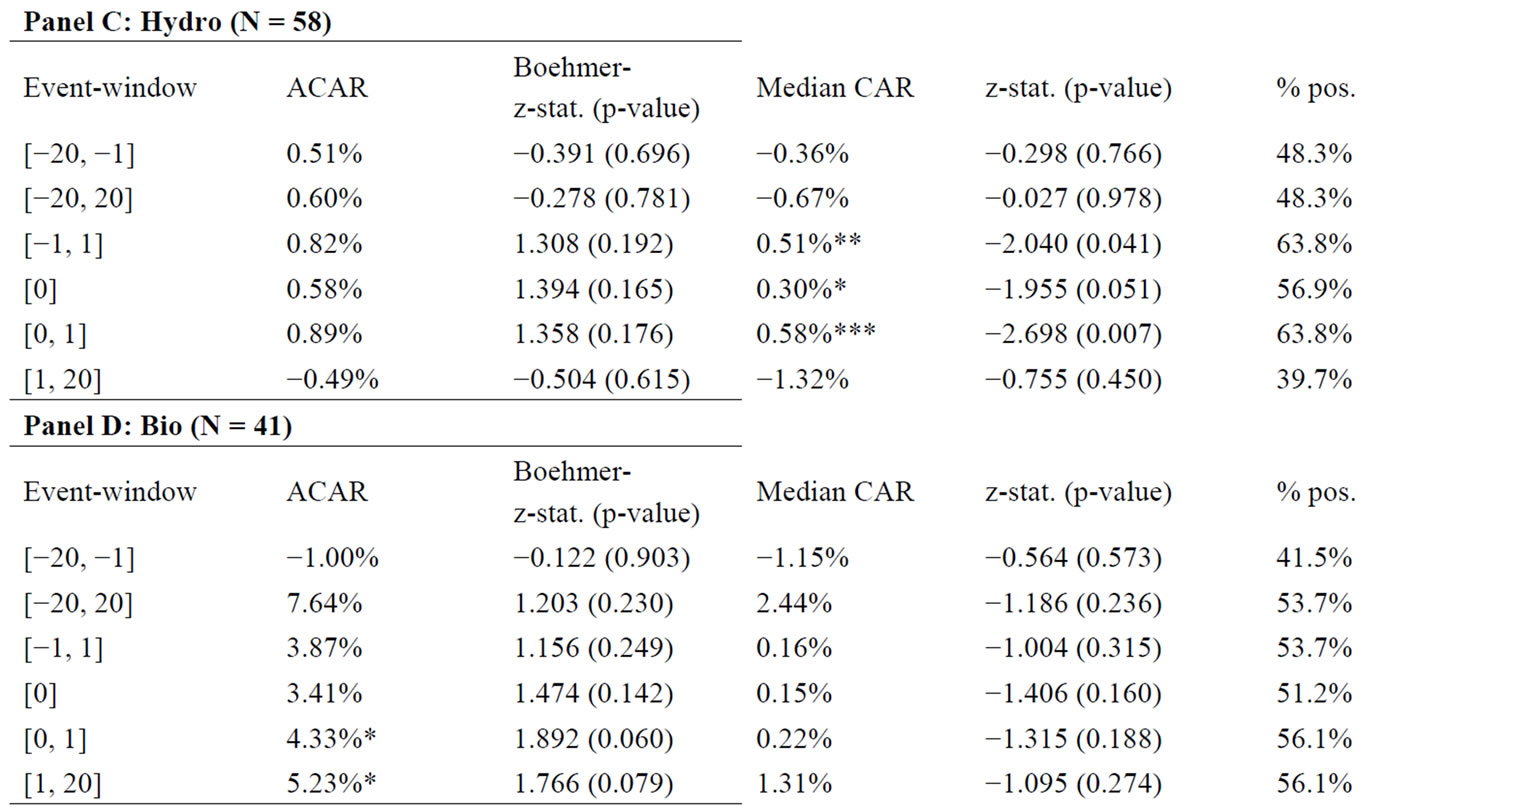
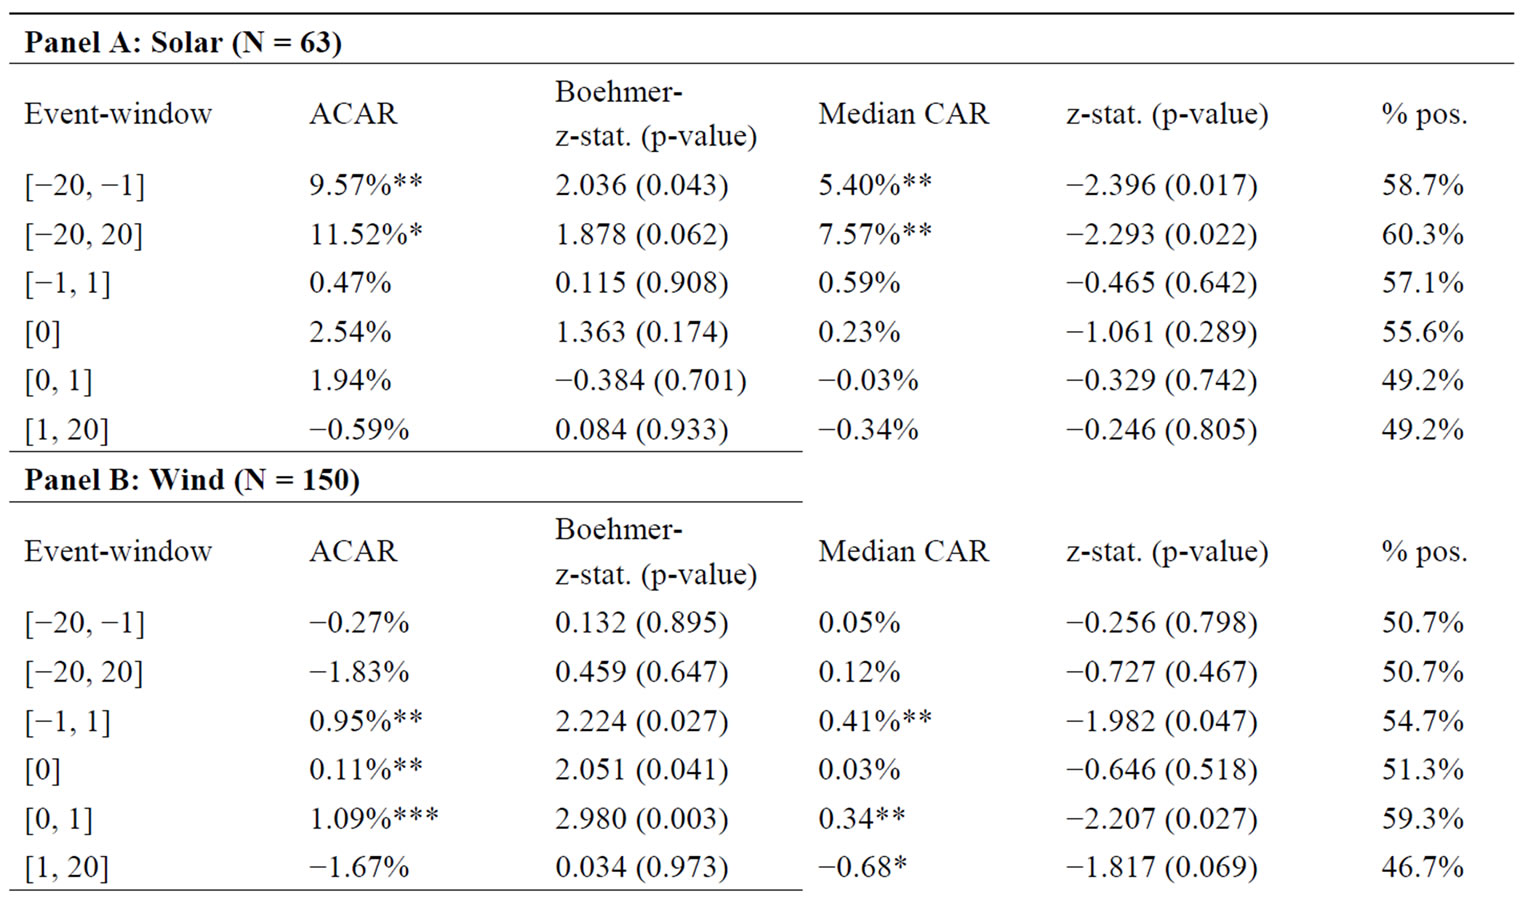
Table 3. Abnormal returns to acquirers by subsector.
Similarly, hydro, being the most established renewable energy technology in Europe, is dominated by three companies controlling approximately 55% of the market: Voith Hydro (Germany), Andritz Hydro (Austria) and Alstom Power Generation (France). One explanation for the lower acquirer returns compared to solar could be that with greater experience the value and synergy potentials of operating assets might be easier to asses. In that case it is possible that the owners of the target require a premium that distributes a large chunk of the benefits to them, leaving acquirer shareholders with only a small portion of the gain. To narrow down the effect, we divide our sample according to acquirer and transaction characteristics that have frequently been reported to have an impact on stock price reactions in the course of corporate takeovers [37].
Among the most consistent factors reported to influence acquirer returns is the public status of the target. The acquisition of privately held and subsidiary targets has been found to be more beneficial to the shareholders of the acquirer than the takeover of publicly listed targets [21,23,28-30]. There is also evidence that the relative size of the target to the bidder matters [38] in that larger targets relative to the size of the acquirer provide higher abnormal returns to acquirer shareholders.
Table 4 reports abnormal returns to these sub-groups of our sample. In line with our expectation, subsidiary transactions earn a statistically significant positive abnormal return in the [0, 1] window. Regarding size there is evidence that relative transaction size does influence abnormal acquirer returns. Acquirers of relatively large targets on average earn 2.76% in the [0, 1] window. The means of both groups are significantly different for both the [0, 1] and [−20, 20] window. Explanations could be that the synergy potential outweighs integration cost, that transaction costs weigh less in larger transactions and that large acquisitions substantially advance a company’s market position. Relative target size also seems to explain the large abnormal returns of the solar and biomass sub-samples. Table 4 reports the average acquirer size and relative target size by sub-sector of the renewable energy industry.
On average, targets in solar (101% of acquirer, based on market capitalization 21 days prior to transact
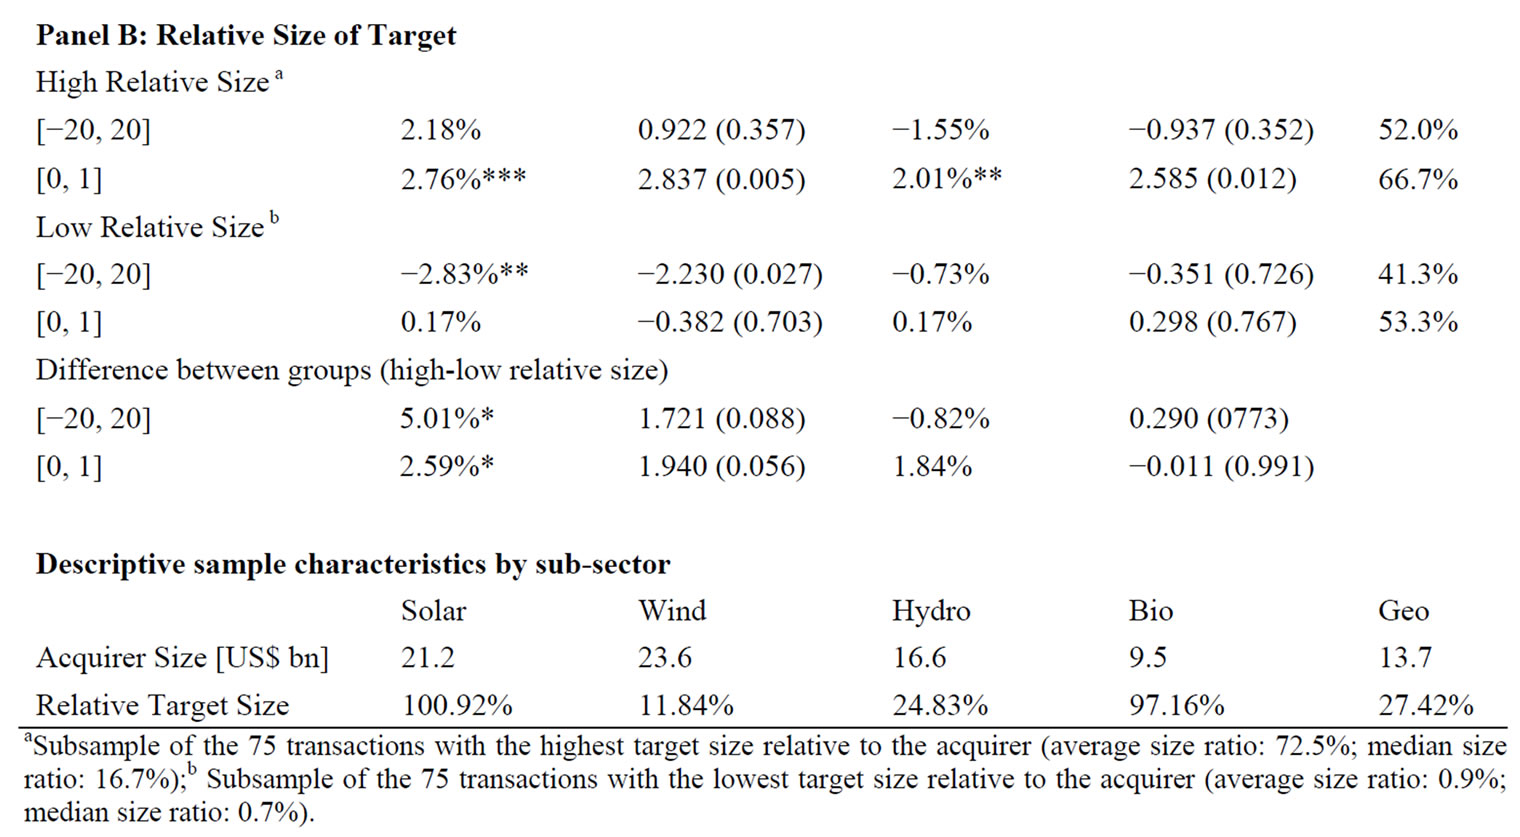
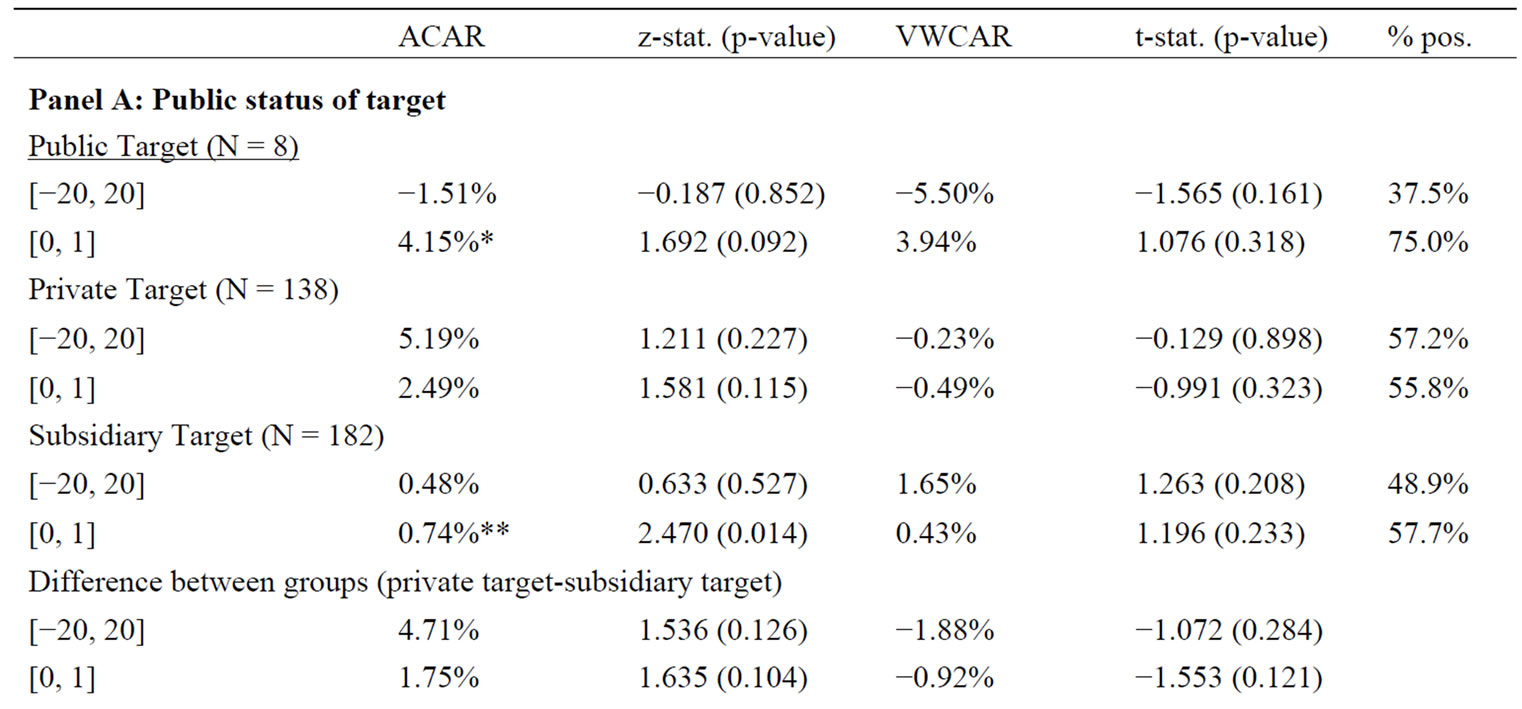
Table 4. Cumulative average abnormal acquirer returns by sample key characteristics.
aSubsample of the 75 transactions with the highest target size relative to the acquirer (average size ratio: 72.5%; median size ratio: 16.7%);b Subsample of the 75 transactions with the lowest target size relative to the acquirer (average size ratio: 0.9%; median size ratio: 0.7%).
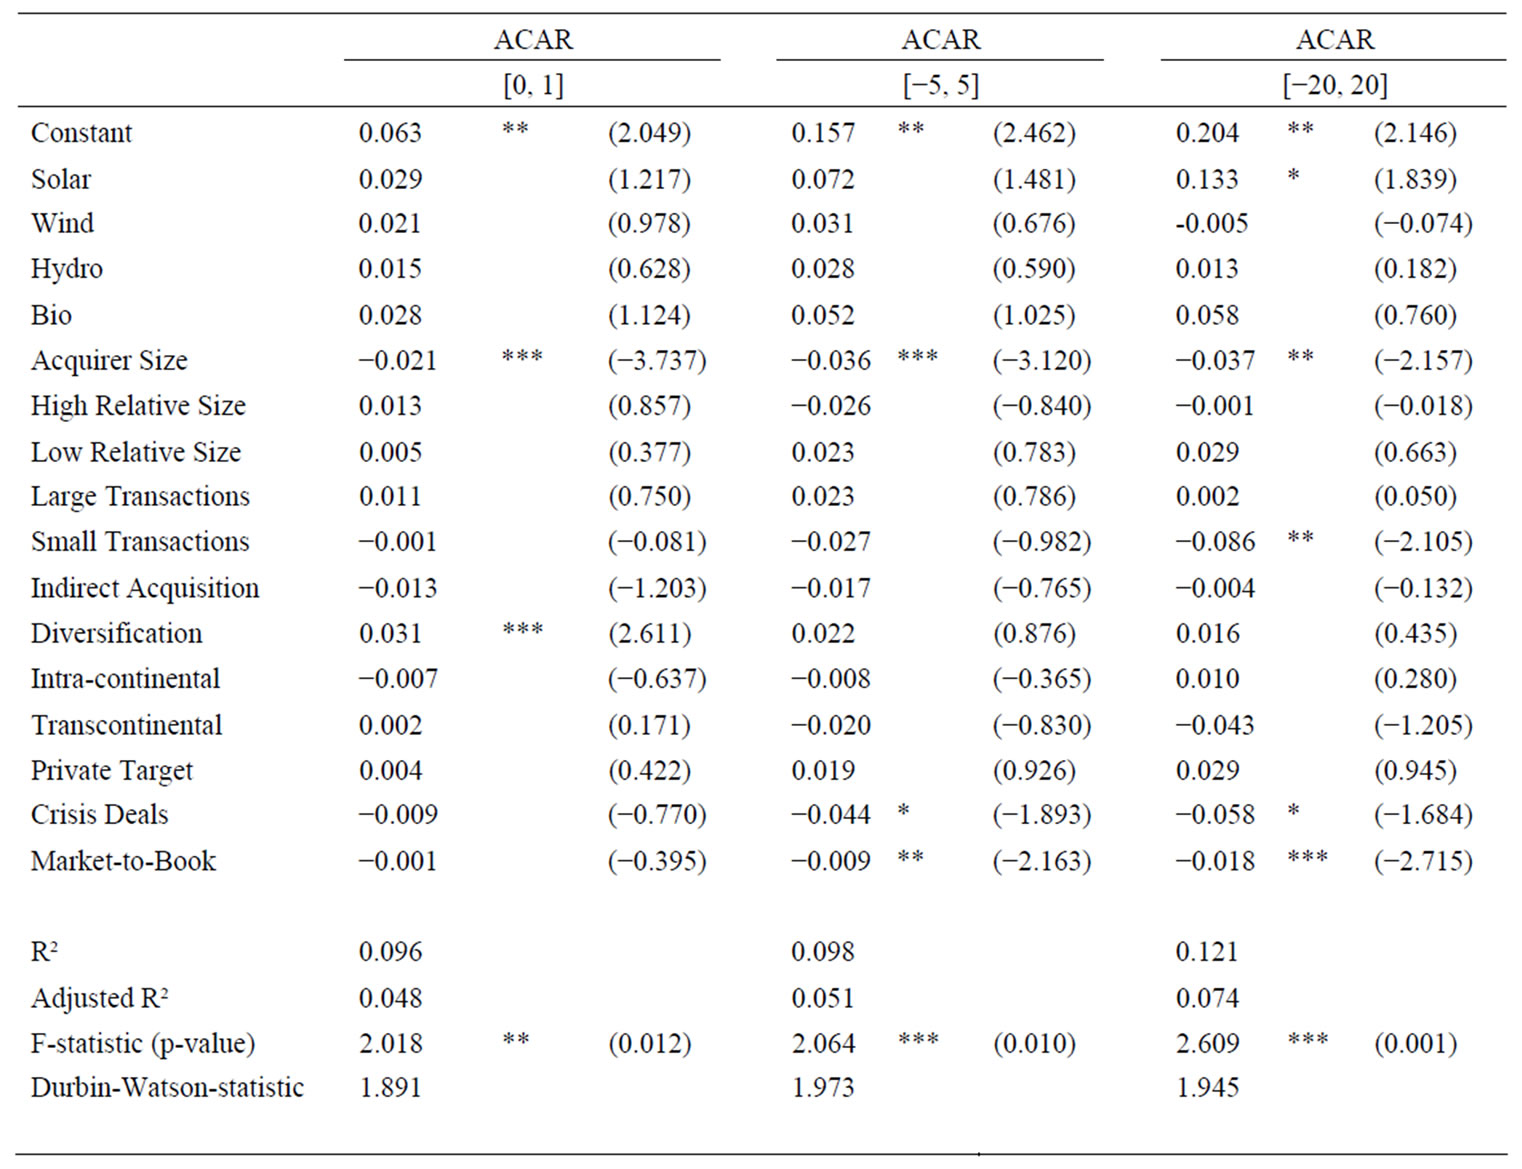
Table 5. Cross-sectional OLS-regression models on CARs to acquirers.
tion and extrapolated transaction value) and biomass (97%) by far outweigh targets in the wind (12%), hydro (25%) and geothermal (27%) sub-sectors.
To cross-check the results and take a closer look at the factors driving acquirer returns we conduct a crosssectional analysis. We estimate regressions using ordinary least squares and expand our set of factors to capture alternative drivers of acquirer returns. In addition to the previously reported variables (subsector, public status, relative size of target) we include factors for absolute acquirer size (logarithm of the market value 21 days prior to announcement, divided by 100 000), transaction size (dummy variables for large and small transactions), acquisition mode (dummy variable assuming 1 for indirect transactions via related entities or 0 for direct transactions), activity diversification (dummy variable assuming 1 if the acquirer is from outside the sector and 0 if otherwise), geographical diversification (dummy variables assuming 1 if the transaction is intraor transcontinental and 0 otherwise), market phase (dummy variable assuming 1 if transaction took place during the recent financial crisis, i.e. after Lehman filing for Chapter 11 and 0 otherwise) and expected growth and profitability (indicated by market-to-book ratio).
The results of the cross-sectional analysis are reported in Table 5. The regressions are performed on the CARs of three different event windows. All three models are significant. The Durbin-Watson statistics are approximately equal to 2, indicating that the residuals are not auto-correlated.
The most consistent impact on acquirer returns across all three models stems from the acquirer size variable. Larger acquirers significantly perform worse than smaller bidders. As Moeller et al. [27] point out, possible explanations might be that managers of large companies are more prone to over-confidence and that the availability of large free cash flows encourages them to undertake negative net present value projects. Thus, motives other than shareholder value creation might drive acquisitions by large companies.
There is weak evidence that transactions in the solar sector have a positive impact on acquirer returns. This might result from the availability of many attractive targets at the beginning of the industry’s consolidation. The findings about the impact of activity diversification are consistent with the “green premium” argument described previously. By acquiring renewable energy assets, diversified or non-green companies can spread the sustainability signal over non-green assets. The two-day abnormal return to companies from outside the sector is 3.1 percentage points higher (significant at the 1%—level) than the CAR to renewable energy companies engaging in activity focused mergers.
Contradicting the findings of Lang et al. [39] and Servaes [40], a significant negative relation is found between short-term abnormal returns and the market-to-book ratio of the acquirer. Rau and Vermaelen [41], who focus on the long-run performance of acquirers, find the same negative influence. They argue that managers extrapolate the past performance of their company when considering mergers. Managers of firms that performed well, indicated by a high market-to-book ratio, are likely to be overconfident when assessing the value creation potential of an acquisition. The capital market’s anticipation of this behavior can then explain the negative relationship.
5. Conclusions
In this study we investigate share price reactions to M&A-transactions in the rapidly growing renewable energy industry. We focus on acquirer effects and document positive returns on a sample of 337 transactions completed between January 2000 and October 2009. We read this as shareholder approval of a healthy consolidation in an emerging industry where larger players are more likely to extract efficiency gains and exert influence on politics. External growth is seen as an increased likelihood of being among the future winners of a still fragmented industry.
We document that acquirers from outside the industry earn positive abnormal returns when diversifying their activities towards renewable energy. We interpret this as a positive signal to shareholders about the sustainability of returns. Diversified acquirers can spread this ‘green premium’ over non-green assets. We further show that the size of the acquirer and its market-to-book ratio correlate negatively with acquirer returns. This corresponds to the notion that large, high market-to-book firms’ acquisitions are more likely to be motivated by other reasons than shareholder wealth. These firms need to carefully select target firms and trade off external growth with profitability.
6. References
[1] Renewable Energy Policy Network for the 21 Century, “Renewables Global Status Report: 2009 Update,” 2009. http://www.ren21.net/pdf/RE_GSR_2009_Update.pdf
[2] G. Andrade, M. Mitchell and E. Stafford, “New Evidence and Perspectives on Mergers,” Journal of Economic Perspectives, Vol. 15, No. 2, 2001, pp. 103-120. doi:10.1257/jep.15.2.103
[3] J. M. Campa and I. Hernando, “Shareholder Value Creation in European M & As,” European Financial Management, Vol. 10, No. 1, 2004, pp. 47-81. doi:10.1111/j.1468-036X.2004.00240.x
[4] R. F. Bruner, “Does M & A Pay? A Survey of Evidence for the Decision-Maker,” Journal of Applied Finance, Vol. 12, No. 1, 2002, pp. 48-68.
[5] T. Loughran and A. M. Vijh, “Do Long-Term Shareholders Benefit from Corporate Acquisitions?” Journal of Finance, Vol. 52, No. 5, 1997, pp. 1765-1790. doi:10.2307/2329464
[6] R. Roll, “The Hubris Hypothesis of Corporate Takeovers,” Journal of Business, Vol. 59, No. 2, 1986, pp. 197-216. doi:10.1086/296325
[7] M. C. Jensen, “Agency Costs of Free Cash Flow, Corporate Finance, and Takeovers,” American Economic Review, Vol. 76, No. 2, 1986, pp. 323-329.
[8] M. L. Mitchell and J. H. Mulherin, “The Impact of Industry Shocks on Takeover and Restructuring Activity,” Journal of Financial Economics, Vol. 41, 1996, pp. 193-229. doi:10.1016/0304-405X(95)00860-H
[9] J. D. Cummins and M. A. Weiss, “Consolidation in the European Insurance Industry,” Brookings-Wharton Papers on Financial Services, Vol. 2004, 2004, pp. 217-258. doi:10.1353/pfs.2004.0001
[10] P. Beitel, D. Schiereck and M. Wahrenburg, “Explaining M & A Success in European Banks,” European Financial Management, Vol. 10, No. 1, 2004, pp. 109-139. doi:10.1111/j.1468-036X.2004.00242.x
[11] S. K. H. Gross and H. Lindstädt, “Horizontal and Vertical Takeover and Sell-off Announcements: Abnormal Returns Differ by Industry,” Corporate Ownership & Control, Vol. 3, No. 2, 2005, pp. 23-30.
[12] Intergovernmental Panel on Climate Change, “Climate Change 2007: The Physical Science Basis—Summary for Policymakers,” 2007. http://www.ipcc.ch/pdf/assessment-report/ar4/wg1/ar4-wg1-spm.pdf
[13] R. D. Klassen and C. P. McLaughlin, “The Impact of Environmental Management on Firm Performance,” Management Science, Vol. 42, No. 8, 1996, pp. 1199- 1214. doi:10.1287/mnsc.42.8.1199
[14] J. Derwall, N. Guenster, R. Bauer and K. Koedijk, “The Eco-Efficiency Premium Puzzle,” Financial Analysts Journal, Vol. 61, No. 2, 2005, pp. 51-63. doi:10.2469/faj.v61.n2.2716
[15] P.T. Chan, “‘Green’, Are You Lovin’ It? An Examination of the Environmental-Friendly IPOs and SEOs,” SSRN eLibrary, 2009. http://ssrn.com/paper=1468902
[16] J. R. Ritter, “The Long-Run Performance of Initial Public Offerings,” Journal of Finance, Vol. 46, No. 1, 1991, pp. 3-27. doi:10.2307/2328687
[17] T. Loughran and J. R. Ritter, “The Operating Performance of Firms Conducting Seasoned Equity Offerings,” Journal of Finance, Vol. 52, No. 5, 1997, pp. 1823-1850. doi:10.2307/2329466
[18] J. Becker-Blease, L. Goldberg and F. Kaen, “Mergers and Acquisitions as a Response to the Deregulation of the Electric Power Industry: Value Creation or Value Destruction?” Journal of Regulatory Economics, Vol. 33, No. 1, 2008, pp. 21-53. doi:10.1007/s11149-007-9047-7
[19] S. K. Berry, “Excess Returns in Electric Utility Mergers during Transition to Competition,” Journal of Regulatory Economics, Vol. 18, No. 2, 2000, pp. 175-188. doi:10.1023/A:1008172602736
[20] K. Bartunek, K. Jessell and J. Madura, “Are Acquisitions by Utility Firms Beneficial?” Applied Economics, Vol. 25, No. 11, 1993, pp. 1401-1408. doi:10.1080/00036849300000144
[21] M. Mentz and D. Schiereck, “Cross-Border Mergers and the Cross-Border Effect: The Case of the Automotive Supply Industry,” Review of Managerial Science, Vol. 2, No. 3, 2008, pp. 199-218. doi:10.1007/s11846-008-0022-1
[22] J. Ang and N. Kohers, “The Take-over Market for Privately Held Companies: The US Experience,” Cambridge Journal of Economics, Vol. 25, No. 6, 2001, pp. 723-748. doi:10.1093/cje/25.6.723
[23] K. Fuller, J. Netter and M. Stegemoller, “What Do Returns to Acquiring Firms Tell Us? Evidence from Firms that Make Many Acquisitions,” Journal of Finance, Vol. 57, No. 4, 2002, pp. 1763-1793. doi:10.1111/1540-6261.00477
[24] L. Capron and J. C. Shen, “Acquisitions of Private vs. Public Firms: Private Information, Target Selection, and Acquirer Returns,” Strategic Management Journal, Vol. 28, No. 9, 2007, pp. 891-911. doi:10.1002/smj.612
[25] P. Draper and K. Paudyal, “Information Asymmetry and Bidders’ Gains,” Journal of Business Finance & Accounting, Vol. 35, No. 3-4, 2008, pp. 376-405. doi:10.1111/j.1468-5957.2008.02082.x
[26] N. Kohers, “Acquisitions of Private Targets: The Unique Shareholder Wealth Implications,” Applied Financial Economics, Vol. 14, No. 16, 2004, pp. 1151-1165. doi:10.1080/09603100412331297676
[27] S. B. Moeller, F. P. Schlingemann and R. M. Stulz, “Firm Size and the Gains from Acquisitions,” Journal of Financial Economics, Vol. 73, 2004, pp. 201-228. doi:10.1016/j.jfineco.2003.07.002
[28] S. Chang, “Takeovers of Privately Held Targets, Methods of Payment, and Bidder Returns,” Journal of Finance, Vol. 53, No. 2, 1998, pp. 773-784. doi:10.1111/0022-1082.315138
[29] G. L. Hite, J. E. Owers and R. C. Rogers, “The Market for Interfirm Asset Sales: Partial Sell-offs and Total Liquidations,” Journal of Financial Economics, Vol. 18, No. 12, 1987, pp. 229-252. doi:10.1016/0304-405X(87)90040-7
[30] N. W. Sicherman and R. H. Pettway, “Wealth Effects for Buyers and Sellers of the Same Divested Assets,” The Journal of the Financial Management Association, Vol. 21, 1992, p. 119. doi:10.2307/3665845
[31] P. Draper and K. Paudyal, “Information Asymmetry and Bidders’ Gains,” Journal of Business Finance & Accounting, Vol. 35, No. 3-4, 2008, pp. 376-405. doi:10.1111/j.1468-5957.2008.02082.x
[32] G. L. DeLong, “Stockholder Gains from Focusing Versus Diversifying Bank Mergers,” Journal of Financial Economics, Vol. 59, No. 2, 2001, pp. 221-252. doi:10.1016/S0304-405X(00)00086-6
[33] S. E. Harrington and D. G. Shrider, “All Events Induce Variance: Analyzing Abnormal Returns When Effects Vary Across Firms,” Journal of Financial & Quantitative Analysis, Vol. 42, No. 1, 2007, pp. 229-256. doi:10.1017/S002210900000226X
[34] E. Boehmer, J. Musumeci and A. B. Poulsen, “EventStudy Methodology under Conditions of Event-Induced Variance,” Journal of Financial Economics, Vol. 30, No. 2, 1991, pp. 253-272. doi:10.1016/0304-405X(91)90032-F
[35] W. H. Mikkelson and M. M. Partch, “Withdrawn Security Offerings,” Journal of Financial & Quantitative Analysis, Vol. 23, No. 2, 1988, pp. 119-133. doi:10.2307/2330876
[36] J. F. Houston and M. D. Ryngaert, “The Overall Gains from Large Bank Mergers,” Journal of Banking & Finance, Vol. 18, No. 6, 1994, pp. 1155-1176. doi:10.1016/0378-4266(94)00065-4
[37] S. B. Moeller, F. P. Schlingemann and R. M. Stulz, “Wealth Destruction on a Massive Scale? A Study of Acquiring-Firm Returns in the Recent Merger Wave,” Journal of Finance, Vol. 60, No. 2, 2005, pp. 757-782. doi:10.1111/j.1540-6261.2005.00745.x
[38] P. Asquith, R. F. Bruner and D. W. Mullins Jr., “The Gains to Bidding Firms from Merger,” Journal of Financial Economics, Vol. 11, No. 1-4, 1983, pp. 121-139. doi:10.1016/0304-405X(83)90007-7
[39] L. H. P. Lang, R. M. Stulz and R. A. Walkling, “Managerial Performance, Tobin’s Q, and the Gains from Successful Tender Offers,” Journal of Financial Economics, Vol. 24, No. 1, 1989, pp. 137-154. doi:10.1016/0304-405X(89)90075-5
[40] H. Servaes, “Tobin’s Q and the Gains from Takeovers,” Journal of Finance, Vol. 46, No. 1, 1991, pp. 409-419. doi:10.2307/2328702
[41] P. R. Rau and T. Vermaelen, “Glamour, Value and the Post-Acquisition Performance of Acquiring Firms,” Journal of Financial Economics, Vol. 49, No. 2, 1998, pp. 223-253. doi:10.1016/S0304-405X(98)00023-3
NOTES
*The financial support by the German Ministry of Education and Research is acknowledged

