Journal of Electromagnetic Analysis and Applications
Vol. 3 No. 9 (2011) , Article ID: 7454 , 8 pages DOI:10.4236/jemaa.2011.39056
Thin Film Characterization Using Rotating Polarizer Analyzer Ellipsometer with a Speed Ratio 1:3
![]()
Physics Department, Islamic University of Gaza, Gaza, Palestine.
Email: *staya@iugaza.edu.ps
Received June 26th, 2011; revised July 27th, 2011; accepted August 10th, 2011.
Keywords: Ellipsometry, Rotating Polarizer-Analyzer Ellipsometer, Thin Film Characterization, Optical Constants, C-Si, SiO2
ABSTRACT
In a recent previous work, we proposed a rotating polarizer-analyzer ellipsometer (RPAE) in which the two elements are rotating synchronously in the same direction with a speed ratio 1:3. We applied this technique to bulk samples. In this work, we present theoretically the characterization of 100 nm SiO2 thin film using this spectroscopic RPAE. We assume a structure consisting of air (ambient)/SiO2 (thin film)/c-Si (substrate). The ellipsometric parameters ψ and Δ are calculated when a clean signal is received by the detector and when a hypothetical noise is imposed on this signal. The film thickness and the optical constants of the film are calculated for the noisy signal in the spectrum range 200 - 800 nm. The results are compared with the proposed thickness and with the accepted values for SiO2 optical constants.
1. Introduction
Due to the unique optical and electric features of thin film structures, they have been widely studied in various applications such as sensors and optical waveguides. However, imperfections such as small crackers, isolated islands, and layer roughness are inevitable in practical fabrication process of thin films [1]. These imperfections are in the nano-scale level. Thus, characterization of thin film with high spatial resolution becomes essential to ensure the performance of designed thin film devices. Among the different characterization methods, optical characterization techniques are preferred due to their non-destructiveness. Two commonly used optical methods are surface plasmon resonance methods [2], and ellipsometry methods [3-6]. Spectroscopic ellipsometry is nowadays a standard optical technique for studying the optical properties of materials and for thin films characterization.
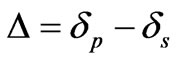
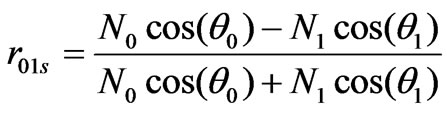
An ellipsometric measurement allows one to quantify the phase difference between Ep and Es, Δ, and the ratio of their amplitudes given by tanψ. For a reflecting surface, the forms of Δ and ψ are
 and
and ,(1)
,(1)
where  and
and  are the phase changes for the p and s components of light and rp and rs are the complex Fresnel reflection coefficients for the p and s components which may be written as
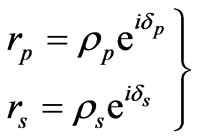 . (2)
. (2)
Early in the seventies, the dynamic scanning ellipsometer has shown a great ability of determining optical constants of materials in the range 1.5 - 6 eV photon energy [7,8]. Since then, ellipsometry has received an increasing interest and the technique has been improved. Different models that can work in the visible region have been proposed and constructed [9-13]. Among the various configurations of spectroscopic ellipsometers commonly used is the rotating analyzer ellipsometer RAE [7]. In such a model, the polarizer angle P is fixed while the analyzer angle A rotates at an angular speed ω. In terms of A = ωt, the intensity of light emerging from the analyzer can be written as one dc and two ac components from which the ellipsometric parameters ψ and Δ are obtained. The RAE has the advantage of simple system design but it involves the dc component which causes a serious problem. The reduction of the dc background requires particular techniques and the calibration of such system is also time consuming [13].
In 1987, a RPAE was proposed and constructed [11]. In the design, the polarizer and the analyzer rotate with a speed ratio 1:2. The final light intensity then contains three cosine terms from which ψ and Δ are calculated. In this design, the errors arising from the phase shift and dc background are eliminated.
An improved RPAE was proposed [12,13] with the speed ratio still being 1:2 but with the incident angle being fully variable. Moreover, a fixed polarizer was placed in the optical path to eliminate the source polarization effect. The final light intensity thus contains four ac components. The optical constants and the ellipsometric parameters were obtained by calculating any one of the two sets of ac signals.
In 2010, El-Agez et al. proposed a RPAE in which the polarizer and the analyzer are rotating synchronously in opposite directions at the same speed [14]. The light intensity involves four components, one dc and three cosine terms, with frequencies of ω, 2ω, and 3ω.
A RPAE in which the two elements rotate in the same direction with the same angular speed was also proposed and applied to bulk c-Si and Au samples [15]. The results of bulk samples have shown high accuracy. In a recent theoretical work [16], a RPAE in which the polarizer and the analyzer are rotating synchronously in the same direction at a speed ratio 1:3 is proposed. The light intensity received by the detector contains six components, one dc and five ac, with frequencies of 2ω, 4ω, 6ω, 8ω, and 10ω, respectively. The ellipsometric parameters ψ and Δ were calculated using any of six different sets of the Fourier coefficients. The results from the simulated spectra of the complex refractive index of c-Si, ZnSe, and GaP were presented.
In this work, we examine theoretically the noise effect on the characterization of 100 nm SiO2 thin film using the RPAE described in [16]. The structure under consideration consists of a thin SiO2 film sandwiched between air and silicon substrate. The optical parameters and the thickness of the film are calculated from the ellipsometric parameters and compared to accepted values. In order to simulate reality we consider a hypothetical noise is imposed on the clean signal. This noise causes a percent error on the calculated values. The percent error is also presented.
2. Theory
The basic setup of the proposed ellipsometer is shown Figure 1. It consists of the following elements: 1) light
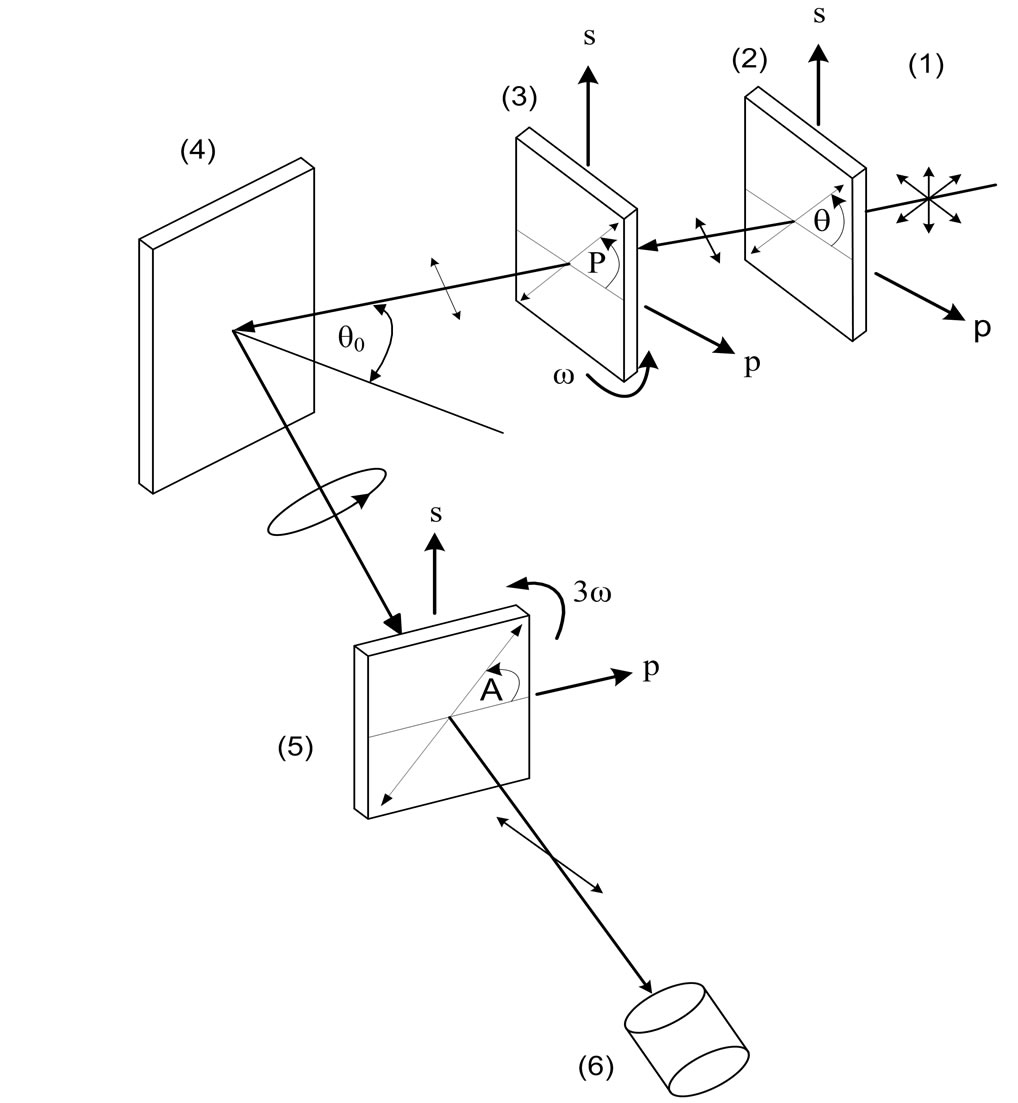
Figure 1. Simplified schematic diagram of the RPA ellipsometer. (1) Unpolarized light; (2) fixed linear polarizer; (3) linear polarizer rotates at ω; (4) an isotropic sample; (5) linear analyzer rotates at 3ω; and (6) detector. Here, P = ωt + τ and A = 3ωt + δ.
source; 2) fixed linear polarizer; 3) linear polarizer rotating at ω; 4) an isotropic specimen; 5) linear analyzer rotating at 3ω; and 6) a photodetector. Here we assume that the azimuth angles of the rotating polarizer and the rotating analyzer are given by P = ωt + τ and A = 3ωt + δ, respectively, where τ and δ are the azimuth angles of the rotating polarizer and the rotating analyzer at t = 0, respectively. A well-collimated beam of monochromatic unpolarized light successively emerges through the fixed polarizer, the rotating polarizer, then is reflected from the sample, and finally is collected by the detector through the projection of the analyzer as shown in Figure 1.
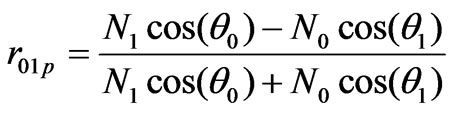
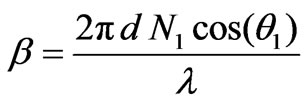
The sample under consideration consists of a thin SiO2 film of thickness d = 100 nm and refractive index N1 sandwiched between an ambient (air) of refractive index N0 and a c-Si substrate of refractive index N2 as shown in Figure 2. For the proposed configuration, the Fresnel reflection coefficients of the system is given by [3]
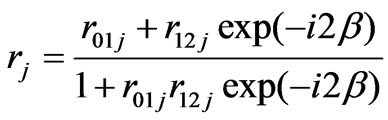 , (3)
, (3)
where j stands for s in s-polarization and for p in p-polarization,
 (4)
(4)
 , (5)
, (5)
 , (6)
, (6)
 (7)
(7)
 (8)
(8)
and θ1 and θ2 are the refraction angles in the film and the substrate, respectively.
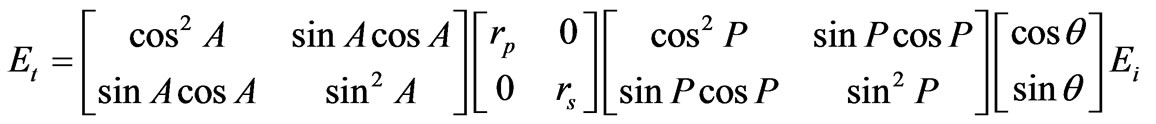
Employing Jones-matrix formalism, the transmitted electric field Et in terms of the incident field Ei is given by
 (9)
(9)
where θ is the azimuth angle of the fixed polarizer.
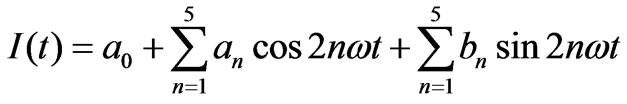
The light intensity I received by the detector is given by  which can be expanded as a Fourier series as
 (10)
(10)
where
 (11)
(11)
 (12)
(12)
 (13)
(13)
 (14)
(14)
 (15)
(15)
 (16)
(16)
 (17)
(17)
 (18)
(18)
 (19)
(19)
 (20)
(20)
 (21)
(21)
Assuming that the azimuth angles θ, τ, and δ are equal to zero, Equation (10) reduces to
 , (22)
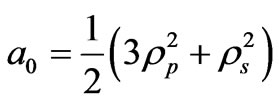
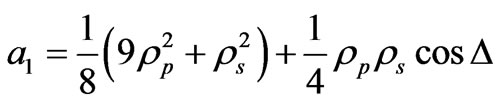
where the coefficients an are given by
 , (23)
 , (24)
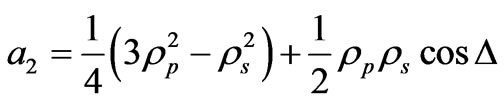 , (25)
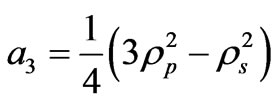 , (26)
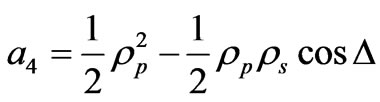 , (27)
and
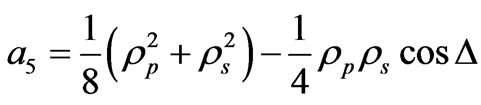 . (28)
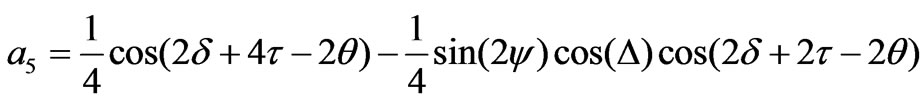
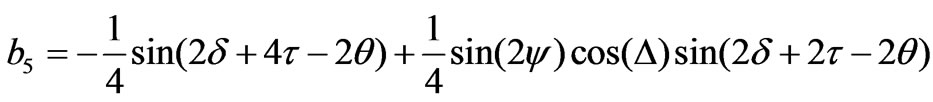
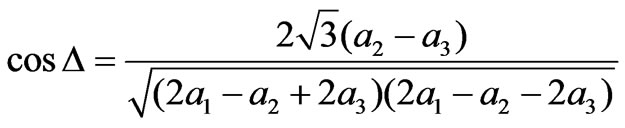
The ellipsometric parameters ψ and Δ can be determined using any set containing three coefficients. Excluding the dc coefficient (a0), six different sets may be obtained. These sets are (a1, a2, a3), (a1, a2, a4), (a1, a2, a5), (a2, a3, a4), (a2, a3, a5), and (a3, a4, a5). Any of these sets can be used to calculate ψ and Δ. It was shown that in Ref. [16] that the first two sets correspond to the minimum error compared to other sets. The parameters ψ and Δ in terms of the first set are given by
 , (29)
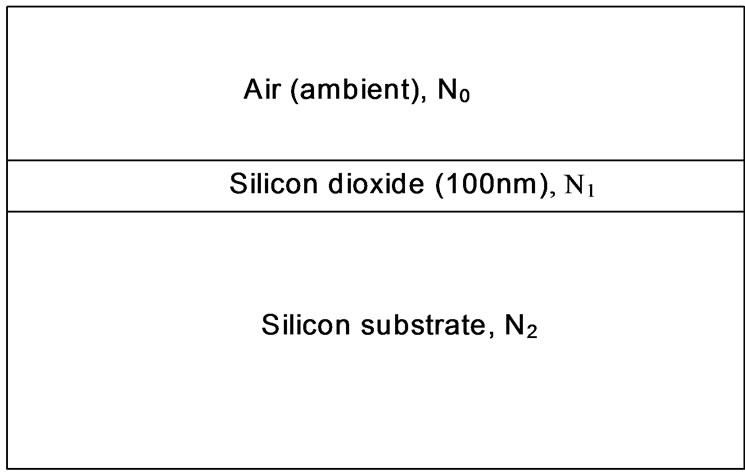
Figure 2. Schematic diagram for the sample under consi-deration.
 (30)
(30)
3. Numerical Calculations
The Fresnel complex reflection coefficients rp and rs for p and s light components are calculated according to Equation (3) based on the published values for the refractive indices of c-Si and SiO2 [17]. In our calculations, we assume that the incidence angle θ0 = 70˚ and the azimuth angles θ, τ, and δ are set to zero. Simulated light signals are generated based on Equation (9) without considering imperfections and misaligned optical components. Fourier transform of the generated signal was taken to extract the coefficients a0 through a5. Equations (29) and (30) are used to calculate the ellipsometric parameters ψ and Δ in the spectrum range 200 - 800 nm. We will restrict our calculations to the first set since it along with the second set corresponds to the minimum percent error among all sets [16]. These values of the ellipsometric parameters correspond to the clean signal without considering any noise.
The ultimate accuracy and detection limit of an ellipsometer is determined by the inevitable presence of undesired noise which causes random fluctuations in the recorded signal. This noise may originates from a variety of sources such as thermal fluctuations in the light source, mechanical vibrations, pickup of stray AC light, and the self generated noise in detectors and electronics. Such noise is reduced by signal averaging, and can be measured by performing multiple identical runs and by calculating the mean and the standard deviation.
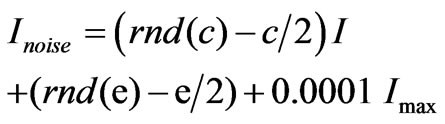
In order to simulate real signals, noise was generated using MathCAD code and was superimposed on the clean signal according to the following equation
 (31)
(31)
where MathCAD’s rnd(c) function produces random noise in the range from 0 to c and rnd(e) function produces random noise in the range from 0 to e. In our simulation, we consider c = e = 1. The first term represents the random noise recorded by the detector due to thermal fluctuations of the light source after passing through the system, the second corresponds to Johnson noise and shot noise encountered in the detector and readout electronics, and the third term represents the dc
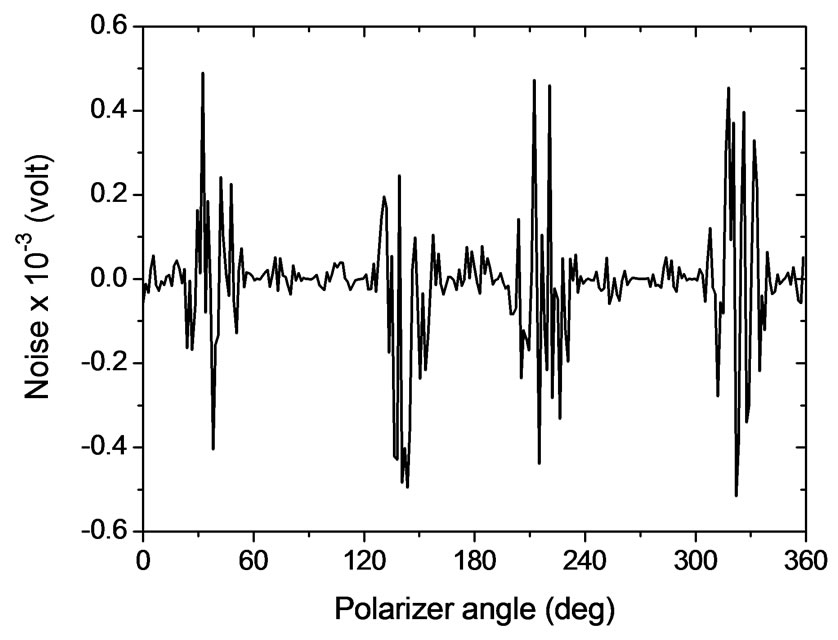
Figure 3. The noise superimposed on the clean signal.
offset due to long time drifts. Figure 3 shows the noise superimposed on the clean signal.
This noise is added to the pure signal. Fourier transform of the noisy signal is taken to extract the new coefficients a0 through a5 in the presence of the noise. Equations (18) and (19) are used again to calculate the ellipsometric parameters ψ and Δ for the noisy signal in the same spectrum range. Figures 4 and 5 show the calculated ellipsometric parameters ψ and Δ, respectively, for the clean and noisy signals in the spectrum range 200 - 800 nm.
The percent error in the calculated values of ψ and Δ is shown in Figure 6. These fluctuations shown in the figure are due to the noise imposed on the clean signal as mentioned before. It is worth to mention that these values of ψ and Δ were calculated using the coefficients a1, a2, and a3 without depending on the dc offset of the signal for the clean and the noisy signals. If the dc term is considered in the calculations, the percent error in ψ and Δ would be much higher [14-16]. This ellipsometer in which the polarizer and the analyzer rotate in the same direction with a speed ratio 1:3 has the advantage that the results do not depend entirely on this term.
The fundamental ellipsometric equation is conventionally written as
 , (32)
Substituting for rp and rs from Equation (3), we obtain
 (33)
(33)
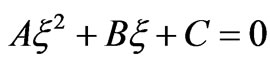
This equation can be simplified [18] to give a quadratic equation as
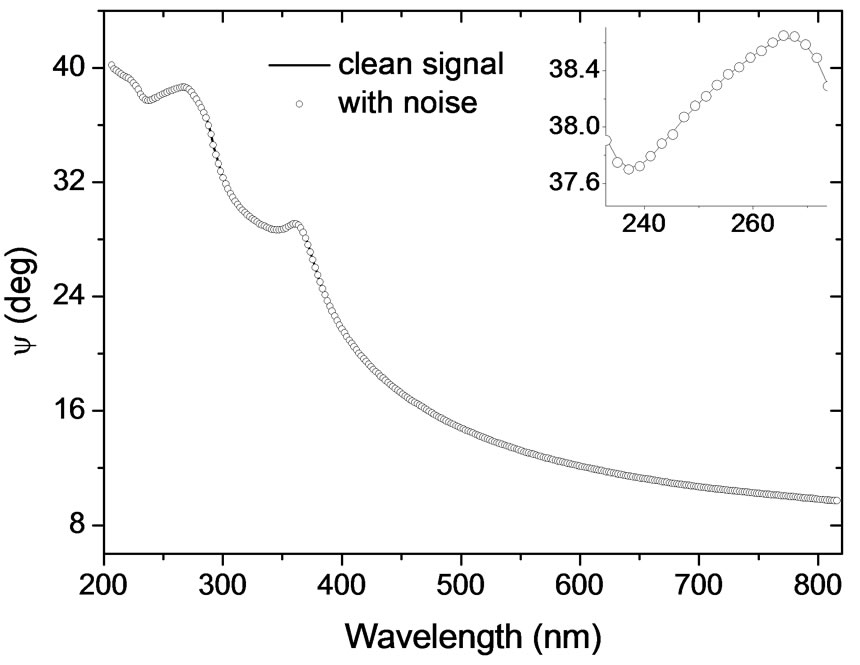
Figure 4. The ellipsometric parameter ψ as a function of the wavelength from 200 to 800 nm.
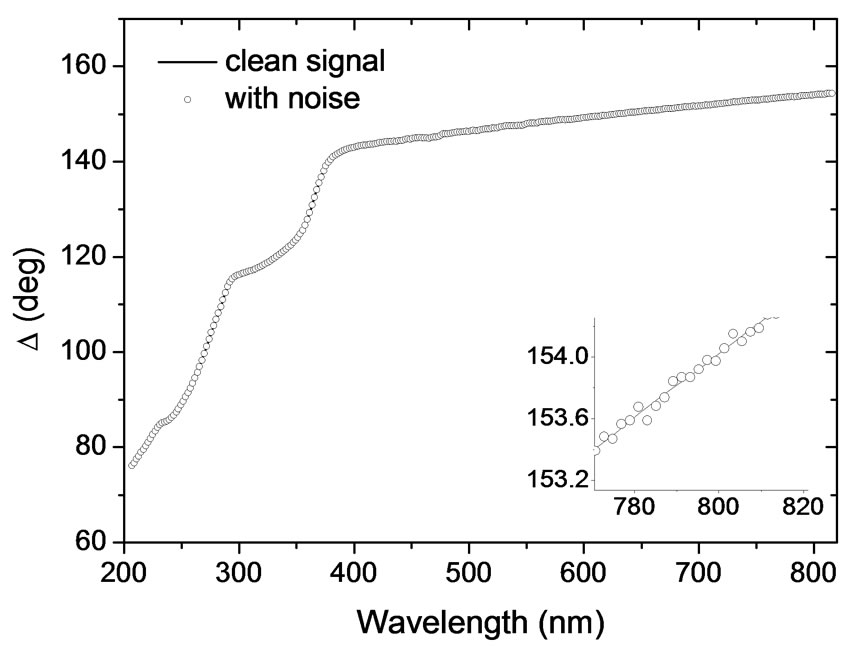
Figure 5. The ellipsometric parameter Δ as a function of the wavelength from 200 to 800 nm.

Figure 6. Percent error in ψ and Δ as a function of the wavelength. This error arises from the noise imposed on the signal.
 (34)
(34)
where
 (35)
(35)
 , (36)
 , (37)
and
 (38)
(38)
The solutions of Equation (34) have the conventional form
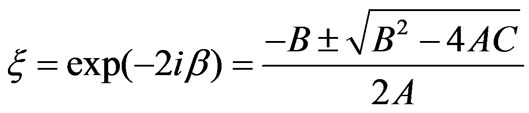 . (39)
The thickness of the SiO2 film, d, in terms of  and θ1 is
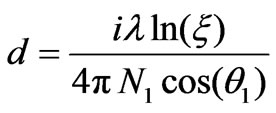 . (40)
In the considered spectrum range, SiO2 is lossless. In this case the extinction coefficient is zero, i.e. . Thus
  will be real and hence
  is pure complex. Therefore,
 . (41)
Finally, the solution is to find the value of  that makes
 . (42)
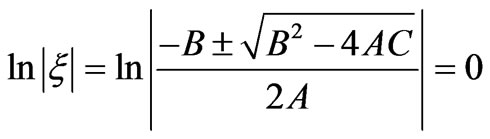
A computer program was generated using MathCAD 2000 to solve Equaton (42) and to find the refractive index of the sample. Figure 7 shows the results obtained for the refractive index of SiO2 thin film using the ellipsometric parameters ψ and Δ of the noisy signal as a function of the wavelength in the range 200 - 800 nm. The figure also shows a comparison between accepted and calculated values of the film index. The percent error in the film refractive index as a function of the wavelength is shown in Figure 8. This error arises from the noise imposed on the clean signal. The error ranges between ±1.5% which is accepted range.
The film thickness can be calculated by substituting the calculated values of the film index into Equation (40). The results obtained for the thickness are plotted in Figure 9 as a function of the wavelength. The percent error in the film thickness as a function of the wavelength is shown in Figure 10. This error arises from the noise imposed on the clean signal. The error ranges between ±1.5% which is accepted range.
It is worth to mention that the noise used all through the
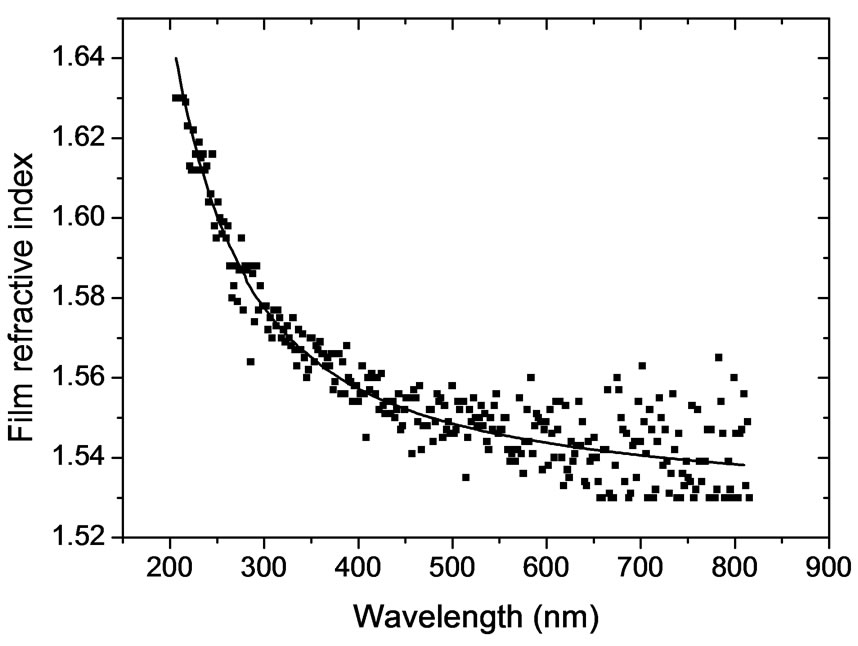
Figure 7. Refractive index of the film versus the wavelength. Line: published values; Points: calculated values with the noise.
Figure 8. Percent error in the film refractive index as a function of the wavelength.
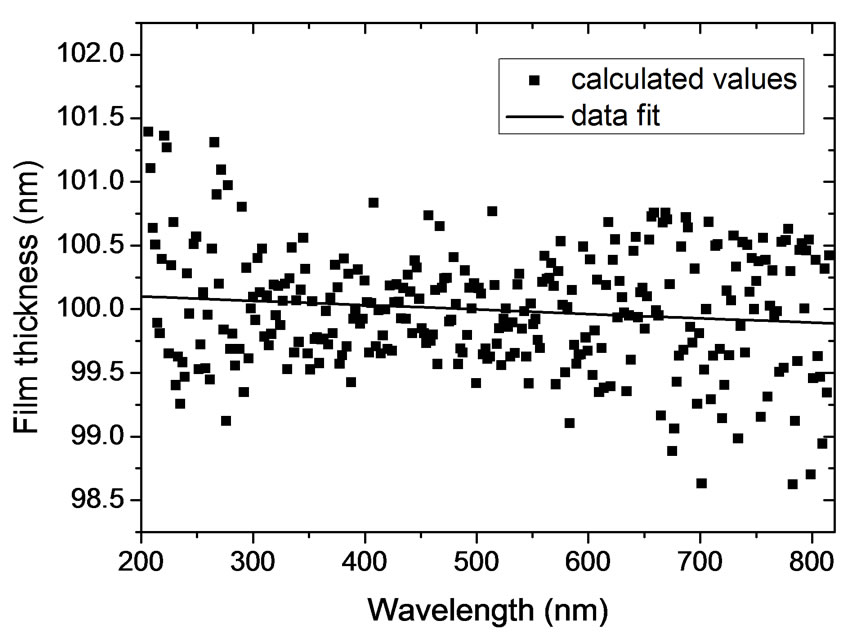
Figure 9. Film thickness obtained from simulated data with noise as a function of the wavelength.
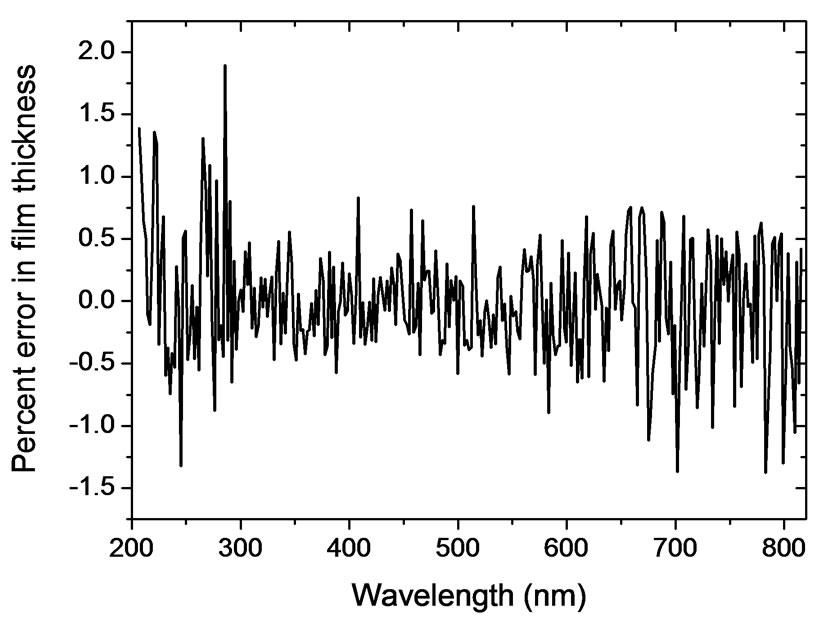
Figure 10. Percent error in the film thickness as a function of the wavelength.
above calculations is the same as presented in Figure 3. The signal to noise ratio (SNR) was calculated as the ratio of the signal mean to the standard deviation of the noise [19] and found to be 2260. In order verify that the percent error is still small enough for other kinds of imposed noises, we impose a higher signal of SNR equal to 1050. Figure 11 shows the percent error in the calculated values of ψ and Δ for the new noise. As seen from the figure the error is still in the same order of that of Figure 6.
Some sources of systematic errors are due to the azimuthal misalignment of optical elements with respect to the plane of incidence, sample mispositioning, beam deviation, and collimation errors. Wavelength and angle of incidence errors, also, contribute to systematic errors. Thus, it is necessary to invoke such error analysis in our calculations. These errors can be significantly reduced by careful alignment and calibration of the system and by choosing high quality optical components.
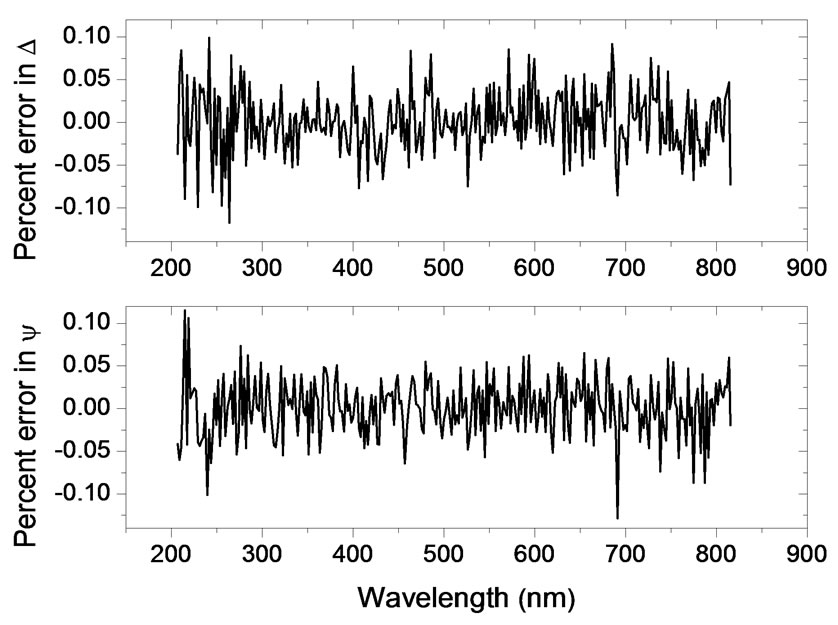
Figure 11. Percent error in ψ and Δ as a function of the wavelength in the case of a noise with SNR equal to 1050.
Thus, it is important for the verification process to have some quantities for determination of the accuracy of the simulated data as a result of misalignment of the fixed polarizer, rotating polarizer, and rotating analyzer. The parameters to be checked are the ellipsometric parameters ψ and Δ as well as the index of refraction n and the film thickness d.
Based on Equations (11)-(21), the percent error in ψ, Δ, n, and d is calculated due to the offset in the azimuths θ, τ, and δ. Figure 12 shows the percent error committed on ψ, Δ, n, and d as a function of the errors of the fixed polarizer azimuth angle θ, the rotating polarizer azimuth angle τ, and the rotating analyzer azimuth angle δ successively varied from –0.1˚ to 0.1˚ in steps of 0.01˚ while keeping the two other variables equal to zero. As can be seen from the figure, the impact of these errors on ψ, Δ, n, and d is not significant for small misalignment. The figure also reveals that the error due to misalignment of the
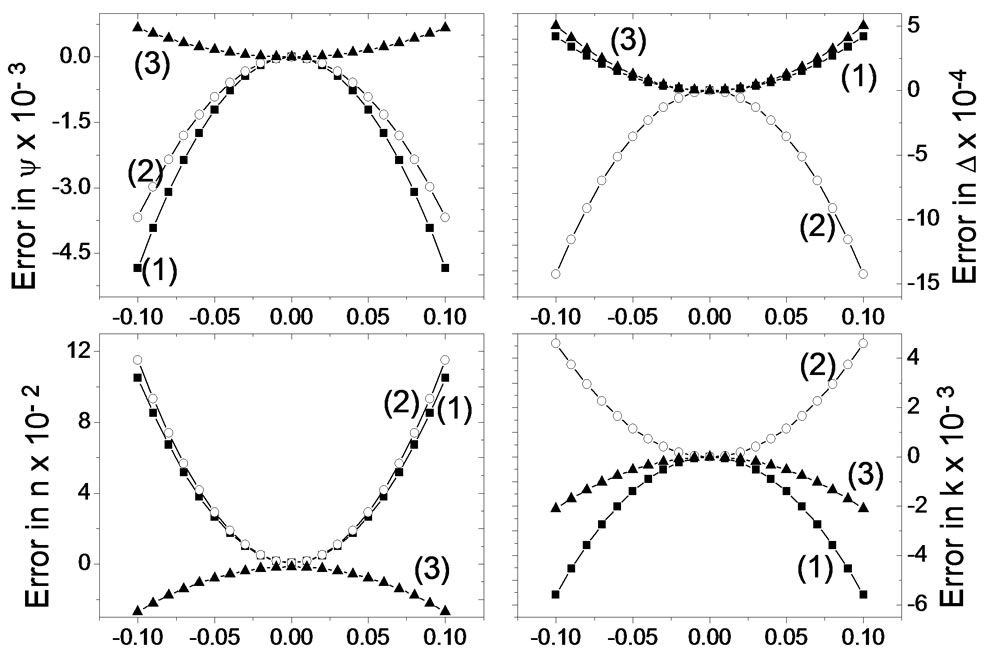
Figure 12. Percent error in ψ, Δ, n, and d, for SiO2 film at λ = 632.8 nm and θ0 = 70˚, as a function of the error in (1) θ; (2) τ; and (3) δ successively varied from –0.1˚ to 0.1˚ in steps of 0.01˚ while keeping the two other variables equal to zero.
azimuth angle δ has almost the lowest impact on the four parameters under consideration.
4. Conclusions
We have presented theoretically the characterization of 100 nm SiO2 thin film using RPAE in which the polarizer and the analyzer rotate synchronously in the same direction with a speed ratio 1:3. The film thickness and the optical constants of the film are calculated for the noisy signal in the spectrum range 200 - 800 nm. As can be seen from the results, the proposed RPAE is very accurate and the percent error in the calculated optical parameters and thickness of the film is in the accepted range. The results also show that the small misalignment of the optical elements of the structure doesn't have a significant impact on the film parameters.
REFERENCES
- Z. Liu, Y. Zhang, S. W. Kok, B. P. Ng and Y. C. Soh, “Near-Field Ellipsometry for Thin Film Characterization,” Optics Express, Vol. 18, No. 4, 2010, pp. 3298-3310. doi:10.1364/OE.18.003298
- D. Roy, “Optical Characterization of Multi-Layer Thin Films Using the Surface Plasmon Resonance Method: A Six Phase Model Based on the Kretschmann Formalism,” Optics Communications, Vol. 200, No. 1-6, 2001, pp. 119-130.
- R. M. Azzam and N. M. Bashara, “Ellipsometry and Polarized Light,” North-Holland, Amsterdam, 1977.
- G. H. Tompkins, “Handbook of Ellipsometry,” William Andrew, Heidelberg, 2005. doi:10.1007/3-540-27488-X
- B. Sun, Y. Chen, P. Zhou, C. H. Xu, Y. F. Kong, Y. X. Zheng and L. Y. Chen, “Ellipsometric Study of the Optical Properties of Silicon-Based Si:SiO2 Composite Thin Films under Different Annealing Temperatures,” The Korean Physical Society, Vol. 49, No. 95, 2006, pp. 2184-2187.
- T. W. Oates, L. Ryves and M. M. Bilek, “Dielectric Functions of a Growing Silver Film Determined Using Dynamic in Situ Spectroscopic Ellipsometry,” Optics Express, Vol. 16, No. 4, 2008, pp. 2302-2314. doi:10.1364/OE.16.002302
- D. E. Aspnes, “Fourier Transform Detection System for Rotating Analyzer Ellipsometers,” Optics Communications, Vol. 8, No. 3, 1973, pp. 222-225. doi:10.1016/0030-4018(73)90132-6
- D. E. Aspnes, “High Precision Scanning Ellipsometer,” Applied Optics, Vol. 4, No. 1, 1975, pp. 220-228.
- A. R. Zaghloul and R. M. Azzam, “Single-Element Rotating Polarizer Ellipsometer: PSI Meter,” Surface Science, Vol. 96, No. 1-3, 1980, pp. 168-173. doi:10.1016/0039-6028(80)90301-5
- L. Vina, C. Umbatch, M. Cardona and L. Vodopyanov, “Ellipsometric Studies of Electric Interband Transitions in CdxHg1–xTe,” Physical Review B, Vol. 29, No. 12, 1984, pp. 6752-6760. doi:10.1103/PhysRevB.29.6752
- L. Y. Chen and D. W. Lynch, “Scanning Ellipsometer by Rotating Polarizer and Analyzer,” Applied Optics, Vo. 26, No. 24, 1987, pp. 5221-5228.
- L. Y. Chen, X. W. Feng, Y. Su, H. Z. Ma and Y. H. Qian, “Improved Rotating Analyzer-Polarizer of Scanning Ellipsometer,” Thin Solid Films, Vol. 234, No. 1-2, 1993, pp. 385-389.
- L. Y. Chen, X. W. Feng, Y. Su, H. Z. Ma and Y. H. Qian, “Design of a Scanning Ellipsometer by Synchronous Rotation of the Polarizer and Analyzer,” Applied Optics, Vol. 33, No. 7, 1994, pp. 1299-1305. doi:10.1364/AO.33.001299
- T. M. El-Agez, A. A. El Tayyan and S. A. Taya, “Rotating Polarizer-Analyzer Scanning Ellipsometer,” Thin Solid Films, Vol. 518, No. 19, 2010, pp. 5610-5614. doi:10.1016/j.tsf.2010.04.067
- T. M. El-Agez and S. A. Taya, “A Fourier Ellipsometer by Rotating Polarizer and Analyzer at a Speed Ratio 1:1,” Journal of Sensors, Vol. 2010, 2010, Article ID: 706829. doi:10.1155/2010/706829
- T. M. El-Agez, S. A. Taya and A. A. El Tayayn, “A Novel Scanning Ellipsometer by Rotating Polarizer and Analyzer at a Speed Ratio 1:3,” International Journal of Optomechatronics, Vol. 5, No. 1, 2011, pp. 51-67. doi:10.1080/15599612.2011.559685
- E. D. Palik, “Handbook of Optical Constants of Solids,” Academic Press, San Diego, 1985.
- S. Samuel, “Ellipsometric Analyses for an Absorbing Substrate with or without an Intermediate Surface Layer,” Surface Science, Vol. 56, 1976, pp. 97-108. doi:10.1016/0039-6028(76)90437-4
- D. J. Schroeder, “Astronomical Optics,” Academic Press, San Diego, 1999.