Journal of Electromagnetic Analysis and Applications
Vol. 2 No. 11 (2010) , Article ID: 3295 , 9 pages DOI:10.4236/jemaa.2010.211081
Investigation of Power Factor Behavior in AC Railway System Based on Special Traction Transformers
![]()
Railway Engineering School, University of Science & Technology, Tehran, Iran.
Email: Mohsen.Kalantar83@gmail.com, J_Sadeghi@rail.iust.ac.ir, {Fazel, Farshad}@iust.ac.ir
Received August 20th, 2010; revised September 25th, 2010; accepted September 28th, 2010.
Keywords: Power Factor, Traction Transformer, Unbalance Loading
ABSTRACT
The Single-phase traction load has essentially an unbalance characteristic at the Point of Common Coupling (PCC), which injects harmonic into the utility grid. In this paper, the effect of harmonic distortion and unbalance loading are investigated simultaneously for electrical railway systems. Special traction transformers (i.e. Single-phase, V/V, Wye-Delta, Scott, and Le Blanc) are used between the utility grid and the traction load. For analysis, different definitions of power factors are considered, which are presented by IEEE Std.1459. The detailed simulation study is made with MATLAB/SIMULINK program to represent the impacts of harmonic components and unbalance loading on the power factor behavior in the electrical railway systems.
1. Introduction
Recent technological advances have been made with respect to serious problems (e.g. population growth continuously, environmental pollution, energy shortages, and inadequate transportation capacity) in existing railway systems. Nowadays, due to many advantages such as big transport capacity, energy-saving, and environment-friendly electrified railway system is considered as a proper substitution for the obsolete and diesel systems.
The Single-phase electric supply of electrified railway is provided via Single-phase or three-phase traction substations. The electric locomotives are basically considered Single-phase loads in which the load conditions and speeds alter during every short span of time. Besides, non-linearity, asymmetrical, and non-sinusoidal are other characteristics of such Single-phase loads. This results in an unbalance and harmonic load to the utility grid more than before. Special traction transformers (e.g. V/V, Wye-Delta, Le-Blanc, and Scott) are usually applied to feed the traction loads and therefore, to reduce the unbalance problem.
The best connection of transformer for a particular utility grid is selected based on different electrical parameters and physical conditions such as primary cost, maintenance condition, necessary reservation in utility grid, the effects of harmonic and negative sequence on the utility grid and power factor value in power system.
Harmonic and negative sequence components of voltage and current viewed from PCC have been evaluated in several papers [1-5]. However, the power factor has not been analyzed focused sufficiently in the electrical railway systems as a power quality index.
In order to determine the power factor behavior at PCC, four definitions are presented by IEEE Standard 1459-2000 [6]. “Chang Ping” and his colleagues have studied the effects of harmonic distortion and unbalance loads on the different power factor definitions in railway systems regarding the following assumptions [7].
1) The Electrical Railway load is taken as a RL one and the harmonic components values are injected arbitrary amplitude and separately.
2) They have studied separately the effects of harmonic distortion and unbalance loads on the power factor behavior for three transformer connections (i.e. V/V, Scott and Le Blanc).
3) In the harmonic analysis, only the harmonic components 3, 5 with the same and unreal values are considered.
4) In analyzing the power factor behavior, leading states are considered. However such cases occur seldom in the electrical railway systems.
The aforementioned assumptions are not able to express the exact nature of the electrical railway systems. Therefore, this paper is aimed at evaluating the power factor behaviors of the utility grid in various terms of unbalance positions and harmonic distortion, using the real load model [8]. Finally to calculate the power factors in different conditions of the electrical railway systems, a suitable definition is introduced for aforementioned special transformer connections.
2. Power Factor Definitions
One of the significant indexes in defining the power quality of the utility grid is the load power factor and the feeding system. Power factor is generally determined by a specific definition considering balance loading without harmonics on the load side of substation. However, in practice the power factor is affected by harmonic distortion and also unbalance loading.
Several power factor definitions are presented to apply the effects of non-sinusoidal and unbalanced conditions in electrical railways. In this part, calculating methods for the power factor is presented [6]. The impacts of the harmonics and unbalance loading are simulated and studied in Section 5.
The active power is composed of the fundamental and harmonic components. These components are defined as bellow respectively:
 (1)
(1)
 (2)
(2)
 (3)
(3)
The reactive power is composed of the fundamental and harmonic components too. These components are defined as bellow respectively:
 (4)
(4)
 (5)
(5)
 (6)
(6)
Distortion Power (DB) is defined based on Budeanu’s rule and it is calculated via the following equation:
 (7)
(7)
As a result, per phase apparent power is defined as:
 (8)
(8)
 (9)
(9)
 (10)
(10)
Then, arithmetic apparent power (SA) and power factor (PFA) are calculated based on the aforementioned equations:
 (11)
(11)
 (12)
(12)
 (13)
(13)
Obviously, SA is the direct sum of three Single-phase apparent powers, so that it cannot completely demonstrate the effects of load unbalance.
If the active, reactive and distortion powers are considered individually from each other, vector apparent power (SV) and apparent power factor (PFV) are defined as:
 (14)
(14)
 (15)
(15)
where
 (16)
(16)
 (17)
(17)
 (18)
(18)
Figure 1 shows the difference between SA and SV.
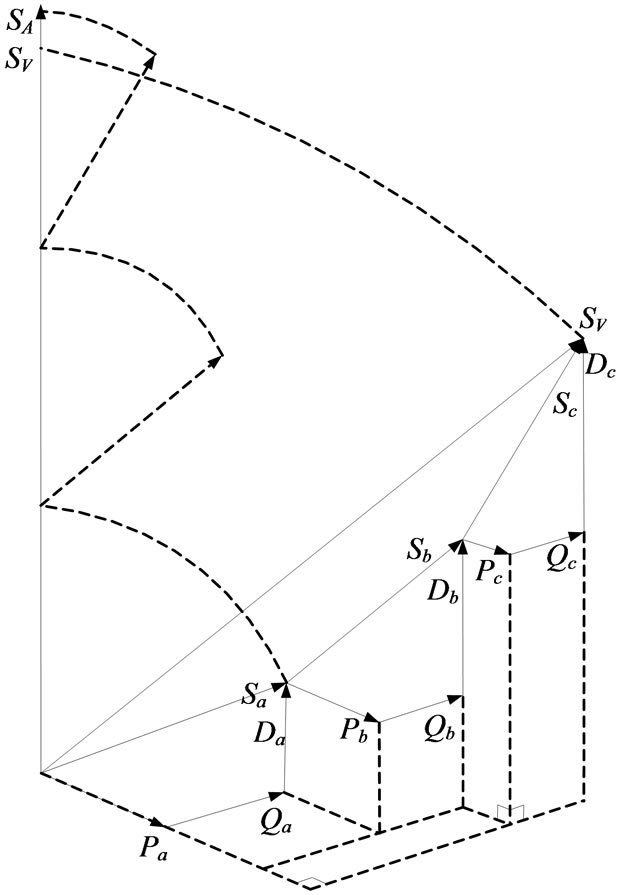
Figure 1. Arithmetic (SA) and Vector (SV) apparent powers, unbalanced non-sinusoidal conditions.
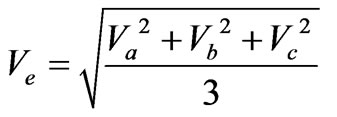
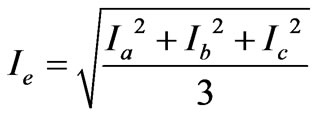
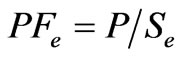
The effective apparent power (Se) and effective power factor (PFe) of the three-phase is calculated through the following equations:
 (19)
(19)
 (20)
(20)
 (21)
(21)
where
 (22)
(22)
The effective apparent power has been introduced to determine the power-line losses caused by unbalanced loads [9].
In order to evaluate the loading characteristic of the Electrical Railway, it is necessary to introduce a suitable power factor definition among PFe, PFA and PFV. Finally, fundamental power factor is defined as:
 (23)
(23)
where
 (24)
(24)
 (25)
(25)
This definition is based on only fundamental component and therefore, harmonic distortion can not affect on its value.
3. Traction Transformer
Specially connected transformers such as Single-phase, V/V, Wye-Delta, Scott, and Le-Blanc transformers are used to convert a three-phase supply into one or two Single-phase supplies. These transformers are commonly used in the electro locomotive traction systems. In all equations, K=N1/N2 is defined as no-load turn ratio.
3.1. Single-Phase Connection The Single-phase traction transformer configuration is shown in Figure 2. For a Single-phase traction transformer, there is only one terminal at the secondary side. This type of connection causes the worst unbalance loading condition in Electrical Railway system.
When power supply is provided through AB phases, the current and voltage relationships between primary and secondary of the Single-phase transformer are:
 (26)
(26)
 (27)
(27)
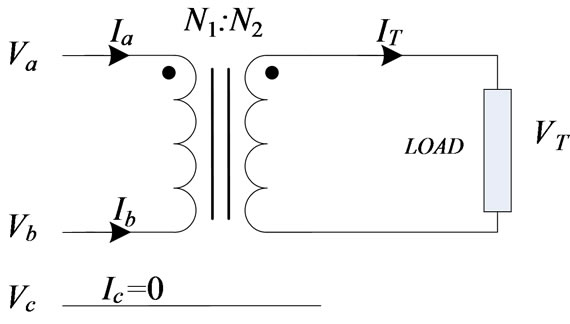
Figure 2. Single-phase connection [10].
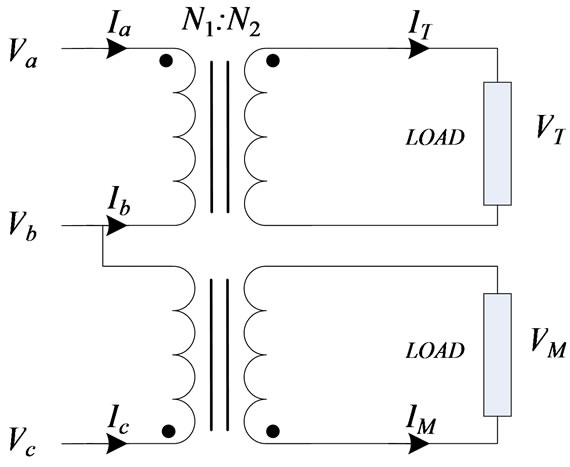
Figure 3. V/V connection [10].
 (28)
(28)
 (29)
(29)
3.2. V/V Traction Connection
The configuration of V/V traction transformer is shown in Figure 3. It is composed of two Single-phase transformers which fed by two phase voltages (i.e. AB and CB) and the current and voltage relationships are as below:
 (30)
(30)
 (31)
(31)
 (32)
(32)
 (33)
(33)
 (34)
(34)
 (35)
(35)
3.3. Wye-Delta Connection
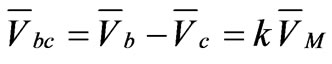
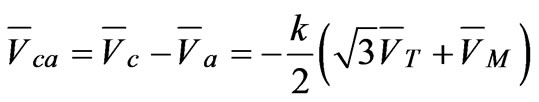
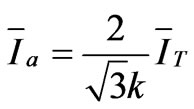
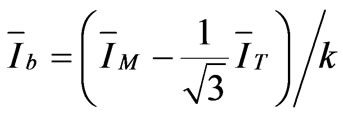
The Wye-Delta transformer, another specially connected transformer consisting of three two-winding transformers is used in electric railways. The current and voltage relationships obtained from Figure 4 are as follows:
 (36)
(36)
 (37)
(37)
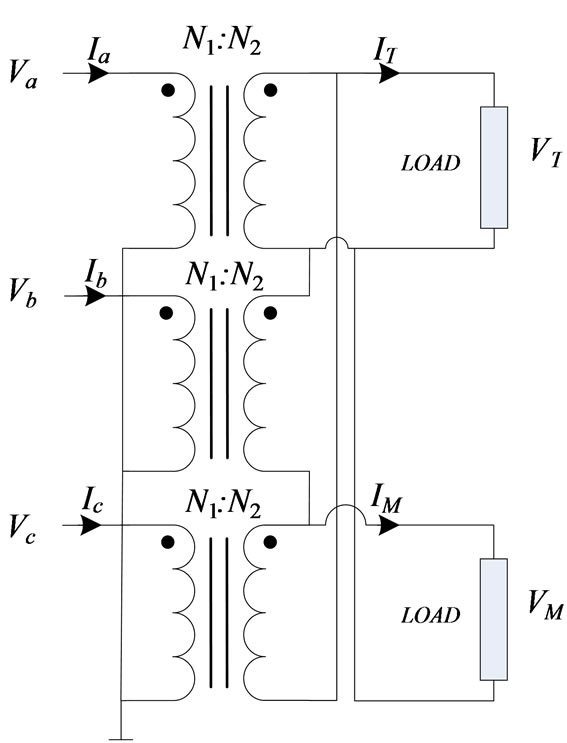
Figure 4.Wye-Delta connection [11].
 (38)
(38)
 (39)
(39)
 (40)
(40)
 (41)
(41)
3.4. Scott Connection
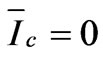
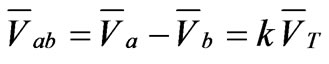
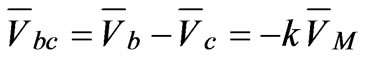
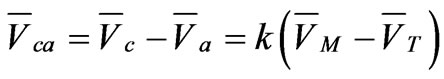
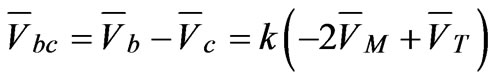
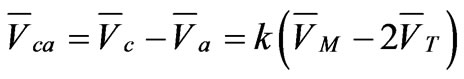
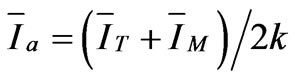
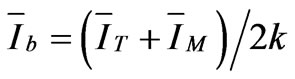
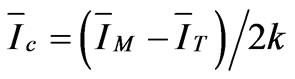
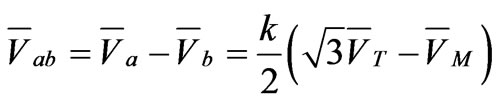
The Scott traction transformer consists of two Single-phase transformers, M and T, and its diagram circuit is demonstrated in Figure 5. This connection transforms threephase to a two-phase supply and therefore, it can be reduced the degree of voltage imbalance caused by Single-phase traction loads. The magnitudes of the voltage at the secondary sides are equal but the phase angle of T transformer is 90° in lead of M. The current and voltage relationships of the Scott transformer are calculated as follows:
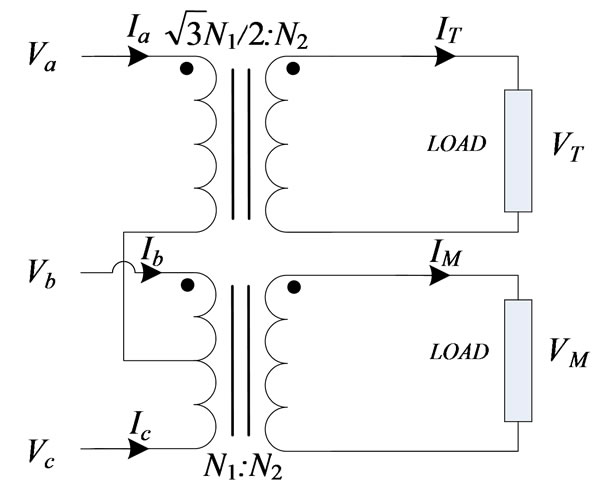
Figure 5. Scott connection [10].
 (42)
(42)
 (43)
(43)
 (44)
(44)
 (45)
(45)
 (46)
(46)
 (47)
(47)
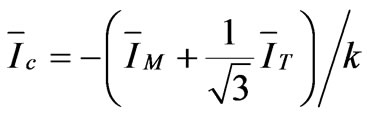
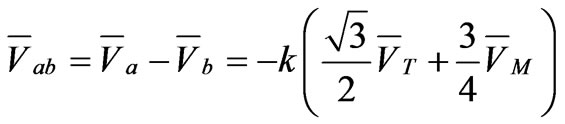
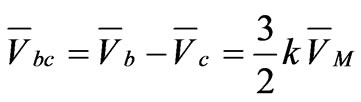
3.5. Le Blanc Bonnection
The winding of the primary side of Le Blanc transformer is designed in a delta (∆) connection form and on the secondary side, two windings (T and M) are used which contain unbalanced structure as shown in Figure 6. This connection transforms three-phase to a two-phase supply similar to the Scott connection and therefore, it can be also reduced the degree of voltage imbalance caused by Single-phase traction loads. The current and voltage relationships of the primary and secondary of the Le Blanc transformer are as follows:
 (48)
(48)
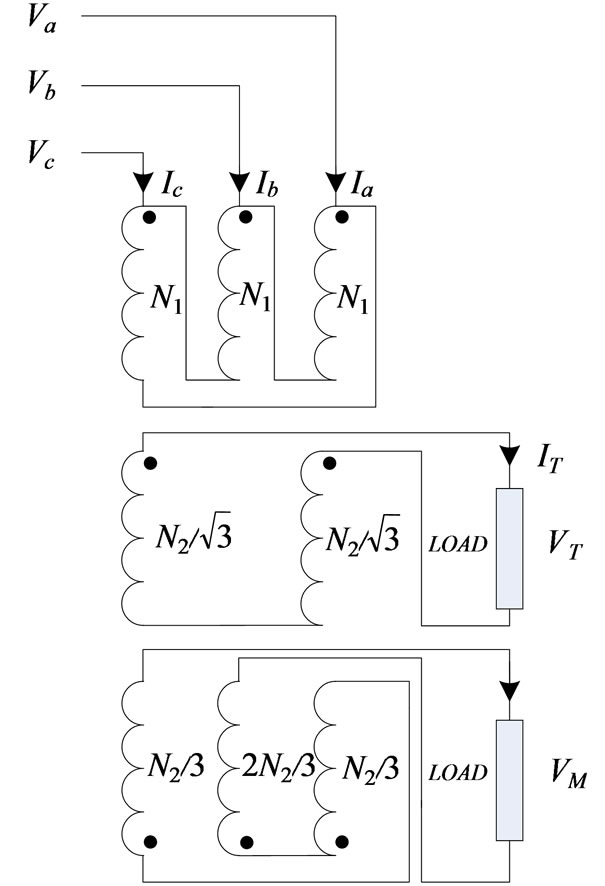
Figure 6. Le Blanc connection [10].
 (49)
(49)
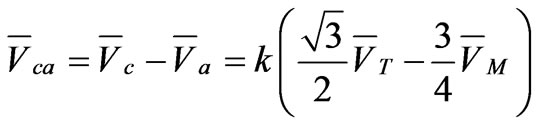 (50)
(50)
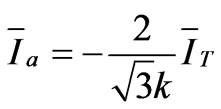 (51)
(51)
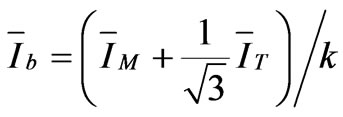 (52)
(52)
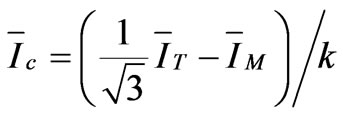 (53)
(53)
4. Traction Load
To consider the effects of the harmonics on the utility grid, a 2.5-MW thyristor rectifier locomotive (rated at 25 KV) are assumed [8]. It is modeled as two half-controlled thyristor bridge rectifiers in series as shown in Figure 7. Transformer ratio is 1:0.5:0.5. All locomotives parameters are converted to a 25 KV base.
When two or more such locomotives are running together hauling a single train, they are assumed to have identical firing angles. This assumption allows two locomotives to be modeled as a single locomotive of double or manifold the real size, which is easily obtained for example by halving the inductances, and doubling the capacitance and also doubling the load current. Figure 8 shows the traction load current and its harmonics spectrum. This simulation results represent that the odd harmonic order of the traction load current compared to even one as an expected.
5. Simulation Result
This section analyses the calculated results for different power factor definitions which stem from network simulation. Regarding the different functions of various transformers, this investigation is performed in four cases considering various connections. Furthermore, the power factor behavior is also taken in to account and simulated based on unbalance index from zero to 100 percent. The simulated network block diagram is considered according to Figure 9.
In this diagram, the traction loading type and applied connection transformers affect remarkably on the calculation results.
To compare the results, five types of transformers with the same turn ratio are utilized in the block of traction transformer. In load block, the real load model of the Electrical Railway is assumed which was utterly described in the previous part. Note that the necessary input data is shown in Table 1.
Figure 7. DC traction load [8].
Figure 8. Traction load current and its harmonic order.
Figure 9.Simulated block diagram.
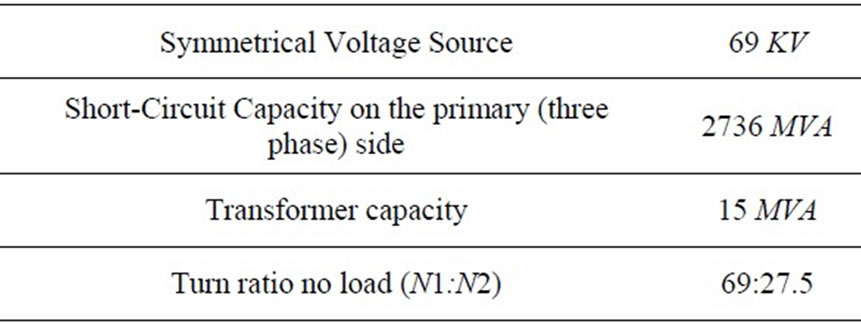
Table 1. The necessary input data
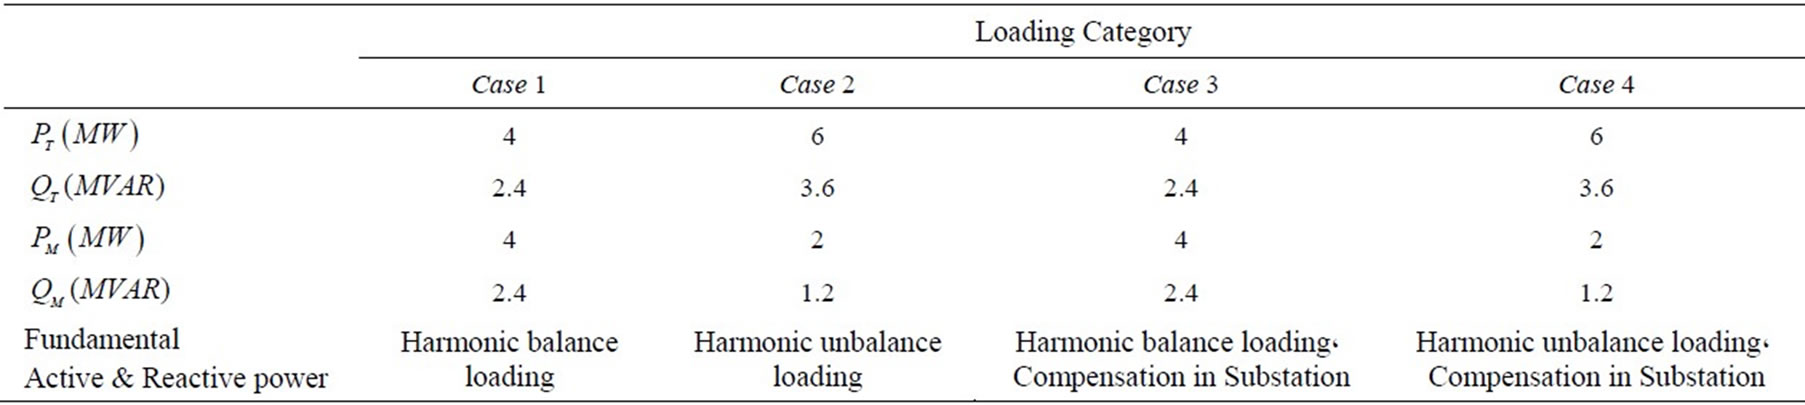
Table 2. Load condition
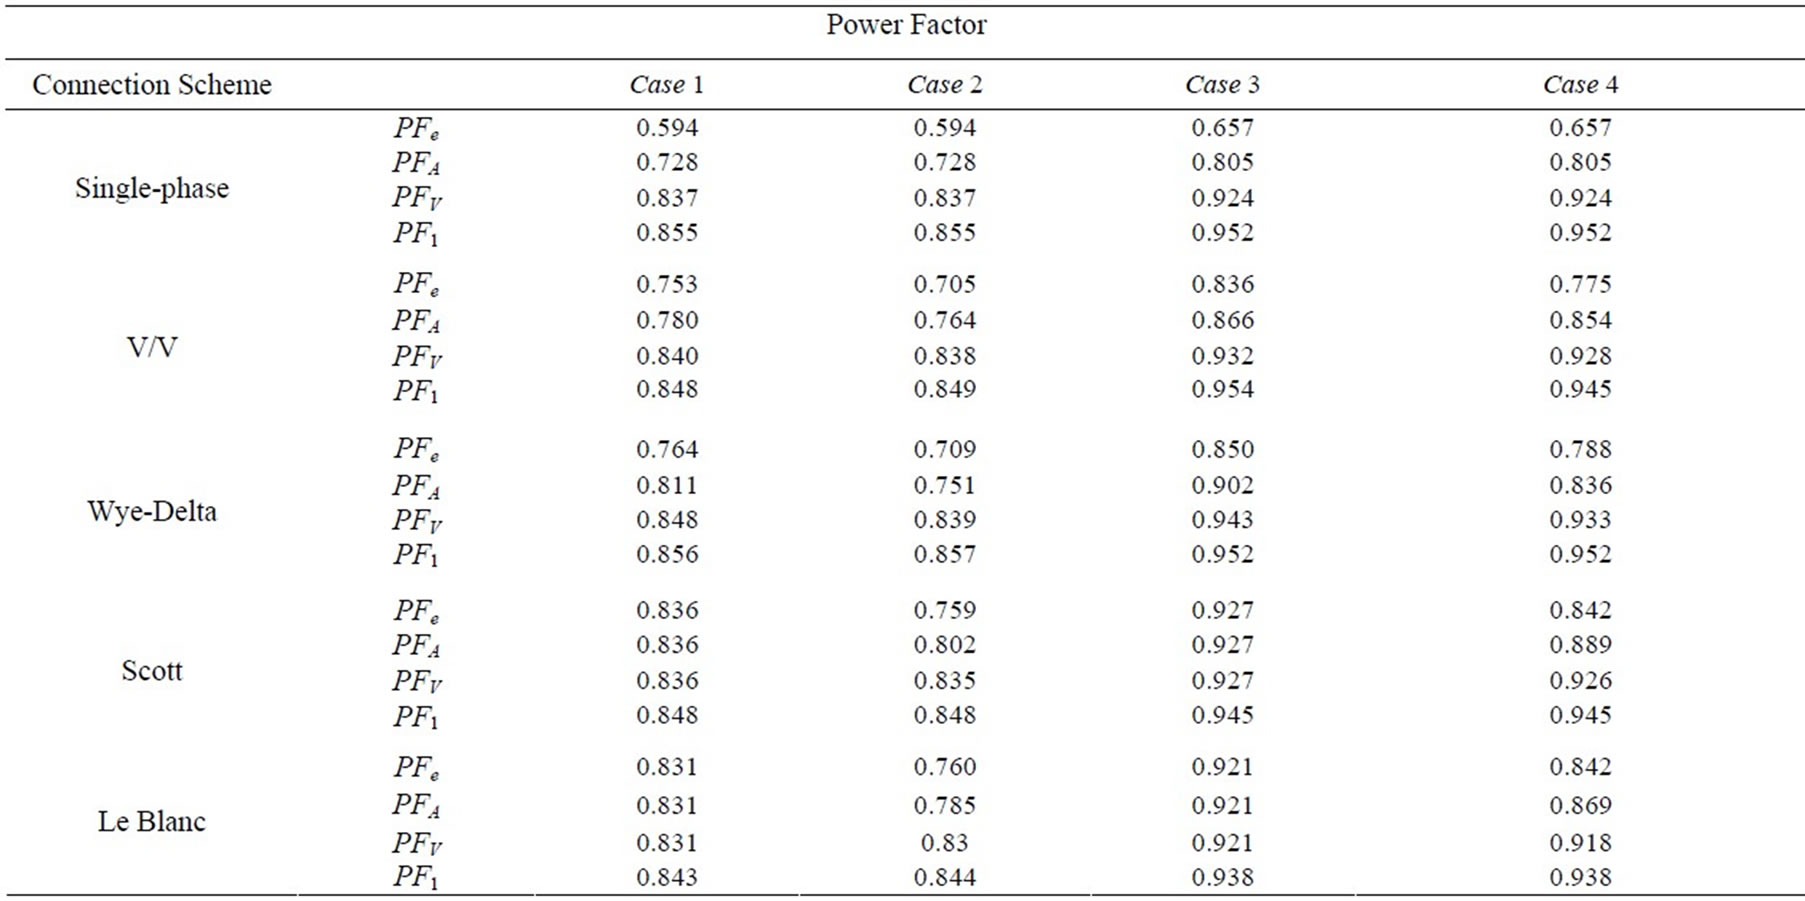
Table 3. Simulation results
Table 2 illustrates the load conditions for four analyzing cases. Case 1 shows the balanced load at the both secondary sides of substation. In practice, it should be noted that the load balancing in secondary side (two-phase) is not the same in primary side (three-phase). In addition, practically due to moving of train, these two loads are not equated and they are seldom balanced. This imbalance is elaborated in the case 2.
Since the thyristor converter is used as a traction load model for the mentioned cases, the amount of power factors are low ranged (from 0.59 to 0.86, refer to table 3). Therefore, for improving the power factor values practically, some methodology such as compensation in the utility grid, GTO converter, and IGBT converter are taken into account. Cases 1 and 2 are listed in Table 2 after improving the power factors by compensation method in terms of cases 3 and 4. Power factor values in the primary (three-phase) side of the traction substation are shown as a simulation results in Table 3. These results are categorized as following:
1) Case 1
• The three phase sides of Scott and Le Blanc connections are balanced and therefore, the calculated power factors of PFe, PFA and PFV for theses two connections in case 1 are equal while the power factor value of PF1 shows a slight difference compared with these factors due to load harmonics distortion.
• In Single-phase, V/V and Wye-Delta connections, the power factor values are different from each other and are not the same. This characteristic represents the undesired effects of unbalance loading, resultant from asymmetrical structure of these connections on the power factor results.
• In electrified railway systems, the ratio of the negative sequence current to the positive one is higher than the usual power utility grid. This fact leads to considerable difference between the power factor values. The comparison of simulation results between the power factor values of the Single-phase, V/V, and Wye-Delta connections indicate that the higher disparity between power factor values in Single-phase connection compared to V/V and Wye-Delta connections.
• Similar to Scott and Le Blanc connections, there is slight disparity between PFV and PF1 in Single-phase, V/V and Wye-Delta connections. In other words, load harmonics have not considerably effective on the power factor values.
2) Case 2
Case 2 analyses the effects of harmonic distortion and unbalance loading on the power factor values. Here the unbalance index (UI) which is defined in the following section (refer to Equation (54)), is almost 50%. Simulation results demonstrate the following:
• Due to unbalance loading, the power factor values are different in all connections. Since Scott and Le Blanc connections are formed by a more balanced structure, the disparity of power factor values of these connections are lower than the similar values in Single-phase, V/V and Wye-Delta connections. In the Single-phase connection this difference is remarkable and more observable compared to other than because they contain the most unbalanced position.
• Considering the fixed summation amount of powers in Single-phase connection, simulation results in cases 1 and case 2 are equal.
3) Case 3 and Case 4
The main goal of simulating the cases 3 and 4 is to study and analyses compensated power factor manner. Analyzing the simulation results show that:
• An improvement in the power factor values during compensation causes reduction of power factor disparity. However, the unbalance loading still have a great impact on the calculation results. If imbalance loading is increased, the disparity is intensified accordingly.
The results of analyzing the four aforementioned cases show that, the rate of unbalancing in the utility grid is the most significant and effective parameter on the power factor trend. It should be noted that this imbalance utility grid are due to the imbalance loading and also different transformer configurations.
Therefore, in order to calculate the effects of unbalance loading on the utility power factor in various connections, the load summation must be considered to be fixed. So assuming the equal initial loading on both sides of traction substation that is PT = PM = 6 MW & QT = QM = 3.6 MVAR. The effects of complete balance loading (two similar load on both sides), and the complete unbalance loading (only one load on one side of the traction substation) on the utility grid are investigated for various connections.
The unbalance index is defined as follow:
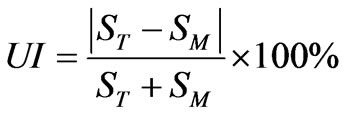 (54)
(54)
Figure 10 illustrates the simulation results in terms of changing unbalance index from zero (complete balance loading) to 100 percent (complete unbalance loading) with fixed summation loads in various connections. As observed in this figure:
• In all connections, PFV and PF1 behaviors are almost independent of unbalance loading and have fixed trends.
• PFe and PFA behaviors are both depend on unbalance loading and unbalanced transformer structures. So, when unbalance index is more than 20%, these power factors trend starts to change in Scott and Le Blanc transformers, despite of their balanced treat in railway systems.
• In 100% unbalance index (which the injection negative sequence current in to the utility grid have a similar trends in all connections [3]), it is observed that PFe power factor in various connections leads to almost the same amount namely 0.6. The reference [7] has introduced PFe power factor as the load specification index which can reveal the unbalance loading impacts in the utility grid clearly. However, PFe power factor is subject to unbalance loading and also different components of the active, reactive and distortion powers. Then, the unbalance loading impact on the value of PFe is not clear exactly.
• On the other hand, it is worth noting that the main function of the power factor is to clarify various power components relations with each other. Although, the utility imbalance is determined regarding the other indexes such as negative sequence components.
Therefore, it can be observed that utilizing power factor definition PFV is suitable for traction applications due to the effects of harmonics distortion and unbalance loading in the utility grid. This definition not changes and has a fixed trend versus unbalance index.
• The value of PF1 including only the fundamental components and the harmonic distortion is disregarded. So, there is slight disparity between PFV and PF1. Subsequently, when PFV calculation is difficult or impossible, PF1 can be calculated as a proper approximation instead of PFV in all unbalanced situation.

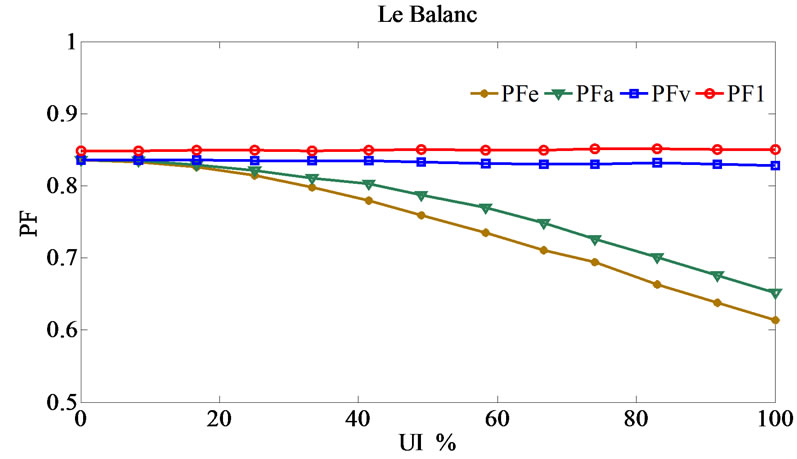
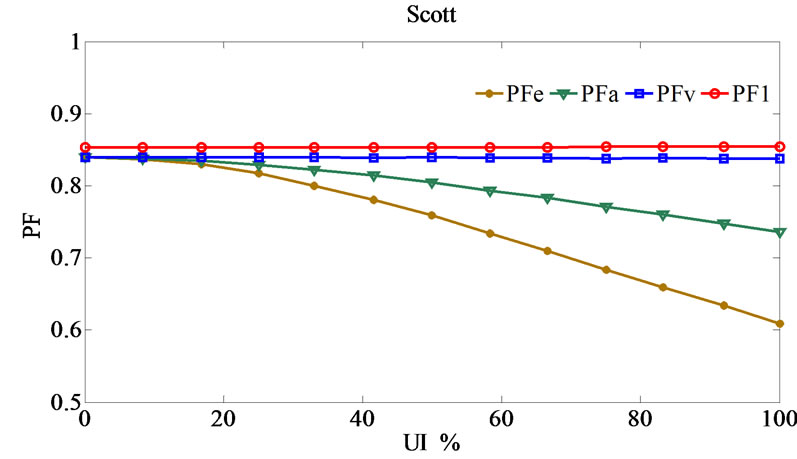
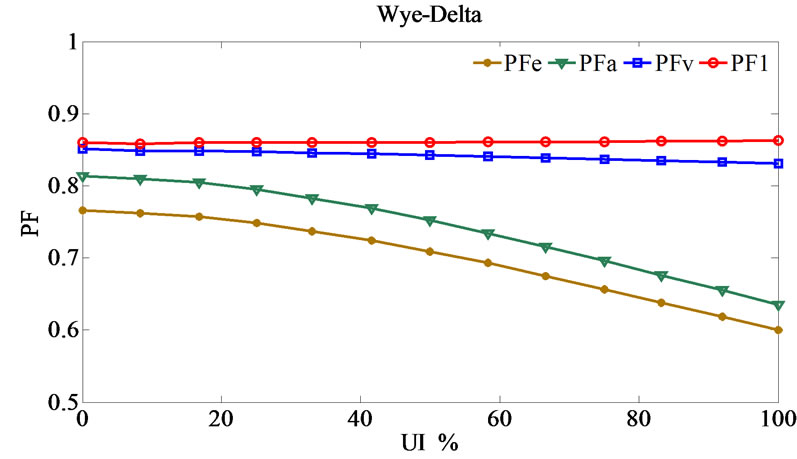
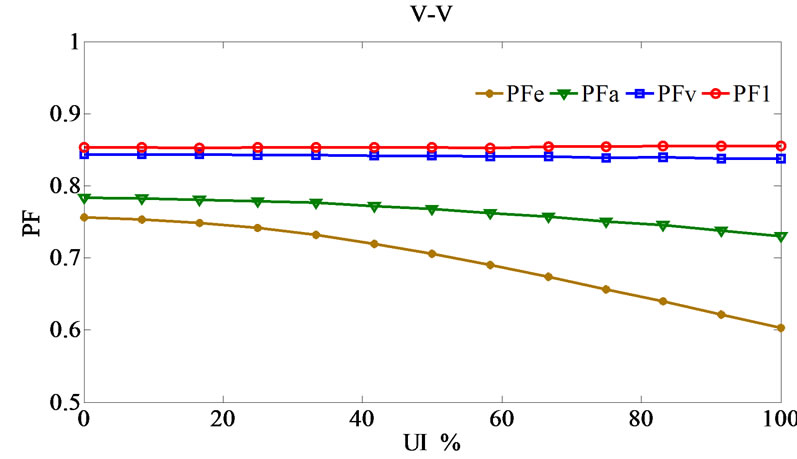
Figure 10. Power factor values versus UI.
6. Conclusions
In this paper, the detailed characteristic of the power factor behavior has been simulated and analyzed. To evaluate the power factor behavior for a variety of applications, five special traction transformers (i.e. Singlephase, V/V, Wye-Delta, Scott, and Le Blanc) have been compared in detail, and its effects on the utility grid have been investigated. Simulation results are different due to the unbalance loading and asymmetry in transformer structures.
Using the Single-phase transformer culminates in the most trouble unbalance circumstances. Within the scope of three phase transformers, the V/V and Wye-Delta impose undesired imbalances on the utility grid com-pared to other connections. Having changed unbalance index from zero (complete balance state) to 100 percent, the PFe and PFA are considerably affected assuming fixed active and reactive powers, while more stability is observed in PFV and PF1 definitions and they demonstrate less failure subject to asymmetric loading in both sides of traction substation.
Consequently, PFV power factor is the most efficient utility due to better stability and covering harmonic effects in comparison with other power factors as discussed in last section. It is worth nothing that, PF1 can be suitable substitutions for PFV, when its calculation is impossible or challenging.
REFERENCES
- H. E. Mazin and W. Xu, “An Investigation on the Effectiveness of Scott Transformer on Harmonic Reduction,” Proceedings of IEEE Power Engineering Society Meeting-Conversation and Delivery of Electrical Energy in the 21st Century, Pittsburgh, 2008, pp. 1-4.
- M. L. Deng, G. N. Wu, X. Y. Zhang, C. L. Fan, C. H. He and Q. Ye, “The Simulation Analysis of Harmonics and Negative Sequence with Scott Wiring Transformer,” International Conference on Condition Monitoring and Diagnosis, Beijing, 2008, pp. 21-24.
- H. Q. Wang, Y. J Tian and Q. C. Gui “Evaluation of Negative Sequence Current Injecting into the Public Grid from Different Traction Substation in Electrical Railways,” International Conference on Electricity Distribution, Prague, 8-11 June 2009, pp. 1-4.
- H. E. Mazin and W. Xu, “Harmonic Cancellation Characteristics of Specially Connected Transformers,” Electric Power Systems Research, Vol. 79, No. 12, 2009, pp. 1689-1697.
- S. R. Huang and B. N. Chen, “Harmonic Study of Le Blanc Transformer for Taiwan Railway Electrification System,” Proceedings of IEEE Power Engineering Society Winter Meeting, Taichung, 23-27 January 2000, pp. 2245-2250.
- IEEE, “IEEE Trial-Use Standard Definitions for the Measurement of Electric Power Quantities under Sinusoidal, Non-sinusoidal, Balanced, or Unbalanced Conditions,” IEEE Standard, 2000, pp. 1-44.
- C. P. Huang, C. J. Wu, Y. S. Chuang, S. K. Peng, J. L. Yen and M. H. Han, “Loading Characteristics Analysis of Specially Connected Transformers Using Various Power Factor Definitions,” IEEE Transactions on Power Delivery, Vol. 21, No. 3, 2006, pp. 1406-1413.
- P. C. Tan, R. E. Morrison and D. G. Holmes, “Voltage form Factor Control and Reactive Power Compensation in a 25-kV Electrified Railway System Using a Shunt Active Filter Based on Voltage Detection,” IEEE Transaction on Industry Application, Vol. 39, No. 2, 2003, pp. 575-581.
- A. E. Emanuel, “Apparent Power Definitions for Three-Phase Systems,” IEEE Transactions on Power Delivery, Vol. 14, No. 3, July 1999, pp. 767-772.
- S. L. Chen, R. J. Li and P. H. His, “Traction System Unbalance Problem-Analysis Methodologies,” IEEE Transaction on Power Delivery, Vol. 19, No. 4, 2004, pp. 1877-1883.
- W. S. Chu, J. C. Gu, B. K .Chen, and S. Y. Lee, “ New Criteria for Estimating Voltage Unbalance Due to Specially Connected Transformers in High Speed Railway Systems,” International Journal of Emerging Electric Power Systems, Vol.4, No. 1, 2005, p. 1064.