Int'l J. of Communications, Network and System Sciences
Vol.7 No.7(2014), Article ID:48117,11 pages
DOI:10.4236/ijcns.2014.77023
Analysis of Cognitive Radio Enabled Flooding in Opportunistic Networks
Muhammad Arshad Islam1, Marcel Waldvogel2
1Department of Computer Science, Mohammad Ali Jinnah University, Islamabad, Pakistan
2Computer Science Department, University of Konstanz, Konstanz, Germany
Email: arshad.islam@jinnah.edu.pk, marcel.waldvogel@uni-konstanz.de
Copyright © 2014 by authors and Scientific Research Publishing Inc.
This work is licensed under the Creative Commons Attribution International License (CC BY).
http://creativecommons.org/licenses/by/4.0/


Received 30 March 2014; revised 30 April 2014; accepted 20 May 2014
ABSTRACT
Epidemic routing (Flooding) is considered as a simple routing protocol for opportunistic networks where the participants attempt to transmit whatever information they have to everyone who does not already have that information. However, it is plagued with disadvantages of resource scarcity as it exerts stress on available bandwidth as well as storage capacity of the devices in the network. Cognitive radio (CR) is one of the emerging technologies that can improve the bandwidth utilization by smart allocation of spectrum radio bands. Ideally speaking, a spectrum-aware cognitive radio is able to sense the local spectrum usage and adapt its own radio parameters accordingly. In this study, we have performed experiments to analyze the gains achieved by flooding protocol using cognitive radios of varying capabilities in opportunistic networks. We have performed experiments on three opportunistic networks obtained from real-life traces from different environments and presented results showing variance in delivery efficiency as well as cost incurred on those scenarios. Our results show that performance of flooding can be significantly improved using CRs in bandwidth-scarce environments; however, the improvement is not uniform with the increase in a number of available bands.
Keywords: Opportunistic Networks, Delay Tolerant Networks, Flooding, Cognitive Radio, Simulation

1. Introduction
Since the introduction of Delay Tolerant Networks in research horizon for interplanetary communication [1] , several offshoots have spawned e.g. Vehicular Networks, Mobile Social Networks and Opportunistic Networks. Correspondingly, several practical applications such as emergency response in case of a catastrophe, military operations and non-interactive Internet access in rural areas [2] have accumulated the usability of such networks. The challenges involved in opportunistic network routing are totally different from the traditional wired networks. We cannot only design and plan the structure of wired networks, but in case part of a network fails, we receive real-time information about the route changes in the network. On the other hand, opportunistic networks (as the name suggests) cannot be designed or planned. They are implicitly created and evolve due to wireless devices that come into each other’s radio range. These wireless devices then behave as data mules as well as routers. They make routing decisions to bring the messages to their respective destinations based on the local knowledge that they have obtained earlier from the network.
We have observed that several efforts have been attempted and many are still underway to develop an optimized routing protocol for Opportunistic Networks. Depending on how the mobile nodes move and what characteristic node posses, how dense the node population is, and how far sender and receiver are apart and furthermore how big the messages are, message delivery times may vary substantially from a few minutes to many hours or days. In other words, communication performance in such scenarios depends not only on the routing and forwarding algorithms in use but also on the topological structure of the network.
Various schemes that employ multiple antennas at the transmitter and receiver are being considered to improve the range and performance of communication systems. Cognitive radio networks (CRNs) are an emerging multi-hop wireless networking technology where nodes are able to change their transmission or reception parameters based on interaction with the environment in which they operate [3] . It has been reported in [4] that many spectrum bands allocated through static assignment policies are used only in bounded geographical areas or over limited periods of time, and that the average utilization of such bands varies between 15% and 85%. This capability opens up the possibility of designing flexible and dynamic spectrum access strategies with the purpose of opportunistically reusing portions of the spectrum [5] . Cognitive radio provides the capability, to sense a wide spectrum range, to dynamically identify currently unused spectrum blocks for data communications, and to intelligently access the unoccupied spectrum called Spectrum Opportunities (SOP) [6] .
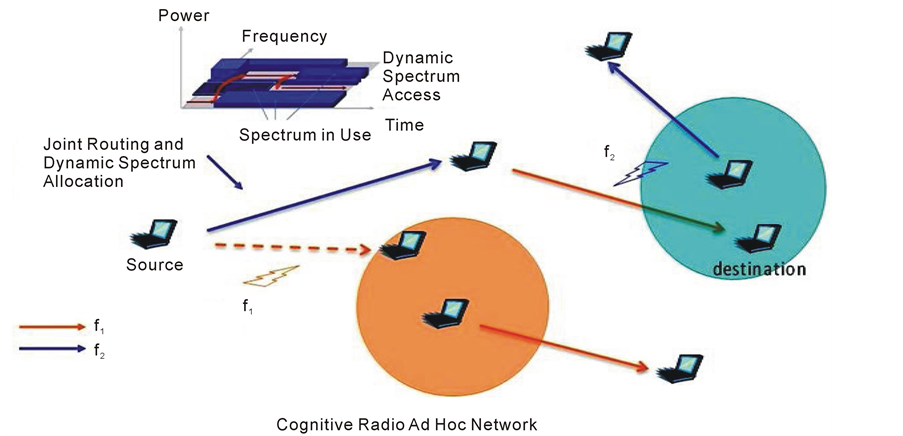
Mostly efforts have been concentrated on single-hop scenarios in cognitive networks while tackling physical layer and/or Medium Access Control (MAC) layer issues [8] [9] . Only very recently, the research community has started realizing the potentials of multi-hop CRNs, which can open up new and unexplored service possibilities enabling a wide range of pervasive communication applications [5] . Routing problem in cognitive radio networks has similarities with routing in multi-band, multi-hop ad-hoc networks, but with the additional challenge of having to deal with the dynamic behavior of the nodes. In fact, spectrum occupancy is location-dependent, and therefore in a multi-hop path scenario, available spectrum bands may be different at each relay node as shown in Figure 1. Hence, in multi-hop cognitive radio networks controlling the interaction between the routing and the spectrum management functionalities is of fundamental importance [7] .
As most of the opportunistic networks are established via wireless medium, we are interested to see the performance of flooding protocol using CRNs systems in opportunistic network environment. In flooding protocol, every node attempts to replicate its contents whenever there is an opportunity, therefore it is interesting for us to analyze how far flooding can gain in a CRN supported system. Although there have been a few practical deployments of opportunistic networks [10] [11] , simulation is the favorite tool assisting us in analyzing opportunistic networks with several variations, e.g. movement of devices, variable bandwidth, obstacles, environmental effects etc. In a real world scenario, where repetition of events is very unlikely, scientists apply simulations techniques on data that are either created artificially or are obtained from a real word phenomenon. Irrespective of whether the simulation incorporates real life traces or an artificially generated network for such asynchronous path scenario, almost everyone is benchmarking his/her results against the flooding protocol.
2. Related Work
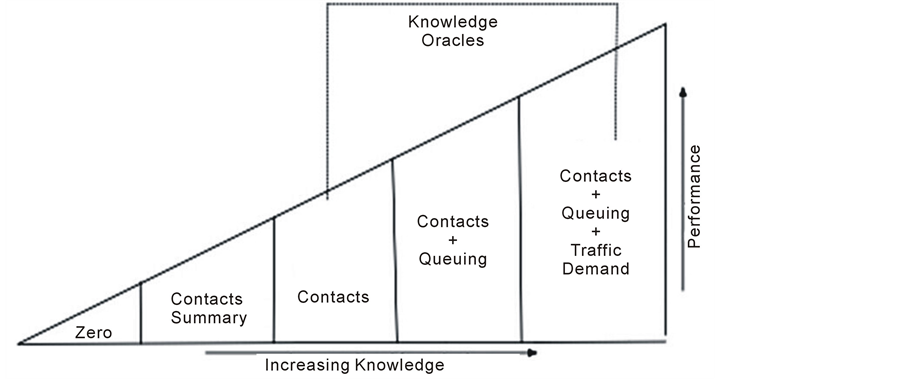
Opportunistic networks can be seen as good examples of distributed systems [12] , which can be simulated and analyzed with the help of oracles that have the capability of delivering different kinds of network measures without delay, throughout the network. Mechanisms that provide information to predict the device and traffic behavior, and which are difficult or impossible to gather in realistic scenarios, are known as oracles [13] . Provided that the information is accurate, strategies can make very efficient use of network resources by forwarding a flow along the best path. Jain, Fall and Patra [13] have presented classification of several oracles based on the extent of information they can deliver. As depicted in the Figure 2, a zero knowledge protocol could be one that forwards the messages randomly or to whomever receives it first. The contact summary gives insight into the past contact frequencies and the more frequent contacts receive priority over the others. The most complicated oracle is the one that can predict the exact timings of contacts, volume of traffic in local queue of devices, and traffic demand. One can safely assume that the higher the accuracy, the less likely it is to actually construct such an oracle in the real world. The information that is necessary for making intelligent routing decisions, and which can be constructed in the real world, lies between the two extremes, the zero knowledge of network and the full knowledge of timings of node contacts with future traffic demand.
Flooding is described as epidemic protocol where every node exchanges its messages with every other node in its range [14] . This way, every node in the network may end up having every messages from the whole network, irrespective of that the point that whether the message was destined for it or not. This strategy obviously puts a lot of strain on the local storage capacity of mobile nodes as well as bandwidth of the network but does provide connectivity even under the most challenging situations, as long as the network eventually becomes connected. Though it is notorious for excessive overhead, Islam and Waldvogel [15] have shown that epidemic routing is the only solution that may provide reasonable performance in the case of sparse opportunistic networks.
The reason being that contact patterns in such networks are so irregular that any kind of profile based routing has a very little chance of delivering the message to destination. On the other hand, work in [16] has questioned the motivation for using flooding as a performance benchmark for routing protocols even when the induced overhead is ignored.
The researchers have favorably considered CRNs in infrastructure-less wireless networks. Pefkianakis et al. have presented a routing protocol SAMER [17] for wireless Mesh networks that opportunistically routes traffic across paths with higher spectrum availability and quality while maintaining a balance between long-term route stability and short-term opportunistic performance. Abdelaziz and Elnainay [18] have described the challenges that should be considered for different types of networks starting by the Wireless Local Area Networks (WLANs) and ending with the Cognitive Radio Networks (CRNs). They have categorized CR based routing protocols into four groups on the basis of delay, throughput, link stability and location. Urgaonkar, and Neely [19] have proposed opportunistic scheduling policies for cognitive radio networks that maximize the throughput utility. They use the techniques of adaptive queuing and Lyapunov Optimization to design an online flow control, scheduling and resource allocation algorithm for a cognitive network that maximizes the throughput utility of the secondary users subject to a maximum rate of collisions with the primary users. End to end path cannot be guaranteed in infrastructure-less environment, Khalife et al. [20] has proposed a routing technique based on probabilistically estimating the available capacity of every band over every CR-to-CR link, while taking into account the primary radio.
3. Simulation and Trace Setup
3.1. Simulator
The motivation behind the simulator is to help us find the delays incurred by messages and overhead suffered by networks during execution of different routing algorithms. The output is analyzed on the basis of both numbers of messages as well as amount of data delivered. As already mentioned, three different traces have been used that significantly differ in the number of nodes involved, number, frequency, and distinctness of meetings that were taking place among the participants. For the purpose of this simulation, nodes connected to the same access point or the same cell tower is considered to be close enough physically to directly exchange messages with each other. IBM traces come out to be a sparsely connected network and MIT Cell Tower, a dense network, as the range of access points is smaller than that of cell towers. We have created 100 messages for the simulation with different sizes. The smallest size is 1600 Bytes where as the largest message size is 1.6E7 Bytes. We have followed power law to assign the sizes in this range; i.e. many small messages and a few huge messages. The messages are generated and random time intervals between the 10th and the 20th day of the trace period. The peripheral simulation parameters are summarized in Table1
3.2. Trace Description
We have considered three different kinds of data sets, all of which have been obtained from CRAWDAD. The motivation behind choosing these three traces has been to have a broad spectrum between dense and sparse networks. Two of the data sets have been synthesized from reality mining project [21] from MIT spans on 16 months i.e. February 2004 to August 2005 whereas; the third data consist of the SNMP logs for one month from an IBM campus [22] . As the duration span of MIT reality mining is longer than IBM trace, we have filtered the MIT data to match the time span of IBM traces.
The sparse network is obtained from Bluetooth logs of MIT traces where each node scans every five minutes for active Bluetooth neighbors and stored the duration of contact times. For the sake of comparison with other traces and simplicity, we limit ourselves to one month of connectivity trace, where any visible Bluetooth device was considered a candidate connection. Reduction of the trace time span has been done on the basis of connectivity times i.e., one month where nodes have maximum connectivity in terms of time duration. The highest connectivity period i.e. November 2004 showed 1858 Bluetooth nodes suggesting a huge number of undesignated nodes as compared to the designated1 81 nodes that were designated to gather the data. It is here noteworthy that a few undesignated devices had more connectivity and interaction with the network than the designated nodes.

Table1 Simulation parameters.
In the case of IBM Access Point trace, SNMP is used to poll Access Points (AP) every 5 minutes, from July 20, 2002 through August 17, 2002. A total of 1366 devices have been polled over 172 different access points during approximately 4 weeks. We have extracted the traces of 928 devices after discovering existence of 3 clusters in this network and then choosing the biggest cluster with respect to node count. To turn these samples into continuous data, we assume that the snapshot data remains constant for the next 5 minutes. In the rare cases where this would cause an overlap with another snapshot from another access point, we assume that the transition happens halfway between the two snapshots. We assume that two nodes that are connected to one access point during overlapping time period are connected to each other. Thus, key features of such a network are low mobility and medium transmission range.
The third trace, MIT Cell Tower, is used according to the similar principal as that of IBM traces. The only difference being, instead of access points, cell towers are used to gather the contact times of the nodes with each other, thus the resulting network can be characterized as a very dense network due to high range of cell tower. Due to several lapses in data gathering, mentioned by the creators of the data, only 89 of 100 devices are included, which visit 32,768 different cell towers. Similarly to Bluetooth traces, November 2004 turns out to be the maximum activity month with 81 devices and 12,592 distinct cell towers.
4. Flooding
The most effective DTN routing protocol is flooding or epidemic flooding. In this scheme, messages are simply copied to any node that is reachable and does not already have a copy of the message. Each node forwards all the non-duplicated messages (including messages received on behalf of other nodes) to any other node that it encounters. As new nodes become reachable due to mobility or other reasons, additional copies are made. Flooding has the potential to deliver messages with the minimum delay if there are no resource constraints, such as link bandwidth or node storage [14] [23] [24] . The normal perception of such protocol is that they are generally deemed to be too expensive for practical use, although, they have been used for small networks [25] . In our implementation, flooding avoids transmitting a message to a device that already has a copy (shown by non-arrowed links in Figure 3) using the have/send me model.
Several techniques have been proposed to keep a check on the overheads (bandwidth, storage, security) caused by flooding [26] -[29] . Most of them do discount flooding due to buffer space and/or bandwidth issues [27] [30] [31] but no one has contested the fact that flooding has the capability of delivering the message in a timely manner. Small et al. [29] examine a number of different strategies to suppress redundant transmissions and clean up valuable buffer space after a message has been delivered with epidemic routing. One can introduce a timer associated with every epidemic message after which the node gets “cured” and the message is deleted from the network [26] . It is a reasonable assumption that a particular message can be valid for some time period. After the time period is elapsed, the message is not useful or valid and can be removed easing the flooding overhead to some extent. Zhang et al. [28] describe a system that forwards a message to another node with some probability smaller than one (i.e. data is “gossiped” rather than flooded). Other techniques used to control flooding include limiting the number of copies a node may forward; the time interval node must wait before retransmitting and number of hops a message may cover [26] . Probabilistic flooding restricts the ratio of replicas (also known as willingness to retransmit) by assigning probabilities to the hops that are eligible for having the copy of a particular message. The Retransmission Wait can be utilized to restrict replica creation where a node
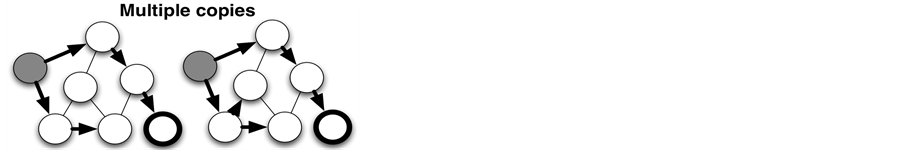
Figure 3. Graphical description of flooding.
waits for a particular interval before attempting to retransmit the message. Times-to-send is the number of times a node successfully forwards a message to other nodes in the network before it stops forwarding the message. The source node includes the value of these parameters as part of the message header. This way, the forwarder nodes can set their willingness levels accordingly [26] .
Some techniques attempt to gather global network knowledge to control the drawbacks of flooding. Directed Flooding, floods or forwards the replica of messages toward only the destination [32] . This means, Directed Flooding is supposed to have a prior knowledge about the network to estimate the direction of the destination. As the geographical location of devices is meaningless in opportunistic networks, Directed Flooding expects devices to advertise those devices that they and their contacts have encountered. This sharing of information is transitive in nature; therefore a message will be forwarded only to those peers that have a direct or indirect access to the final destination of the message. Provided an un-partitioned opportunistic network and appropriate time period, a device will have the knowledge about every other device in the network. An advance version of Directed Flooding is referred to as Nile, that forwards the messages on relatively disjoint path.
Flooding in Cognitive Radio Networks
The rate of information dissipation in a wireless network depends on the geographical density of the devices. The rate of message replication during the flooding routing in a low-density network is small. This rate increases with the increase in device density in the network however; it is limited as the availability of communication bands is reduced with the increasing device density in the bounded geographical area. As discussed in section 2 devices may dynamically share the available communication bands supported by cognitive radios, therefore our motivation is to analyze the performance gain when flooding is employed in CRNs.
In traditional flooding simulations, when two devices are engaged in communication, none of them can start communicating with the third device until the current transmission is complete, or one of the devices breaks the communication by moving away from the radio range of the other device. In our simulations, a device in CRNs can conduct multiple transmissions (can create multiple replicas) simultaneously in flooding protocol. In the experiments performed here, a device can engage itself in multiple transactions with different devices simultaneously, however the number of such devices are limited due to the number of available bands. We have performed multiple experiments, each representing the maximum number of bands that devices in one geographic location can utilize. We assume that devices that are connected to one base station (either access point or cell tower) share the one pool of bands available to them and two devices connected to two different base stations may use one band simultaneously. Each device attempts to replicate those messages that its neighboring devices still do not have, while consuming the resources however, we ignore the stress caused by the meta information exchange on bandwidth or local storage.
5. Results and Discussion
We categorize the figures presented in this section into four classes. The four kinds of figures show 1) number of messages delivered at destination, 2) volume of messages delivered at destination, 3) amount of storage space consumed in the network, 4) amount of bandwidth consumed at the Y-axis. The X-axis of all four classes of results, represent the amount of time elapsed since the message creation of each message. Each figure contains multiple plots representing the above-mentioned quantities while utilizing different number of available communication bands in a CRN environment.
5.1. Number of Messages
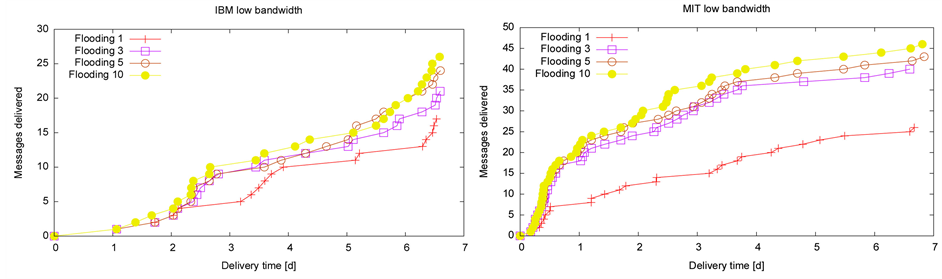
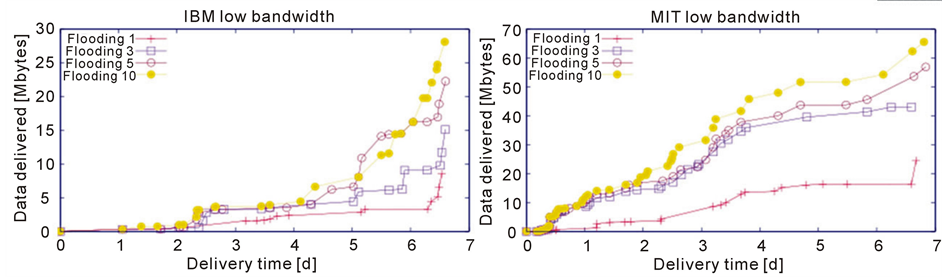
When we look at the number of messages delivered in all the traces with low bandwidth in Figure 4, we observe
 (a) (b)
Figure 4. No of messages in low bandwidth scenario (a) IBM; (b) MIT.
that the increase in the number of available bands facilitates the bigger number of messages to be delivered in the defined same span of time. However, the increase in number of messages delivered is not uniform as the number of available bands increases. In the case of IBM trace Figure 4(a), 5 extra messages are delivered when we increase the number of available bands from 1 to 3 however, 2 extra messages are delivered when we increase the available bands from 3 to 5. This shows that the increase in number of bands may not always significantly improve the delivery ratio.
A close look at the results of MIT trace Figure 4(b) shows us a significant jump in delivery ratio when the number of available bands has increased from 1 to 3. The primary reason for this significant improvement is the nature of the trace. MIT trace is constituted of mostly frequent short duration meeting among the subjects. The meetings are not only frequent but also the size of the meeting (number of people participating in the meeting) is also more than that of IBM trace. These characteristics make the MIT network relatively dense and flooding has been able to take advantage of this dense scenario using the multiple communication bands.
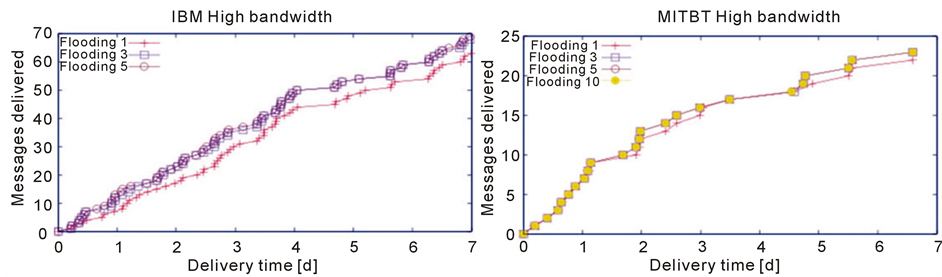
Considering the scenario of high bandwidth shown in Figure 5(a) for IBM and Figure 5(b) for MITBT for both flooding protocol has not been able to capitalize on the resources available in the form of more than 1 communication bands. We see minimal improvement between the plots for 1 and 5 communication bands. The reason being that the transmission time of the messages are so small with high bandwidth that improvement brought by the availability of extra bands is insignificant.
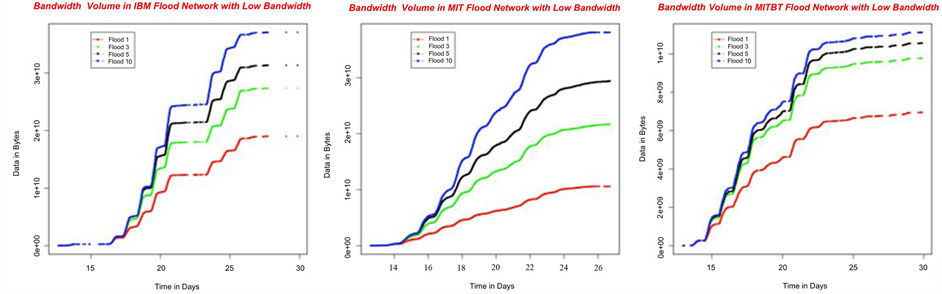
5.2. Data Volume
When we look from the perspective of amount of data, we observe a somewhat different story as shown in Figure 6(a) for IBM and Figure 6(b) for MIT. Though we see generally an improvement with increase in the number of communication bands as shown in Figure 6(a), the pattern is not as uniform as observed in the previous section. Flooding has delivered almost same amount of data irrespective of availability of multiple bands during the period of first four days. We can observe slight improvement for the later period showing that availability of multiple bands helps propagation of smaller size messages in medium dense network like IBM trace. In the case of MIT trace as shown in Figure 6(b), the cognitive radios have made their impact and flooding has enjoyed better performance with the increase of multiple bands.
5.3. Network Storage Consumed
The figures presented in this section refer to the amount of data volume generated during the propagation of the 100 messages. All the plots are bell shaped showing the minimum data volume in the start as well as in the end. The storage volume increases as the replicas are created irrespective they are successfully delivered to the destination. As discussed earlier in section 3, the messages have a lifetime so the data volume is bound to reduce to zero because the messages are either consumed by the respective sinks after successful delivery or killed once their lifetime expires.
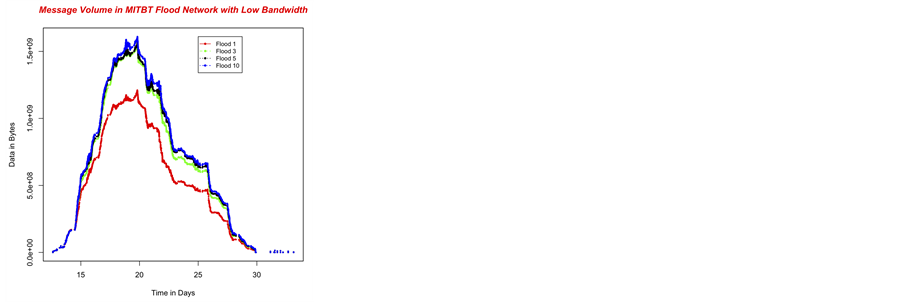
When we have a look at the low bandwidth scenario as shown in Figure 7(a) for IBM, Figure 7(b) for MIT and Figure 7(c) for MITBT, we can see that the network faces maximum storage consumption around ca. 10 days
 (a) (b)
Figure 5. No of messages in high bandwidth scenario (a) IBM; (b) MIT.
 (a) (b)
Figure 6. No of messages in high bandwidth scenario (a) IBM; (b) MITBT.
 (a)
(a)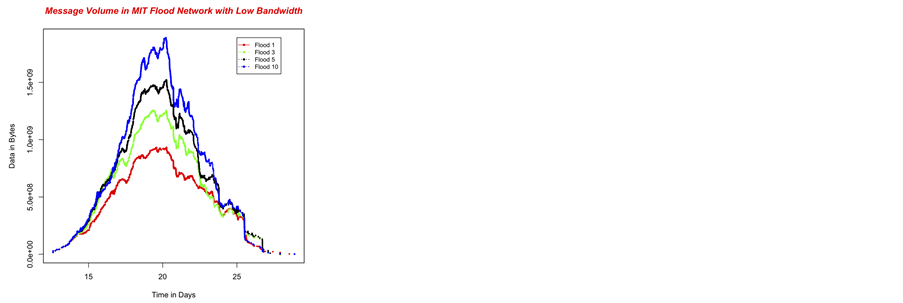 (b)
(b)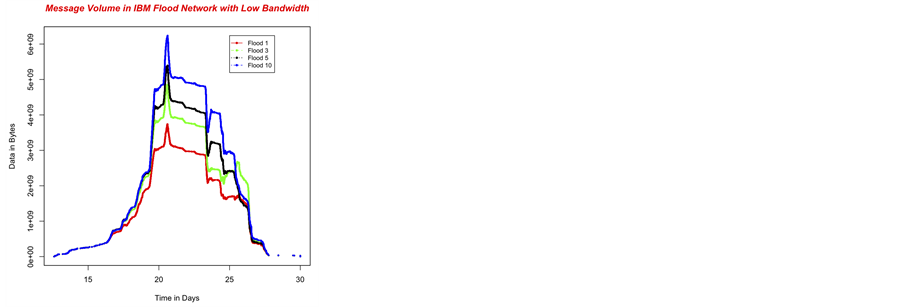 (c)
(c)
Figure 7. Storage consumed in low bandwidth scenario IBM (a); MIT (b); MITBT (c).
into the trace period. Moreover, the variation in volume generated with respect to utilizing different number of bands somewhat relates to variation in their respective performance. This relationship shows the dependence of flooding to the number of replica it can generate. The variation in the network storage utilized with 1 and 3 bands is equally significant than the variation encountered with 5 and 10 bands. The Bluetooth case shows somewhat different but principally the same behavior as shown in Figure 7(c).
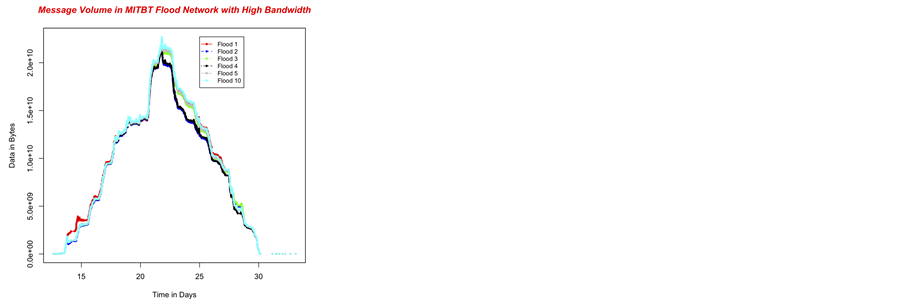
When we consider the case of high bandwidth as shown in Figure 8(a) and Figure 8(c), the variation caused due to the different number of bands is negligible so as the variation in the performance as shown previously. There is a peculiar period of 2 days around the 20th trace day showing that flooding with 1 band has generated
 (a)
(a)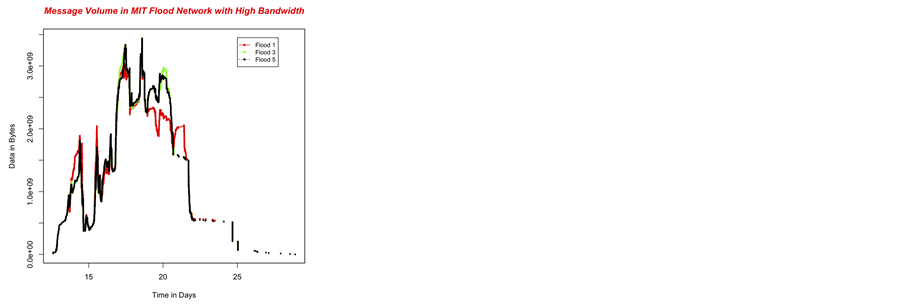 (b)
(b)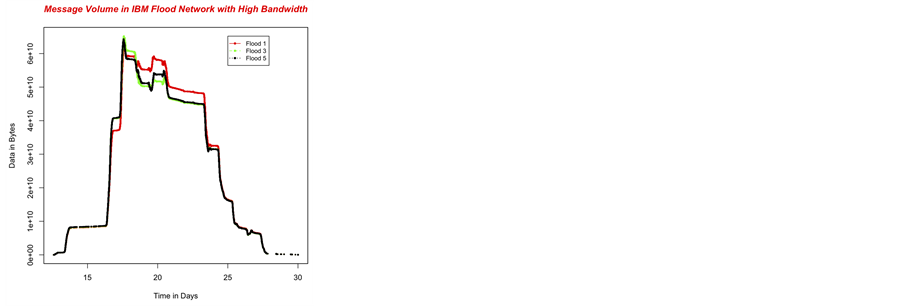 (c)
(c)
Figure 8. Storage consumed in high bandwidth scenario IBM (a); MIT (b); MITBT (c).
 (a) (b) (c)
Figure 9. Bandwidth consumed in low bandwidth scenario IBM (a); MIT (b); MITBT (c).
fewer replicas than replicas generated for 3 and 5 bands. This shows that an opportunistic network with abundant bandwidth resources may also be handicapped to create replicas when device count at one location at one time may cross the threshold of that network.
Another interesting behavior that we observe in the Figure 8(b) is that flooding with 1 band has created more replicas that flooding with 3 and 5 bands around 22nd trace day. The reason behind this behavior is that devices share the information about delivered messages. Whenever a device receives information about the successful delivery of a message, it destroys the replicas it posses for that message and starts forwarding this information from that point onwards to other devices that come in contact. Flooding with high number of bands have delivered a few messages relatively earlier than simple flooding therefore the replicas of those messages are destroyed and corresponding network storage is recovered. All the plots for the high bandwidth case showed similar behavior therefore we have shown one of them belonging to MIT trace to represent all the traces.
5.4. Network Storage Consumed
In this section, we analyze the effects of varying the number of bands during flooding propagation on the bandwidth consumed by the whole network. All the plots presented here are increasing in nature with the increasing bandwidth consumption with each replica creation. We present here two results of bandwidth consumption in the low bandwidth scenario in Figure 9(a) and Figure 9(b). The behavior of plots in the both the figures is understandable with more bandwidth being consumed with increasing number of available communication bands. We observe peculiar steps in plots of the IBM trace shown in Figure 9(a) that are absent in the MIT trace shown in Figure 9(b). These discrete steps in the plots of IBM trace represent the pattern of bandwidth consumption. As IBM trace is gathered from office environment therefore there is not network activity during the late hours depicted by flat line segments however, MIT trace is gathered from personal mobile phones that are usually active round the clock, thus the plots representing the bandwidth consumption are uniformly increasing showing a round the clock network activity.
6. Conclusions and Future Work
Facilitating flooding by providing cognitive radios does impact positively on the performance however; the advantage gained is not significant when the bandwidth is abundant. We have seen in the results shown in the section 5 that the performance of flooding in opportunistic networks can be improved by incorporating cognitive radios that enable devices to use multiple simultaneous communication bands. The improvement is dependent on the behavior of the both devices as individual entities and underlying network as collective entity. Key device characteristics include mobility, meeting duration, meeting frequency whereas network density, strength of inter-cluster connections play an important role on the performance of any routing protocol.
In future, we intend to further investigate the effects of more advance technologies such as presence of MIMO devices and network coding enabled transmission on the performance of routing protocols in opportunistic networks.
References
- Akyildiz, I.F., Akan, O.B., Chen, C., Fang, J. and Su, W. (2003) Interplanetary Internet: State-of-the-Art and Research Challenges. Computer Networks, 43, 75-112. http://dx.doi.org/10.1016/S1389-1286(03)00345-1
- Pentland, A.S., Fletcher, R. and Hasson, A. (2004) DakNet: Rethinking Connectivity in Developing Nations. IEEE Computer, 37, 78-83. http://dx.doi.org/10.1109/MC.2004.1260729
- Kamruzzaman, S.M. and Jeong, D.G. (2010) Routing Protocols for Cognitive Radio Networks: A Survey. Journal of Information Industrial Engineering, 16, 153-169.
- Group, S.E.W. (2002) Report of the Spectrum Efficiency Working Group. Federal Communications Commission, Washington DC.
- Cesana, M., Cuomo, F. and Ekici, E. (2011) Routing in Cognitive Radio Networks: Challenges and Solutions. Ad Hoc Network, 9, 228-248. http://dx.doi.org/10.1016/j.adhoc.2010.06.009
- Akyildiz, I., Lee, W.-Y.,
Vuran, M. and Mohanty, S. (2008) A Survey on Spectrum Management in Cognitive Radio
Networks. IEEE Communications Magazine, 46, 40-48.
http://dx.doi.org/10.1109/MCOM.2008.4481339 - Ding, L., Melodia, T., Batalama, S. and Medley, M.J. (2009) Rosa: Distributed Joint Routing and Dynamic Spectrum Allocation in Cognitive Radio Ad Hoc Networks. Proceedings of the 12th ACM International Conference on Modeling, Analysis and Simulation of Wireless and Mobile Systems, Spain, 19-26 October 2009, 13-20.
- Cormio, C. and Chowdhury, K.R. (2009) A Survey on Mac Protocols for Cognitive Radio Networks. Ad Hoc Networks, 7, 1315-1329. http://dx.doi.org/10.1016/j.adhoc.2009.01.002
- Haykin, S., Reed, J.H., Li, G.Y. and Shafi, M. (2009) Scanning the Issue. Proceedings of the IEEE, 97, 784-786. http://dx.doi.org/10.1109/JPROC.2009.2015701
- Keranen, A. and Ott, J. (2007) Increasing Reality for DTN Protocol Simulations. Helsinki University of Technology, Helsinki.
- Burgess, J., Gallagher, B., Jensen, D. and Levine, B. (2006) MaxProp: Routing for Vehicle-Based Disruption-Tolerant Networking. 25th IEEE International Conference on Computer Communications, April 2006, 1-11.
- Lilien, L., Kamal, Z.H. and Gupta, A. (2006) Opportunistic Networks: Challenges in Specializing the p2p Paradigm. 17th International Workshop on Database and Expert Systems Applications, 722-726.
- Jain, S., Fall, K. and Patra, R. (2004) Routing in a Delay Tolerant Network. Proceedings of SIGCOMM 2004, 145-158.
- Vahdat, A. and Becker, D. (2000) Epidemic Routing for Partially Connected Ad Hoc Net-Works. Duke University, Durham.
- Islam, A. and Waldvogel, M. (2008) Reality-Check for DTN Routing Algorithms. Proceedings of the 28th International Conference on Distributed Computing Systems Workshops, Washington DC, 17-20 June 2008, 204-209.
- Islam, M.A. and Waldvogel, M. (2011) Questioning Flooding as a Routing Benchmark in Opportunistic Networks. 2011 Baltic Congress on Future Internet Communications (BCFIC Riga), Riga, 16-18 February 2011, 128-133.
- Pefkianakis, I., Wong, S.H.Y. and Lu, S. (2008) Spectrum Aware Routing in Cognitive Radio Mesh Networks. 3rd IEEE Symposium on New Frontiers in Dynamic Spectrum Access Networks, Chicago, 14-17 October 2008, 1-5. http://dx.doi.org/10.1109/DYSPAN.2008.90
- Abdelaziza, S. and El Nainay, M. (2012) Survey of Routing Protocols in Cognitive Radio Networks. http://wrc-ejust.org/crn/images/Surveys/RPCRNs.pdf
-
Urgaonkar, R. and Neely, M.J. (2009) Opportunistic Scheduling with Reliability Guarantees
in Cognitive Radio Networks. IEEE Transactions on Mobile Computing, 8, 766-777.
http://dx.doi.org/10.1109/TMC.2009.38 - Khalife, H., Ahuja, S., Malouch, N. and Krunz, M. (2008) Probabilistic Path Selection in Opportunistic Cognitive Radio Networks. IEEE Global Telecommunications Conference, New Orleans, 30 November-4 December 2008, 1-5.
- Eagle, N. and Pentland, A.S.
(2005) CRAWDAD Data Set MIT/Reality (v. 2005-07-01).
http://crawdad.cs.dartmouth.edu/mit/reality -
Balazinska, M. and Castro, P. (2003) CRAWDAD Data Set IBM/Watson (v. 2003-02-19).
http://crawdad.cs.dartmouth.edu/ibm/watson - Wang, Y., Jain, S., Martonosi, M. and Fall, K. (2005) Erasure-Coding Based Routing for Opportunistic Networks. ACM Workshop on Delay Tolerant Networking, Philadelphia, 22-26 August 2005.
- Juang, P., Oki, H., Wang, Y., Martonosi, M., Peh, L.-S. and Rubenstein, D. (2002) Energy-Efficient Computing for Wildlife Tracking: Design Tradeoffs and Early Experience with Zebranet. Proceedings of the 10th International Conference on Architectural Support for Programming Languages and Operating Systems, 37, 96-107.
- Harras, K.A., Almeroth, K.C. and Belding-Royer, E.M. (2005) Delay Tolerant Mobile Networks (DTMNs): Controlled Flooding in Sparse Mobile Networks. Lecture Notes in Computer Science, 3462, 1180-1192. http://dx.doi.org/10.1007/11422778_95
-
Lindgren, A., Doria, A. and Schelen, O. (2003) Probabilistic Routing in Intermittently
Connected Networks. SIGMOBILE Mobile Computing and Communications Review, 7, 19-20.
http://dx.doi.org/10.1145/961268.961272 - Zhang, X., Neglia, G., Kurose, J. and Towsley, D. (2006) Performance Modeling of Epidemic Routing. Proceedings of IFIP Networking.
- Small, T. and Haas, Z.J. (2005) Resource and Performance Tradeoffs in Delay-Tolerant Wireless Networks. Proceeding of the 2005 ACM SIGCOMM Workshop on Delay-Tolerant Networking, 260-267. http://dx.doi.org/10.1145/1080139.1080144
- Thrasyvoulos, S., Psounis, K. and Raghavendra, C. (2008) Efficient Routing in Intermittently Connected Mobile Networks: The Single-Copy Case. IEEE/ACM Transactions on Networking, 16, 63-76. http://dx.doi.org/10.1109/TNET.2007.897962
- Jones, E.P.C., Li, L. and Schmidtke, J.K. (2007) Practical Routing in Delay-Tolerant Networks. IEEE Transactions on Mobile Computing, 6, 943-959. http://dx.doi.org/10.1109/TMC.2007.1016
- Islam, M.A. (2012) Routing Issues in Opportunistic Networks: Evolution of Delay Tolerant Networks from Mobile Ad-Hoc Networks to Opportunistic Networks. LAP LAMBERT Academic Publishing.
- Islam, M. and Waldvogel, M. (2011) Optimizing Message Delivery in Mobile-Opportunistic Networks. Internet Communications (BCFIC Riga), Latvia, 16-18 February 2011, 134-141.
NOTES

1Nodes running the scanning software are referred to as designated.