Int'l J. of Communications, Network and System Sciences
Vol. 5 No. 3 (2012) , Article ID: 17996 , 7 pages DOI:10.4236/ijcns.2012.53019
A Comparison between Theoretical and Experimental Coverage Analysis in 3G Cellular Networks
Sección de Estudios de Posgrado e Investigación, ESIME Zac.-IPN, México D.F., México
Email: sergiovidalb@mac.com
Received November 9, 2011; revised December 10, 2011; accepted January 13, 2012
Keywords: WCDMA; Okumura-Hata; Propagation Analysis
ABSTRACT
This paper shows a comparison between theoretical and experimental coverage analysis. Theoretical work is based on Okumura-Hata propagation model, which are compared with the measured data obtained through an experimental analysis en México City. It is important because all the network designers and managers have to take in account how the signals will arrive to the mobile devices. If they know it, they can install Nodes B (base stations) in the better place in the area in order to take advantage of the power radiated by the antenna.
1. Introduction
A propagation model is a set of mathematical expressions, diagrams and algorithms used to represent the radio characteristics of a given environment. Generally, prediction models can be classified as empirical or statistical, theoretical or deterministic or a combination of these two (semi-empirical). While empirical models are based on measurements, theoretical models are based on the fundamental principles of the phenomena of radio wave propagation. Propagation models predict the path loss for an RF signal can be between a base station and a mobile or fixed receiver. The advantage of doing a radio channel model taking into account the characteristics of the path between transmitter (Tx) and receiver (Rx), is to determine the feasibility of projects that wish to plan in certain areas, so you can make a estimate of the need, costs and required equipment capacity (technical specifications). The performance of the propagation models is measured by the accuracy of the results compared with actual field measurements. The model described in this article has a good correlation in terms of the comparisons mentioned both in simulation and field measurements. The applicability of a model depends on this specification requires such as: the type of terrain (mountainous, hilly or quasi-smooth), the characteristics of the propagation environment (urban, suburban, and open), characteristics of the atmosphere (refraction index, rainfall intensity), soil electrical properties (conductivity ground), type of urban construction material etc. [1].
Several existing path loss models such as the Free Space Path Loss Model, Okumura-Hata’s Model, and Egli’s Model are chosen as reference for optimized path loss model development. The best existing path loss model with the smallest mean relative error to the measured path loss will be chosen as a reference for the development of the optimized path loss model. The regression fitting method is used to develop a new empirical linear line by combining the best existing path loss model with the measurement data which is collected from the WCDMA network. The new empirical linear line is used as a reference during optimization to develop an optimized path loss model [2]. For a very irregular and rugged topography, the best performing models are the diffraction losses estimated using the classical knife-edge and its different variations for the extension to multiple knife edges (i.e., Epstein-Peterson, Deygout, Bullington etc.), these models analyze point by point between Tx-Rx path, identifying the losses caused by the main obstacles and added to the solution Friis equation.
The Okumura-Hata’s model is an empirical model based on extensive measurements made in Japan at several frequencies within the range of 150 to 1920 MHz. Okumura-Hata’s model is developed for macro cells with cell diameters of 1 to 100 km [3]. The height of the BS antenna is between 30 - 1000 meters and the height of Mobil station antenna is around 3 meters. The OkumuraHata’s model takes into account some of the propagation parameters such as the type of environment and the terrain irregularity. This model is used to predict de power in a receiver located in an urban area for Mobil communications. Okumura developed a set of curves giving the median attenuation relative to free space in an urban area over a quasi-smooth terrain with a base station effective antenna height of 200 m and mobile antenna height of 3 m. These curves were developed from extensive measurements using vertical Omni-directional antennas at both the base and mobile [3].
The Okumura’s Model is expressed as:

where:
L50 (dB): is the 50th percentile value of propagation path loss;
LF: is free space path loss;
Amu: is free space attenuation;
G(ht): is base station antenna height gain factor;
G(hr): is mobile antenna height gain factor, and Garea: is gain corresponding to specific environment.
This paper describes how Okumura’s model can be chosen for urban outdoor coverage in the Wide Code Division Multiple Access (WCDMA) system. This optimized path loss model is based on the empirical measurements collected in the WCDMA network focusing on Mexico City.
Wide Code Division Multiple Access is a channel access method that allows several simultaneous information transmissions over a single communication channel, with different distinguishing code patterns. WCDMA employs both the spread-spectrum technology and a special coding scheme to allow multiple users to be multiplexed over the same physical channel. In the WCDMA system, duplex channel is made of two 1.25 MHz-wide bands of spectrum. WCDMA is a technology of the direct sequence of Spread Spectrum; this technology expands the signals over a bandwidth of 5 MHz, buried in the noise in the channel, and has the capacity to carry voice and data simultaneously. WCDMA provides high transfer rates, efficient support of asymmetric traffic, transmission using packet switching through the radio interface and high efficiency in spectrum use. The Base Station (BS) also known as a Node B; is part of the UMTS Terrestrial Radio Access Network (UTRAN). The Node B is to perform fundamental tasks of transmission and reception of radio, filtering of the signal, amplification, modulation and demodulation of the signal and be an interface to the Radio Network Controller (RNC) [5].
The Common Pilot Channel (CPICH) transmits a carrier used to estimate the cannel parameters. It is the physical reference for other channels. It is used to control power, coherent transmission and detection, measurement of adjacent cells and obtaining the Scrambling Code (SC) [6]. Power is divided in different paths which, depending on the quality of the Rake Receiver included in the mobile phone, provide greater or lesser number of signal components. Depending on the fingers that the Rake receiver receives, the orthogonality of the codes transmitted by a Base Station is lost, causing that the received signal fades. Those causes in all the signals sent by the Base Station and particularly in the signals from other subscribers, strong interference on mobile phones that support multipath reception [7].
2. Test Scenario
Measurements were done, along the test area, (Figure 1) it includes several buildings which are representative for their height, such as the 9 buildings with 3 floors and elongated structure, approximately 13 meters high, located from east to west, an adjacent building, perpendicular to these 9, with a north-south orientation with the same height. The area includes an auditorium with an approximate height of 13 meters. There is a library, a planetarium, and the sports area, which there is a stadium with a height of 6 meters. Measurements were made using a BTS Master MT8222A, which is a spectrum analyzer with advanced Software profiles to analyze WCDMA/ HSDPA signals. The measurement capabilities of this unit include Return Loss, Cable Loss, Distance to Fault, two port gain/loss, one port and two ports magnitude and phase, interference analysis, spectrogram, and power meter. The BTS Master can measure Node B performance Over the Air by connecting an antenna or by connecting Node B equipment directly to the BTS Master MT8222A. Measuring a WCDMA signal over the air, the antenna must be connected appropriately to the frequency band to be measured [8].
3. Measurements
The measurement procedure was performed in the band V (UMTS Channels), which has a center frequency of 887.5 MHz; which is used in Mexico for WCDMA services. The measurements were made with a spectrum analyzer, BTS Master MT8222A with frequency range of 9 KHz to 7.1 GHz, which has applications software for the analysis of WCDMA signal. The BTS Master can measure the performance of Node B by connecting directly to the Node B equipment or through the air by the connection of an omni-directional antenna, which operates in the frequency band of 870 to 960 MHz. To obtain the location information of each metering requires a GPS (Global Positioning System) antenna.
The first step for a correct analysis of the performance of a Node B is to delineate the area of interest where the measurements will be made; this area is shown in the Figure 1. 1519 measurement were obtained, the distance between them was about 3 meters, in the area shown in Figure 1, whose surface is about 0.7 Km2. In each measurement the spectrum analyzer was placed at a height between 1.10 and 1.30 meters, since it is the average height to which the user carries his mobile equipment.
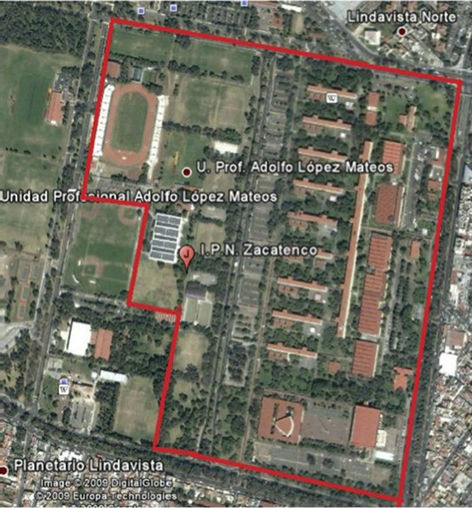
Figure 1. Analysis area.
For this work, the latitude and longitude were selected as a geographical reference of the system, and the CPICH power level because through the measurement of this power level, the user terminal is able to establish a connection with the Node B near, which provides the best service. This will allow that the user station know which is the dominant pilot that would define the coverage area.
4. Data Processing
The measurement equipment is capable of taking grab samples of the power levels at certain points. For adequate analysis requires the proper spacing between measurements, making it easy to apply statistical techniques such as Krige Method [9]; which is an interpolation technique based in a sample regression, with several samples irregularly spaced, it was used to predict unknown values from known values. The interpolation method of Krige facilitates the task of analyzing the distribution of power radiated by an antenna, it is sufficient to take a series of grab samples with the proper equipment (longitude and latitude parameters are needed) to create an experimental variogram, and based on it make the most appropriate approach to the theoretical variogram to perform interpolation and move from discrete samples to a continuous measurement map.
The Method of Krige is a family of generalized algorithms for least squares that from a set of observations provides the optimal linear predictor for the variable in any position. Daniel G. Krige developed the technique in an attempt to predict more accurately the mineral reserves. In recent decades the Krige Method has become a fundamental tool in the field of the geostatistics because founded the basis of linear geostatistical initially developed this method. It is a geostatistical method for estimating points that using a variogram model to obtain data. It is based on the premise that the spatial variation continues with the same pattern.
The variogram or semivariogram is a tool that allows analyzes the spatial behavior of a variable on a defined area, resulting in the influence of data at different distances. From the data provided by the theoretical variogram the estimation is performed by the method of Krige. The semivariogram is a measure of how similar the points are in the space when they are farther apart. To develop a variogram first requires creating an experimental variogram based on the selected simple, and choose a theoretical variogram that fit the experimental, because this is not a function where we can make interpolations. The semivariogram provides information of the spatial behavior of a variable. To quantify the degree and scale of spatial variation is necessary adjusting a function that describes the behavior of the variable [9].
The experimental semi-variogram (see Figure 2) is constructed depending on the variation of the mathematical expectation of the values obtained in the measurements (see Figures 3 and 4), to determine the influence of data at different distances. There are different space-temporal statistical models to obtain the experimental variogram, as: the exponential, Gaussian, Bessel, linear, to name a few. The most appropriate model for the results of the analysis of performance of a Node B is the empirical model “exponential Bessel” since the Bessel function of exponential correlation is one of the most flexible for general use [9].
To minimize the variance of the mean square error of estimate is necessary to have a function that describes the behavior of the phenomenon discussed, as an interpolation between the points of the experimental variogram does not guarantee the existence and uniqueness of the solution of the Kriging system, that is why, based on the experimental variogram, we construct a theoretical variogram that resembles the actual behavior of the variable through the least squares approximation as is showing in the red line in the Figure 5 [9].
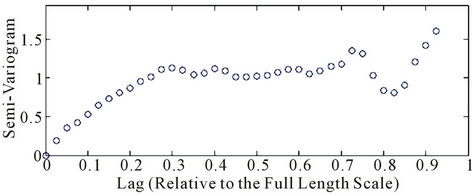
Figure 2. Experimental semi-variogram [9].
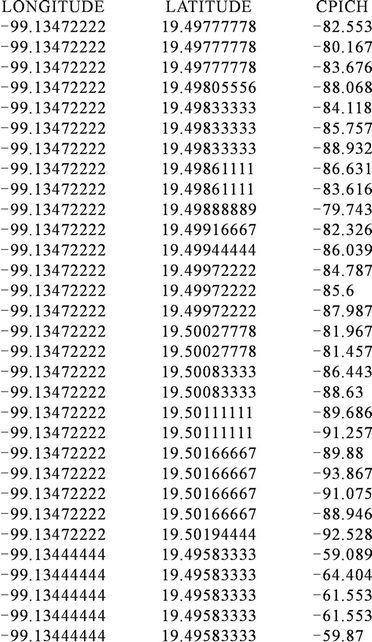
Figure 3. Data file format [9].
The Figure 6 is obtained using Ordinary Krige, because the mean value is not known, and we know that the value is not constant throughout the study area, but locally can be considered constant; because measurements are made at a distance will be very similar to those made in the vicinity of that point [9].
The validation step shown in Figure 7, is for to be sure that the mean square error is within the acceptance region to eliminate any doubt with respect to reliability, efficiency, consistency, sufficiency and unbiasedness of the power level estimator for proper analysis of the performance of a Node B [9].
The number of measurements needed to ensure a correct prediction of the measured power levels, depend on the range of variability of this power level. That is to say, if the power level is very variable, a greater number of measurements must be taken that when the power does not change quickly. Knowing the function most appropriate to the behavior of the measured power level the information is plotted so that geographical coordinates define the axes, and the power level determines the color, which represents the sample [9].
For complete analysis requires the use of different models of Geographic Information Systems (GIS, Geographic Information System) which is an organized integration of hardware, software and geographic data, designed to capture, store, manipulate, analyze and display
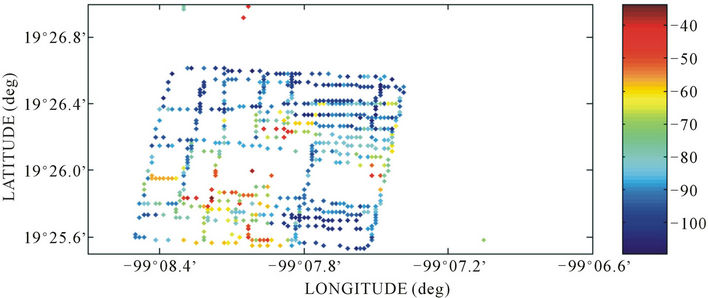
Figure 4. Location of point measurements [9].
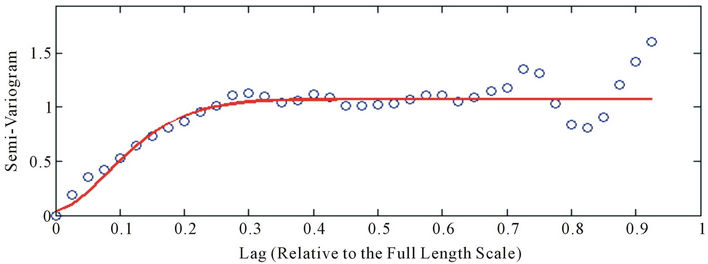
Figure 5. Theoretical variogram from LSQ [9].
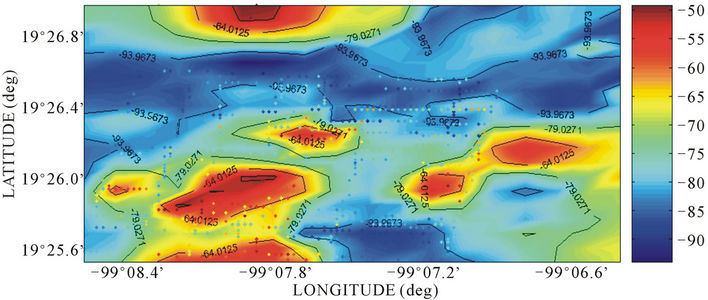
Figure 6. Coverage map [9].
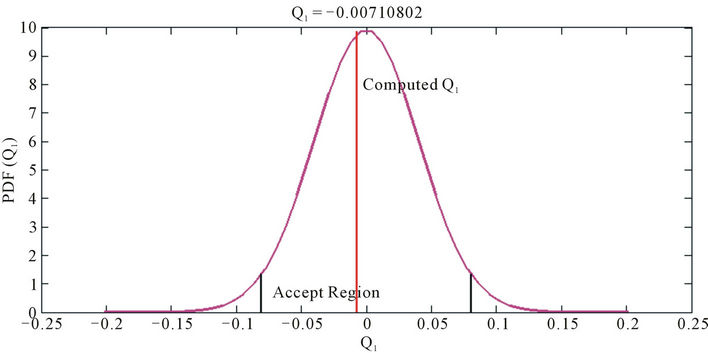
Figure 7. Graphical validation process Krige Method using the software tool “EasyKrig” [9].
all forms of geographically referenced information, to solve complex problems of planning and management to meet specific information necessary for a general vision of the area of interest [10]. Because with this is possible to overlay the power map created by Krige method, in the satellite photography of the interest area. For this work we made a program which works in MatLab. This makes calculations based on Okumura-Hata Method to obtain the approximate value of CPICH power level in the same points where measurements were made. In order to compare the theoretical levels created by Okumura-Hata equation with practical values measured, the program takes position information of each measure to calculate the distance between the measured points (as mobile station position) and the position of the Base Station, and height of both stations. After know all calculated values, those values with position information of measurements are used for created a theoretical CPICH power level.
5. Results
Figure 8 shows the power distribution levels for a particular Base Station, which is the dominant pilot in most
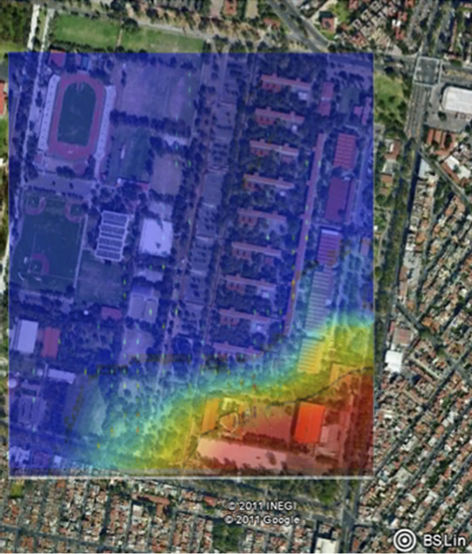
Figure 8. CPICH power distribution for the SC 226 in dBm.
of the area of interest. Taking into account the sensitivity of most mobile devices on the market is –80 dBm [11]. The power levels founded are acceptable, because in the boundaries of the coverage area, shown in Figure 8, the user station is able for start a call.
According to Okumura-Hata’s Model the power level of CPICH is plotted in Figure 9.
According to Table 1 the bigger errors are in the area around the Base Station. And lower errors are in the nearly area of the Base Station. It is because OkmuraHata model takes in to account the earth curvature. Then, if the distance between the Base Station and the Mobile Station is very short the calculation error is bigger that the error in more large distances. But in general, the Okumura-Hata model is appropriate for model the behavior of the signal in 3G cellular networks, because as we can see in Table 1, although the distance is greater that a kilometer the relative error is small, Because while the distance is into the range of 1 Km from 10 Km the Okumura-Hata model is applicable.
Also, we can realize that the difference between the calculate value and the measurement is bigger in the nearby area to the Base Station, but it does not happen around 0.5 Km as is shown in Figure 10. Where the red points represent the practical values, which are more similar to theoretical values. And the blue points the more different.
In the range of –90 dBm from –70 dBm the average different is of 6.7 dBm. This is a good approximation because for choose a Base Station the Mobile Station needs a difference approximate of 9 dB which is bigger that the difference between practical and theoretical values. Is important to say that the 90.2% of the compared values are between the range of 0 dBm from 10 dBm.
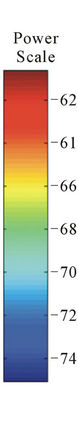
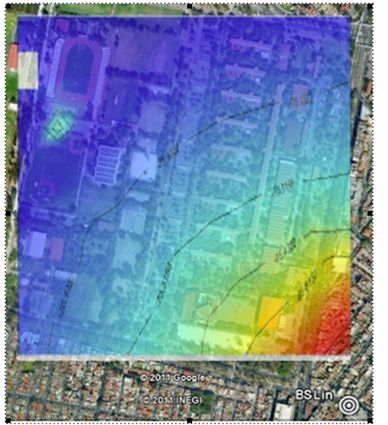
Figure 9. CPICH power distribution for the SC 226 in dBm according to Okumura-Hata model.
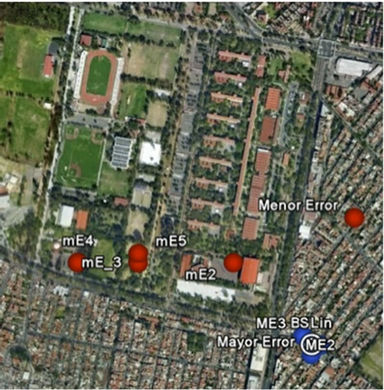
Figure 10. Analysis of error in Okumura-Hata model approximation.
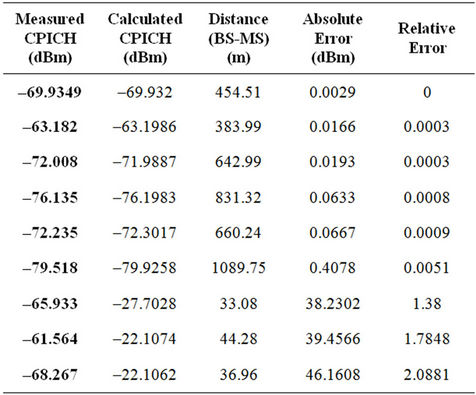
Table 1. Analysis of error vs distance.
6. Conclusions
Due to the Okumura-Hata is a model of propagation which was created based on several measurements made in Japan is necessary to ensure that is appropriate use this model in Mexico City due to that those are places with very different conditions for the propagation of the signal. There are a lot of propagation models, but specifically the Okumura-Hata model can be used because it offers an accuracy around of 90% as is shown in this article. It makes of Okumura-Hata a reliable propagation model for this particular case. As this work shows if you use this propagation model very near from the Base Station, is to say, with very short distances, the prediction is bad because the curvature of the earth introduces an important calculation error. Despite the fact that the Okumura-Hata model is good, the result could be better if we make some adjusts about the height of the Base Station and the mobile station. And take into account the specific characteristics of weather, kind of terrain among many others. Finally we can say that, in this particular case, the Okumura-Hata model could be appropriate to predict the behavior of the signal into a 3G Cellular Network in Mexico City, but an extended analysis must be deployed in order to validate the effectiveness of this propagation model.
When we use the Okumura-Hata Model the biggest mistakes are in the vicinity of the base station. And mistakes are lower in more remote areas of middle and base station measurement. This is because the model takes into account the curvature of the earth.
Although the range of distance between the base station and mobile station for the implementation of Okumura-Hata model is 1 to 10 Km the best predictions are given about 0.5 km.
REFERENCES
- Freely Adapted from a Portion of Jean-Paul M. G. Linmartz’s, “Wireless Communication, the Interactive Multimedia CD-ROM,” Baltzer Science Publishers, Amsterdam, Vol. 1, No. 1, 1996. http://people.seas.harvard.edu/~jones/es151/prop_models/propagation.html
- European Journal of Scientific Research, Vol. 45, No. 4, 2010, pp. 508-528. http://www.eurojournals.com/ejsr.htm
- Helsinki University of Technology Radio Laboratory Publications, “Teknillisen Korkeakoulun Radiolaboratorion Julkaisuja,” Espoo, 2002.
- T. Keji, “WCDMA Mobile Communications System,” John Wiley & Sons, New York, 2002.
- L. Jaana, W. Achim and N. Tomás, “Radio Network Planning and Optimization for UMTS,” 2nd Edition, Editorial John Wiley and Sons, New York, 2006
- Electronic Communications Committee (ECC) within the European Conference of Postal and Telecommunications Administrations (CEPT), “UMTS Coverage Measurements,” Ecc Report 103, 2007.
- QUALCOMM, “WCDMA Network Planning and Optimization,” Revision B, 2006.
- 3rd Generation Partnership Project, “Base Station (BS) Conformance Testing (FDD),” Technical Specification Group Radio Access Network, Release 10, 2011.
- B. J. Ponce and S. Vidal, “Krige Method Application for the Coverage Analysis of a Node-B in a WCDMA Network,” International Journal of Communications, Network and System Sciences, Vol. 4, No. 3, 2011, pp. 180- 188.
- J. Ponce, S. Vidal, I. Zamudio and M. Eslava, “Performance Experimental Analysis of a WCDMA Node B Based on CPICH, Multipath, EC/Io and RSCP Measurements,” 12th National Congress of Electromechanic and Systems Engineering, Mexico City, 2010.
- M. Ibáñe and A. Simón, “Space-Temporal Models Statistics in Perimetry,” Ph.D. Dissertation, Department of Mathematics, School of Technology and Experimental Sciences, Jaume 1 University, Castellón de la Plana, 2003.
- H. Acevedo, “Geographic Information Systems,” 2003. http://www.inbio.ac.cr/es/inbio/inb_sig.htm
- J. Ponce, S. Vidal, M. Acevedo and M. Jimenez, “A Geographic Information System Applied to Coverage Maps of 3G Cellular Communications Networks,” Journal of Geographic Information System, Vol. 3, No. 2, 2011, pp. 140-144. doi:10.4236/jgis.2011.32010
- M. Licea, S. Vidal and C. Barroeta, “Characterization of the Performance Parameters of Data Transmission in Mobile Communication Terminals of Broadband,” B.S Dissertation, Department of Communications, National Polytechnic Institute, Mexico City, 2010.
- J. Ponce, S. Vidal and J. Sosa, “Analysis of the Impact of the Multipath Phenomena and Size of Cell in WCDMA Third-Generation Networks,” B.S Dissertation, Department of Communications, National Polytechnic Institute, Mexico City, 2010.