Int'l J. of Communications, Network and System Sciences
Vol.3 No.1(2010), Article ID:1169,13 pages DOI:10.4236/ijcns.2010.31002
Modelling the Performance of a Cross-Layer TCP NewReno-HARQ System
School of Electronic and Electrical Engineering, University of Leeds, Leeds, UK
E-mail: nimbe@erg.abdn.ac.uk, a.h.kemp@leeds.ac.uk
Received October 2, 2009; revised November 11, 2009; accepted December 15, 2009
Keywords: HARQ, TCP, Markov Chains, M/G/1/K Processes
Abstract
This paper presents an analytical model of a cross-layer communication system to enable improvement in the Transmission Control Protocol (TCP) over mixed wired and wireless Internet. The focus is on the quantitative performance evaluation of the interactions between TCP NewReno and a hybrid Automatic Repeat reQuest protocol (HARQ) in the link layer (LL) with a finite buffer size. The significant improvement in TCP NewReno throughput when HARQ adaptively selects its optimal settings according to explicit cross-layer information is shown. Through ns-2 simulations, it is demonstrated that this proposed analytical model accurately predicts the TCP-HARQ system performance.
1. Introduction
This paper presents an analytical model which can be used to replace simulated testing (which typically gives inconsistent results and is laborious to carry out) for assessing the performance of mixed wired and wireless networks using TCP. As ubiquitous Internet access grows this is increasingly important to aid design of future networks.
TCP is the most widely used transport protocol in traditional wired Internet. However it shows poor performance over wireless channels which is related to its design principle: TCP was designed to provide reliable end-toend communication between two hosts in wired networks where losses are due to congestion. As soon as congestion is detected, TCP sending bit rate is halved to alleviate it. Since radio channels exhibit time-varying error rates, the halving of TCP sending bit rate under these conditions is not an optimal measure given that if the fading conditions elapsed, scarce wireless bandwidth would be wasted. Otherwise, if the link’s poor quality transmission continues, halving the bit rate has no impact on the SNR and channel errors will continue to occur.
Since the integration and interaction of wireless and wired networks in a smooth and efficient manner is one of the most important challenges for next generation all-IP networks, the enhancement of TCP performance over wired-wireless links will result in a more efficient use of network resources. This will provide better quality of service from the user’s perspective and higher revenue to service providers.
There have been several approaches to addressing this problem [1–5]. The techniques to enhance TCP performance over wired-wireless links have predominantly used the Reno version [6]. Though this version was previously widely deployed, more efficient versions, such as NewReno [7], are nowadays extensively installed in web servers [8]. In line with this, the NewReno version is modelled in this paper.
The performance of TCP connections over wiredwireless links have been modelled mostly through two different approaches, directly over the wireless link [9– 11] or considering LL error control techniques [12–18]. ARQ protocols are used in works such as [12–15], the impact of Forward Error Correction (FEC) codes is analysed in [18] whilst TCP interactions with HARQ systems are studied in [16,17,19]. In none of these works is TCP NewReno analytical modelling developed, all these mentioned works but [12] have used the Reno version. In addition, [15,16,18,19] used known throughput equations to predict TCP performance instead of developing an analytical model as in the rest of the papers. Furthermore, an infinite buffer size is considered in the TCP analysis over HARQ presented by [16,17] and in the cross-layer TCP-ARQ systems proposed by [14,15].
The line followed in this work is to consider LL error control techniques through developing a theoretical model of a cross-layer communication system with topdown explicit notifications, from TCP to the LL of a base station (BS) in a last-hop wireless link topology. It is considered that a hybrid ARQ mechanism is implemented in the LL. Emphasis is given to the impact of a finite LL buffer size, a condition that is commonly assumed to be infinite.
The operation of the HARQ scheme comprising Forward Error Correction (FEC) convolutional codes and a Selective Repeat (SR) ARQ protocol is characterised by a Discrete-Time Markov Chain (DTMC). Corruption losses occur in a radio channel and are modelled by a two-state DTMC whilst congestive losses are due to to the finite buffer size. HARQ performance parameters are computed through the two-moment approximation of an M/G/1/K analysis.
Similar approaches to this work have been proposed by [14,16,17], however they consider an infinite buffer size.
Thus, the original contributions presented in this work are: 1) A theoretical model of a cross-layer TCP NewReno-HARQ communication system which comprises a novel HARQ analytical model with a finite LL buffer size and a new TCP NewReno mathematical characterisation developed from an existing Reno model, 2) It is demonstrated that the proposed cross-layer system significantly improves TCP performance when the optimal HARQ parameters are adaptively selected at the beginning of the connection and 3) It is also demonstrated that the LL buffer size can be reduced without detriment to TCP performance. This work is divided as follows: the TCPHARQ cross layer system is described in Section 2. HARQ analytical model is developed in Section 3 whilst the NewReno version is modelled in Section 4. Assessment of the accuracy of the cross-layer system is presented in Section 5. Finally, Section 6 concludes the work.
2. TCP-HARQ Cross-Layer System Description
The schematic diagram of the cross-layer system to be modelled is shown in Figure 1. The scenario used is that of a TCP connection between a server in the wired section of the Internet, as most of the current servers are located, and a mobile client on a wireless link. At the beginning of the connection, when the server receives the request for a TCP connection, it sends top-down explicit notifications to the LL of a base station (BS), which is in communication with the mobile station (MS) where the TCP client is located. The transmission and form of these explicit notifications are out-of-scope of this work. The explicit notifications indicate the maximum congestion window (cwnd), the timeout (TO) duration and the delay in the wired section of the network. An LL HARQ mechanism, which implements error detection and correction through truncated Selective Repeat (SR) ARQ and FEC convolutional codes, is used in the BS. Then, the LL entity computes and predicts TCP performance considering the explicit notification information, the dif-
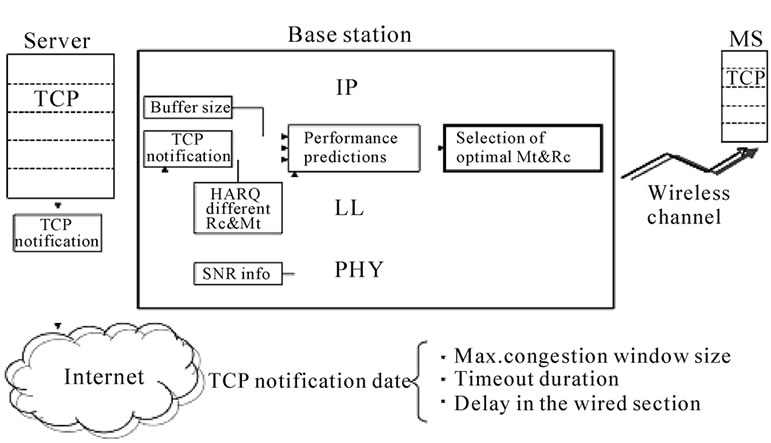
Figure 1. TCP NewReno-HARQ system schematic diagram.
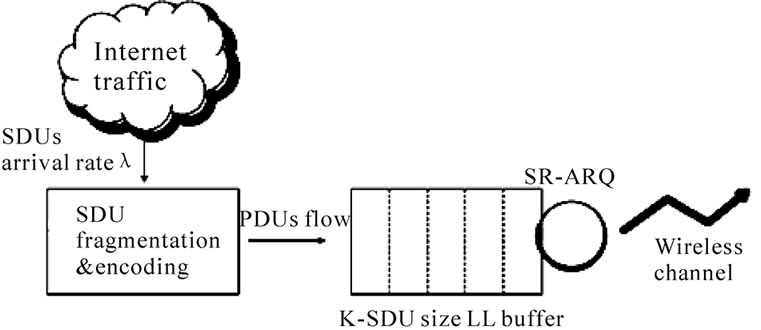
Figure 2. HARQ system at the LL.
ferent code rates, Rc, the variable number of retransmissions, Mt, the buffer size and the MS's monitored Eb/N0 (called SNR throughout this work). Finally, it selects the optimal HARQ parameters, (Rc, Mt), which provide the best TCP NewReno performance.
The TCP receiver side does not suffer any changes in this proposed system. Furthermore, cross-layer communication between the physical and link layers and, the transport and network layer is needed in order to know the wireless channel SNR and the delay in the wired section of the Internet, respectively.
The HARQ system modelled in this work is validated in detail in [20] and shown in Figure 2. Service Data Units (SDUs) arrive with normalised rate l at the LL where, after being fragmented and encoded, form a flow of Protocol Data Units (PDUs). In addition, a LL header is appended to each PDU. The PDU size is the same regardless of Rc, hence the amount of application data per PDU varies according to the amount of redundancy added. So, PDUsize=ba+br, where ba is the number of application bits, including the LL header, and br is the number of redundant bits needed to implement FEC. The parity bits to perform the Cyclic Redundancy Check (CRC) are also contained in ba. The code rate is defined as Rc=ba/(ba+br).
The resulting fixed-size PDUs are passed to the LL transmission buffer, which has a finite capacity of K-SDU and a first-in first-out transmission policy. The buffer capacity is fixed and equal to  where C is the link capacity in bps, SDUsize is given in
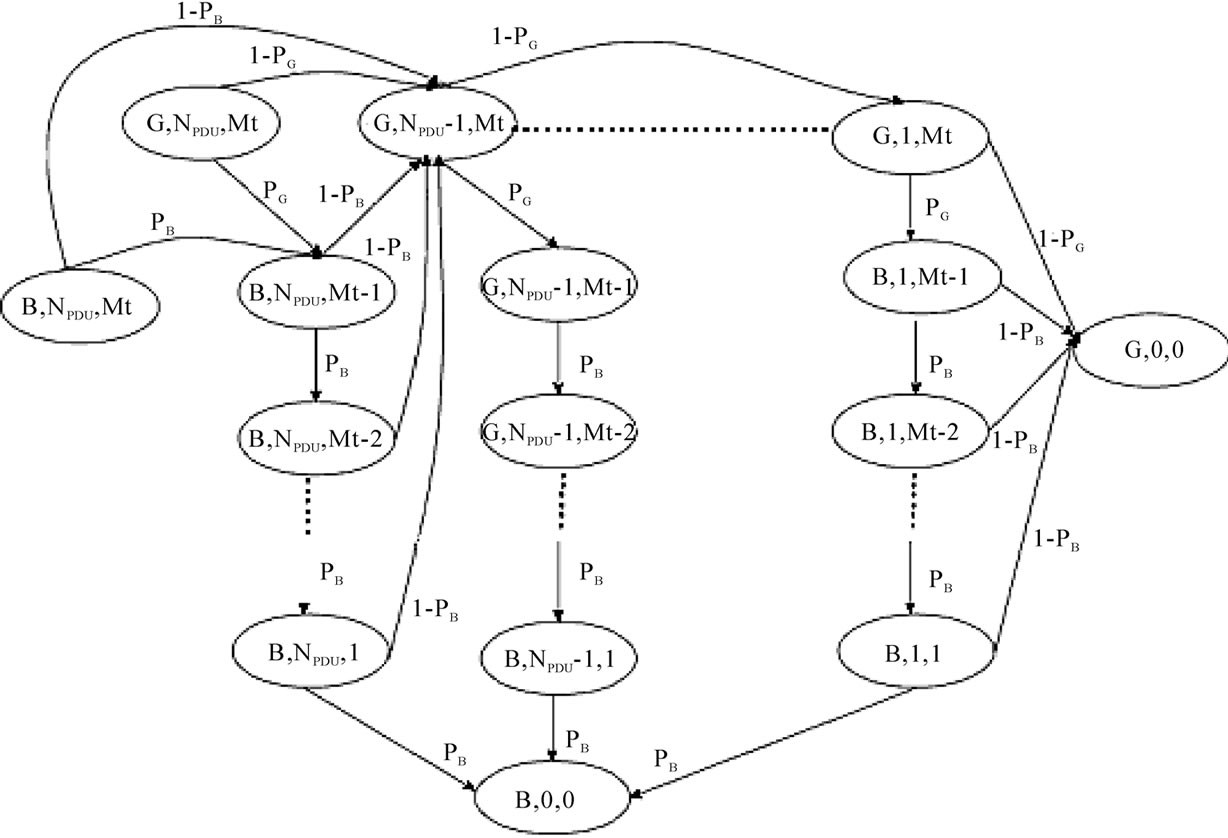
Figure 3. SDU transmission process by a SR-ARQ protocol.
bits and rtt is the average round-trip time in seconds. The number of stored SDUs varies according to their respective code rate Rc. If the number of SDUs queueing and being transmitted is K+1, additional arriving SDUs will be discarded until a buffer position becomes available. It is important to realise that the input traffic to the buffer will be in the order of  because of the encoding process causing a significant increase in the traffic intensity r.
The SR-ARQ entity on the server side keeps transmitting PDUs, while on the receiver side, it verifies which PDUs (after decoding) still contain errors and asks for their retransmission. The PDU is retransmitted as many times as allowed by the SR-ARQ parameters. If it still presents unrecoverable errors, the complete SDU is discarded. Then, TCP will detect the discarded segment and will retransmit it by either Fast Retransmits or TOs.
3. HARQ Analytical Model
In this section HARQ analytical model is described. First, the mathematical procedure followed to obtain the mean PDU error probabilities after FEC decoding when transmitted over a Rayleigh channel is presented. Second, the SDU transmission process by a SR-ARQ protocol is represented by a Discrete-Time Markov Chain (DTMC). A new theoretical approach based on the fundamental matrix is developed to calculate the SDU wireless loss probability, pW, after SR-ARQ implementation. Next, the SDU loss probability due to congestion, pK, is computed with the two-moment approximation method to solve M/G/1/K processes. Finally, performance parameters such as the total SDU loss probability, ptotal, and LL delay, EHARQ[D], are derived.
3.1. Radio Channel and FEC Model
It is assumed that the transmission power keeps the SNR,  dB, to an average level, gtarget. Then,
 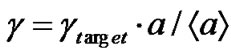 , where a is the square of the Rayleigh fading envelope and
  is its expected value.
The wireless channel error process is modelled by a two-state DTMC with time unit t, which represents the PDU transmission time. The channel induces fewer errors in the Good state when g is higher than a certain threshold, gth , and is in the Bad state otherwise. ath is the value of a when g=gth.
PDUs are encoded with convolutional codes and decoded by soft-decision Viterbi decoding. Hence, the residual bit error probabilities after decoding, f(g)s, assuming QPSK modulation, are computed numerically by the generators described in [21].
The analytical procedure developed in [17] is followed in order to relate physical parameters such as g and Doppler shift to the DTMC transition probabilities. Therefore, the mean PDU error probabilities in the Good and Bad state, pG and pB, are computed as:
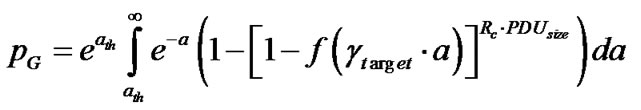 (1)
(1)
 (2)
(2)
Unlike [17], losses due to congestion in the LL buffer are also considered as well as the NewReno version and the adaptive selection of HARQ parameters according to the explicit cross-layer information.
3.2. HARQ Analytical Model
In order to develop the analytical model for the SR-ARQ mechanism it is assumed that: 1) the SDU arrival process at the LL is Poisson. Although some have stated that the Internet packet arrival process is not Poisson [22], recent research has shown evidence in favour of Poisson Internet traffic models [23,25] 2) The LL buffer implements a generic SR-ARQ protocol for SDU transmission. 3) The process in the LL buffer is considered as a M/G/1/K process. 4) The number of PDUs per SDU is NPDU and the number of retransmissions allowed per PDU is Mt-1. 5) ACKs & NACKs are always correctly received right after the PDU transmission time.
Even when the assumption of Poisson arrivals can be challenged, the validation results in Section 5 show good agreement with the analytical characterisation, under the given simulation conditions. Furthermore, this assumption is necessary in order to solve the M/G/1/K process in the finite size buffer.
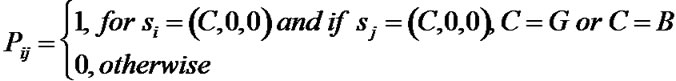
The transmission of one SDU by the SR-ARQ protocol is represented by a DTMC which is shown in Figure 3. A Markov chain state is defined by: s=(C,NPDU,Mt), where CÎ(G,B) is the channel state referred to as Good or Bad, NPDUÎ(0,NPDU) is the number of PDUs, belonging to the same SDU, waiting in the LL buffer to be transmitted and MtÎ(0,Mt) is the number of transmission attempts available.
The states (G,0,0) & (B,0,0) are absorbing states which represent the success or failure of a SDU transmission after attempting to retransmit a PDU Mt-1 times. The fundamental matrix is used to find the probability that the process goes to (B,0,0).
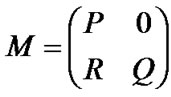
The number of transient states for the SDU transmission process is m=(NPDUxMt)+1. So, the matrix M is:
 (3)
(3)
where P is the [2x2] matrix of absorbing states, 0 is the [2xq] matrix of zeros where q=m-2, R is the [rx2] matrix of transitions between the transient states into those absorbing (r=q) and Q is the one step transitions probability matrix [qxq].
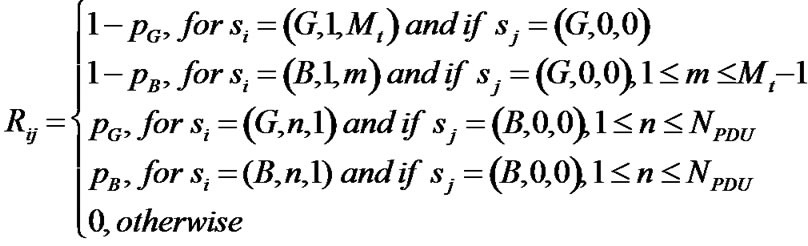
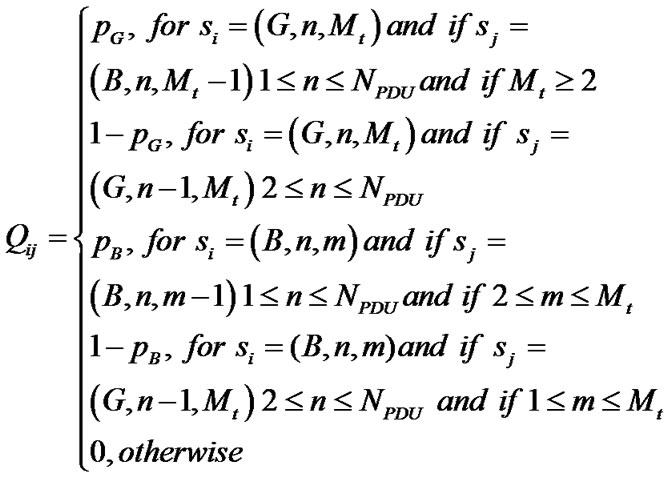
If the chain is in si, the probabilities that a PDU is (un)successfully transmitted to sj are given by Equations 4, 5 and 6:
 (4)
(4)
 (5)
(5)
 (6)
(6)
Thus, Qn tends to 0 (zero matrix) when n tends to infinity and, 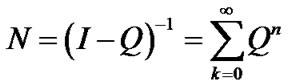 is the fundamental matrix which gives the total number of time slots during which the process is in a certain state.
The R matrix is formed by two column vectors, each one corresponding to an absorbing state. If the column vector of the failure state is called pf, then Npf is a vector which contains the probabilities of going to s(B,0,0) given it starts in any transient state. However, as the channel is modelled by a two-state DTMC, the SDU transmission initiates from either s(G,NPDU,Mt) or s(B,NPDU,Mt). Then, the absorption probabilities corresponding to these two initial states are taken from Npf and form the 2-element column vector Npf’. Consequently, pW is given by:
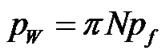 (7)
(7)
where p=[pG pB] is a row vector with the radio channel steady-state probabilities of being in the Good or Bad state.
Now, expectation of the SDU service time, E[t], to transmit an SDU successfully over the wireless link is calculated. In the R matrix, the column vector of the success absorbing state is called ps. Then Nps gives the SDU probability of being successfully transmitted. Ds is defined as a diagonal matrix with Nps as diagonal elements. The SDU service time when the process starts from any transient state is calculated as Es[t]=Ds-1NDse, where e is a column vector of ones [q,1]. As the SDU transmission process only starts from either s(G,NPDU,Mt) or s(B,NPDU,Mt):
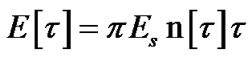 (8)
(8)
where Es'[t] is the 2-element column vector containing the mean service times of the initial states. The average number of transmissions per PDU, EPDU[Mt]=pEs'[t], is calculated considering that the SDU is formed by one PDU, NPDU=1.
3.3. Congestive Loss Analysis
An M/G/1/K analysis is carried out to find the SDU wired loss probability, pK. The two-moment approximation approach is used instead of the embedded Markov chain because of its reduced computational complexity and its closed-form expressions. In order to use this approach, it is necessary to calculate the coefficient of variation of the service time, Ct2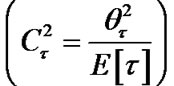 , such that, if qt2 is the variance of the service time:
 (9)
(9)
where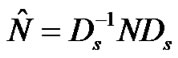 , and
, and  is the [2x1] vector which contains the variance of the two initial states from the
  vector.
The LL buffer capacity is, as mentioned, K-SDU. pK is calculated by the following expression developed in [26] using the two-moment approximation approach:
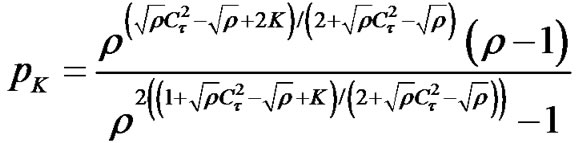 (10)
(10)
3.4. Performance Parameters
3.4.1. HARQ Total SDU Loss Probability
If it is considered that the probabilities of an SDU not being discarded by the buffer and of being successfully received by the MS are independent, the total SDU loss probability is:
 (11)
(11)
3.4.2. HARQ Delay
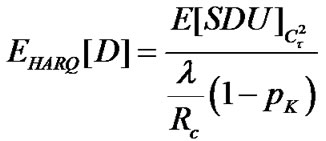
The expected total delay experienced by a SDU, EHARQ[D], in the LL buffer, including queueing and server processing, is obtained through Little's formula:
 (12)
(12)
where 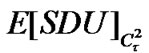 is the expected number of SDUs in the LL buffer which is derived in [26] and defined in Equation 13. Delays due to the wireless channel propagation, processing at the receiver and encoding/decoding are not included:
 (13)
(13)
3.4.3. HARQ Energy Efficiency
The energy efficiency of the radio link due to HARQ, EHARQ[Mt], can be obtained as the ratio of the SDU application bits to the actual number of bits sent:
 (14)
(14)
The parity bits, contained in ba, are also considered because they are used for ARQ CRC.
4. TCP NewReno Analytical Model
In this section, the mathematical procedure of [14] to develop the TCP Reno version is extended in order to analytically represent the NewReno Fast Recovery algorithm. This analytical characterisation is validated in detail in [27]. It is assumed that the reader is familiar with TCP algorithms.
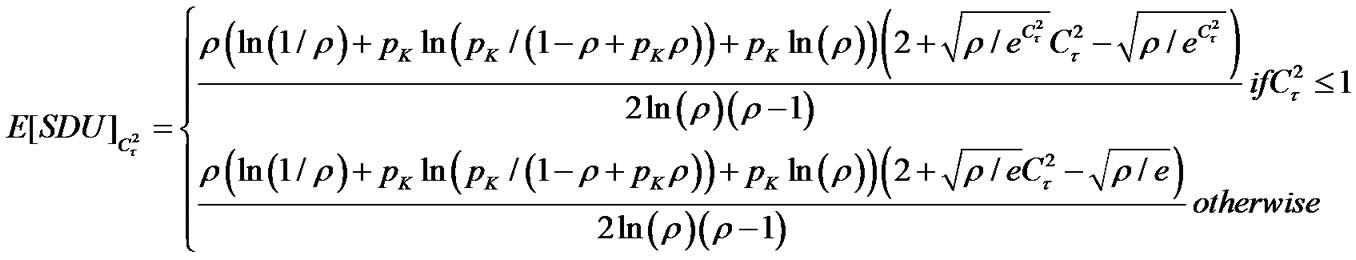
The Continuous-Time Markov Chain (CTMC) representing the TCP NewReno transmitter dynamics conveying data from a bursty application is shown in Figure 4 where a maximum cwnd equal to 10 Maximum Segment Sizes (MSS) is considered. To clarify the figure, transitions from all states to sOFF are not totally represented as well as some transitions from SCA to SFR. The CTMC transition rates are shown in Table 1 for a generic cwnd value.
In the Reno model of [14] it is assumed that the system goes to STO if more than one segment is lost during Slow Start (SS) or Congestion Avoidance (CA), or if one loss occurs during Fast Recovery (FR). In contrast, in the NewReno extension presented here, multiple losses can occur in the SS, CA or FR phases, which can be recovered during FR.
4.1. Relations between TCP Algorithms and Transition Rates
As soon as the application starts passing data to TCP, it divides the data in MSS and begins the connection by
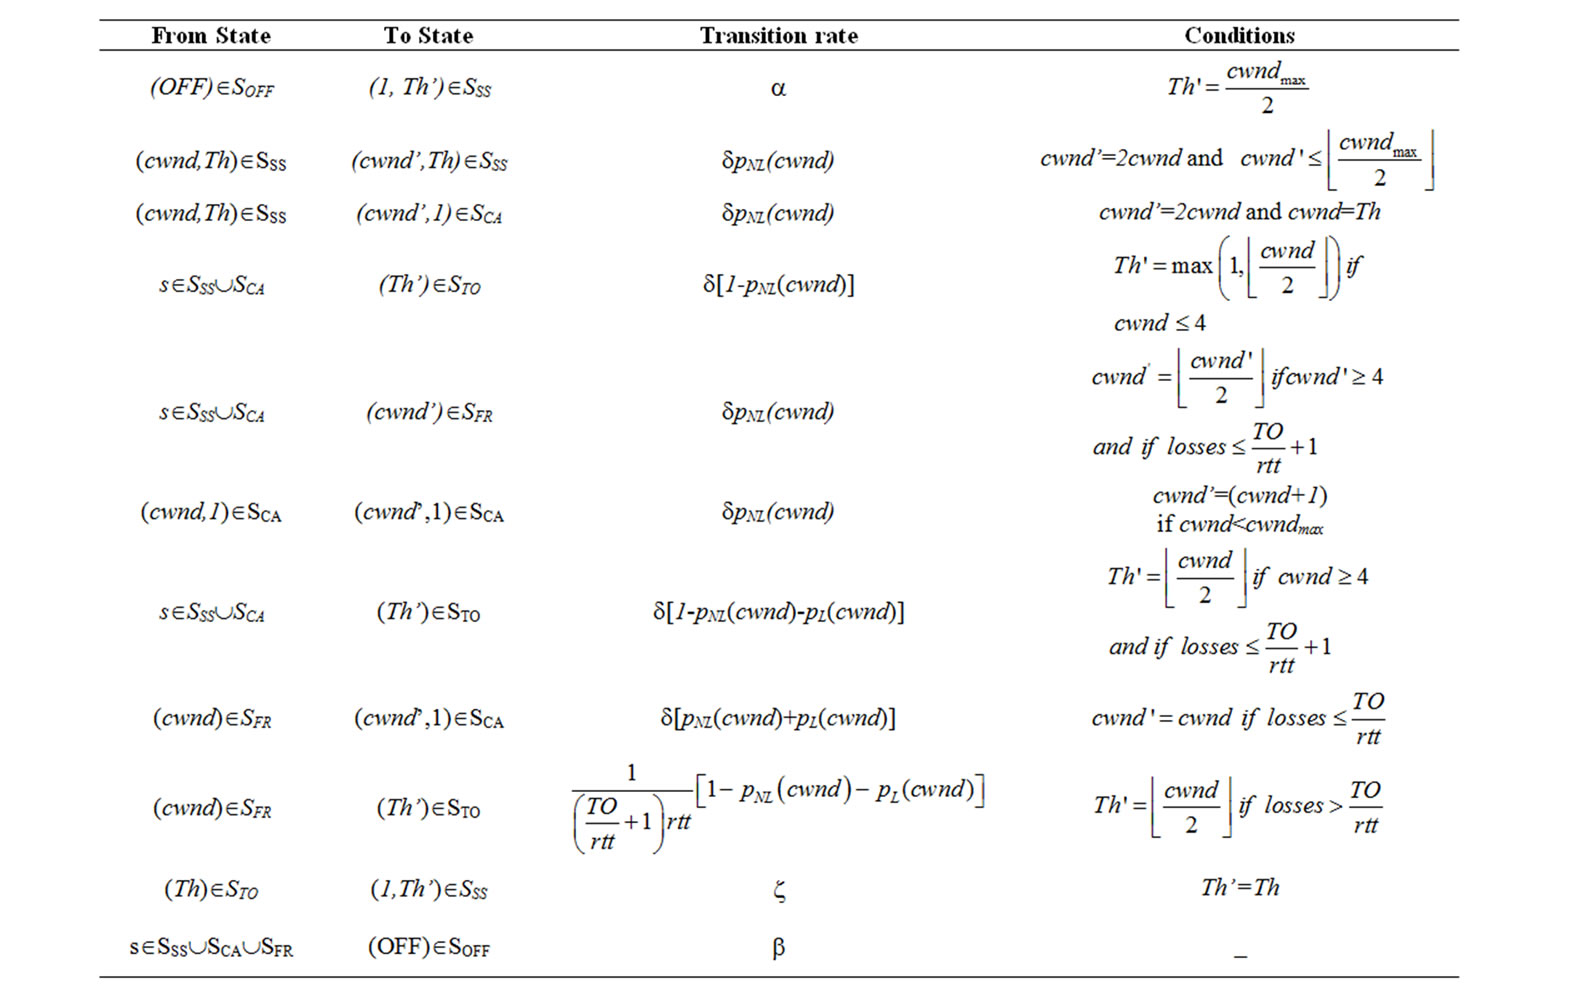
Table 1. QTCP transition rates.
Figure 4. CTMC representing TCP algorithms.
setting its threshold to the nearest lower integer power of 2 of . The chain transition from sOFF to s(1,Th)ÎSSS represents the beginning of the TCP transfer. The time durations spent in sON and sOFF are random variables, a and b, with negative exponential distributions.
Once the system is in SS mode, if there is no segment loss, s(cwnd,Th) goes to s(cwnd',Th) with rate dpNL(cwnd). cwnd' is equal to double the previous cwnd value whilst d is the parameter of the exponential distribution governing the occupancy time of the states and is equal to . pNL(cwnd) is the embedded Markov chain probability of not having losses during the transmission of a certain cwnd and is calculated as:
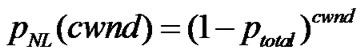 (15)
(15)
where ptotal is the TCP segment loss probability detected at the transport layer and is defined in Equation 11, considering that MSS=SDUsize.
In case the cwnd of a state in SSS reaches the threshold value, it will enter (cwnd',1)ÎSCA with a transition rate of dpNL(cwnd). If no losses take place in the CA mode, s(cwnd,1) will move to s(cwnd+1,1) with a rate of dpNL(cwnd).
TCP detects losses through the reception of triple-duplicate (TD) ACKs therefore,  is the condition to recover losses by FR. If at least one loss occurs and if cwnd<4, states in SSSÈSCA will inevitably enter a corresponding state in STO. In the TO phase, states will take a value of Th’ where Th' represents the nearest lower integer power of 2 of
 . The transition rate to STO is equal to d[1-pNL(cwnd)] for
 .
.
In contrast, TCP enters FR as soon as it detects a lost segment through TD ACKs. The maximum number of allowed lost segments is conditional on the cwnd size, i.e. the number of received segments has to be at least 3 to allow TD indications. Any state of the set SSSÈSCA experiencing from 1 to 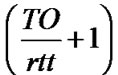 lost segments, will move to (cwnd')ÎSFR with
 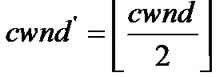 and transition rate dpL.
Since each segment sent in the cwnd represents an independent event and can be equally affected by the constant total loss probability ptotal, it is assumed that the segment loss pattern follows a binomial distribution. Hence, pL is defined as:
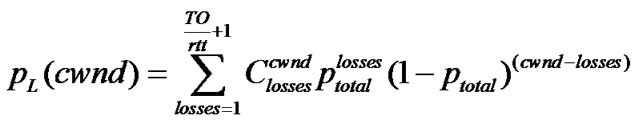 (16)
(16)
In the FR phase it is only possible to recover  losses occurred in CA. If more losses take place, a state from sÎSSSÈSCA will move to STO with transition rate d(1-pNL-pL).
Unlike Reno, the NewReno version avoids multiple halving of the cwnd every time a loss is detected. The reception of TD ACKs caused by the first loss occurring in SS or CA, triggers the Fast Retransmit algorithm and its inherent rate halving whilst the reception of partial ACKs caused by the subsequent losses do not trigger any further sending rate reductions.
Once in the FR mode, the retransmission timer is reset after the first partial ACK is received, as stated in [7]. Therefore, it will ultimately timeout after  rtts in which
  segments are retransmitted given that it is only possible one retransmission per rtt. TCP retransmits the lost segment as soon as it receives the TD ACKs and it has to wait one rtt once in FR, in order to detect a subsequent loss. If a cumulative ACK is received after the 1st rtt, no further losses occured in CA and the process can move back to CA. Otherwise, if a partial ACK is received, more than one loss has occurred and the lost segment is retransmitted immediately.
Thus, the system will move from sÎSFR back to a corresponding sÎSCA with a rate of d[pNL(cwnd)+pL (cwnd)], where pL can be calculated through Equation 16 considering the maximum number of losses equal to  instead of
 .
.
If the number of losses during the FR is higher than , sÎSFR will enter a corresponding state (Th)Î STO with a transition rate
 .
.
By considering the maximum number of segments which can be lost in CA and recovered in FR,  , and that which can be lost and recovered in FR,
  , we are characterising the NewReno algorithm which is the most significant difference from the Reno analytical model of [14].
Any state sÎSSSÈSCAÈSFR going to the TO phase will halve its cwnd. This value will be the threshold of sÎSTO. It will also be the threshold value in the SS phase when the chain moves back to (cwnd,Th)Î SSS in order to continue the data transfer. The transition rate from the TO states to the SS mode is, as expected, .
.
If the application stops sending data to TCP, the chain will enter s(OFF) with a rate b regardless of its current state. However, there are no transitions among sÎSTO and s(OFF) because once the retransmission timer expires, it still needs to retransmit the whole cwnd which contains the lost segment(s).
TCP rtt. The expected rtt of TCP segments is necessary to calculate d, therefore it is calculated as:
 (17)
(17)
where Dwired is the delay in the wired section of the network, EHARQ[D] is the delay in the LL buffer, defined in Equation 12, and ACKTCP is the TCP ACK transmission time over the wireless link. ThusETCP[rtt] greatly depends on the LL buffer delay which subsequently impacts on TCP performance.
4.2. TCP Performance Parameters
TCP throughput. In order to calculate the TCP throughput, the steady-state probabilities of the CTMC, pTCPs, are calculated by the algorithm developed in [28]. The average MSS generation rate per second, whilst the application is active, is calculated as in [14]:
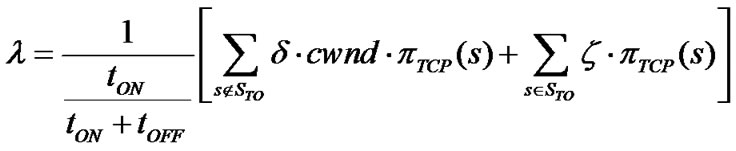
where tON and tOFF are the average time durations in sON and sOFF, respectively, given by  and
and  . The receiving TCP bit rate is computed by:
 (19)
(19)
TCP energy efficiency. SDUs are dropped by the LL buffer or discarded by the HARQ because either the
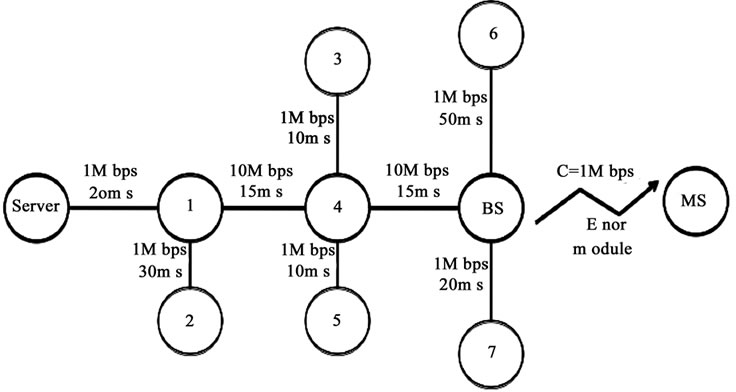
Figure 5. Network topology set up in ns-2 validation.
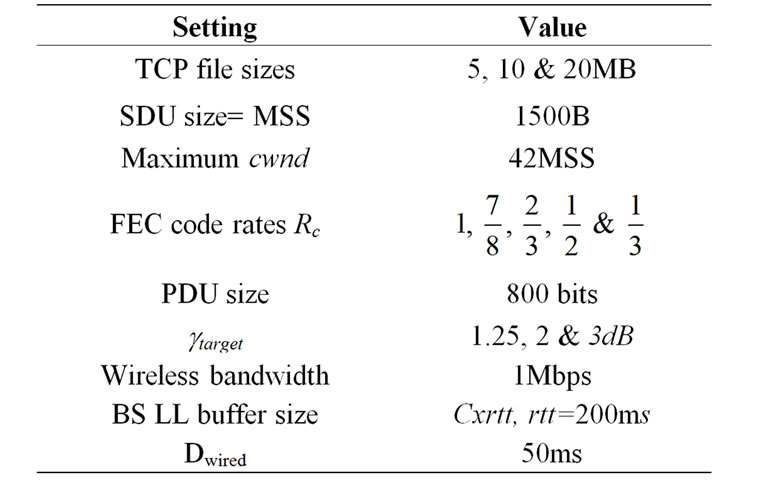
Table 2. TCP-HARQ system simulation settings.
buffer is full or several of their PDUs still present unrecoverable errors after the allowed number of retransmissions. Since segments are recovered through FRs or TOs, these TCP retransmissions have a direct impact on the wireless link efficiency. The lower the TCP retransmissions, the higher the link efficiency which depends on the HARQ error correction capability. TCP energy efficiency, ETCP[Mt], is defined to measure this effect:
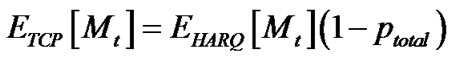 (20)
(20)
5. TCP-HARQ Model Performance Validation
In this section, the accuracy of the analytical predictions of the cross-layer TCP-HARQ model is validated through ns-2 simulations.
5.1. Validation Scenario
The validation scenario is shown in Figure 5 where the TCP connection under analysis is that from host 0 to the MS. A two-state error module models the wireless link, this radio channel is used solely by the segments of the TCP flow under consideration. In order to model the error module, pG and pB are numerically computed according to Section 3. The simulation settings are displayed in Table 2.
The TCP transfers occured under different traffic conditions which include no-traffic and a mixture of Reno
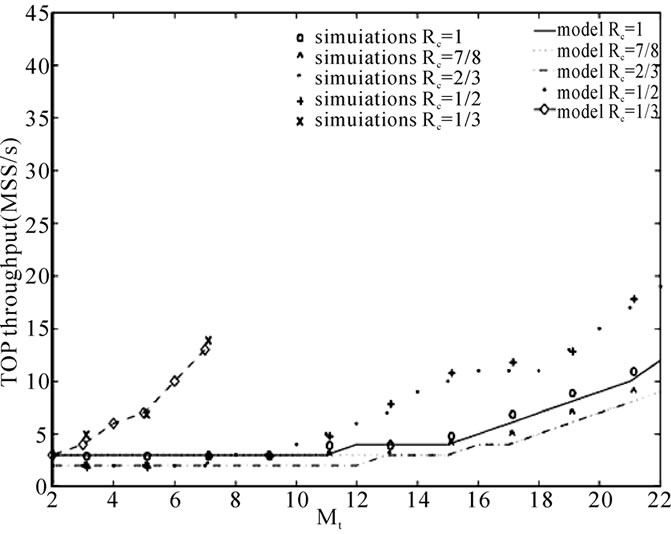
Figure 6. TCP NewReno throughput for gtarget = 1.25dB.
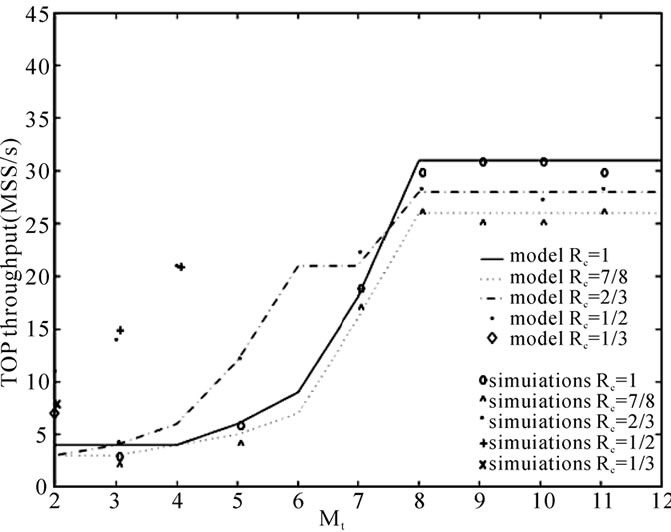
Figure 7. TCP NewReno throughput for gtarget = 2dB.
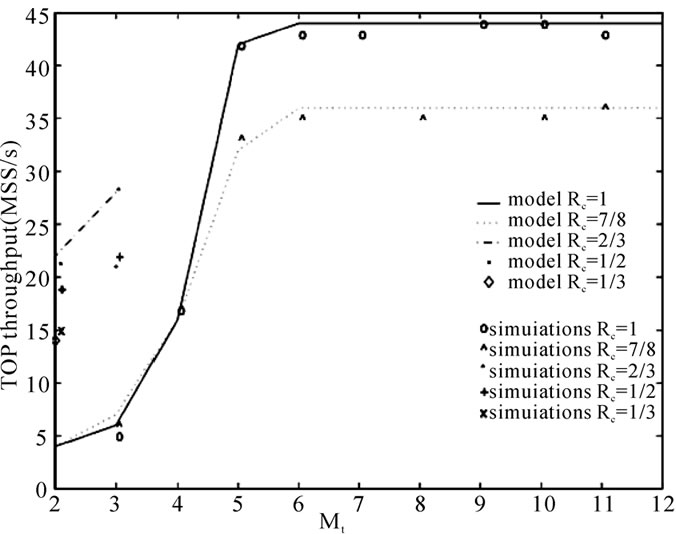
Figure 8. TCP NewReno throughput for (target = 3dB.
and NewReno as well as UDP flows which were started at random times to simulate the Poisson nature of Internet traffic. Up to 20 flows were interacting at once in the network, 15 were TCP and 5 were UDP flows in order to represent the greater percentage of TCP traffic in the Internet. All but the MS were sending and receiving different types of traffic. The core router buffers of the wired network are well provisioned, so no congestion occurs on them.
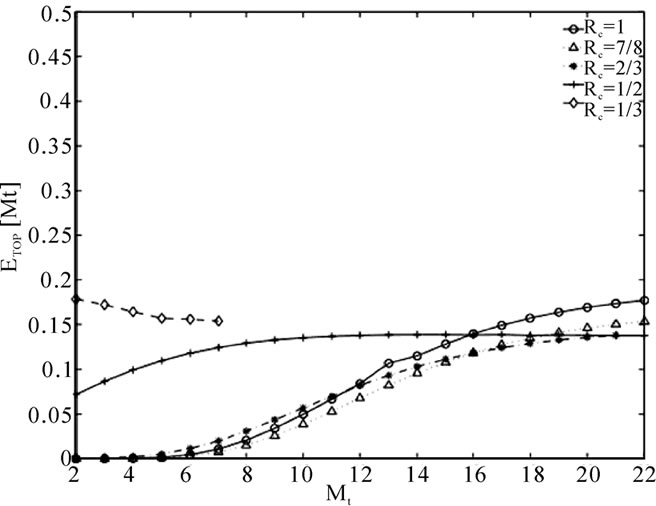
Figure 9. TCP NewReno energy efficiency ETCP [Mt] for gtarget = 1.25dB.
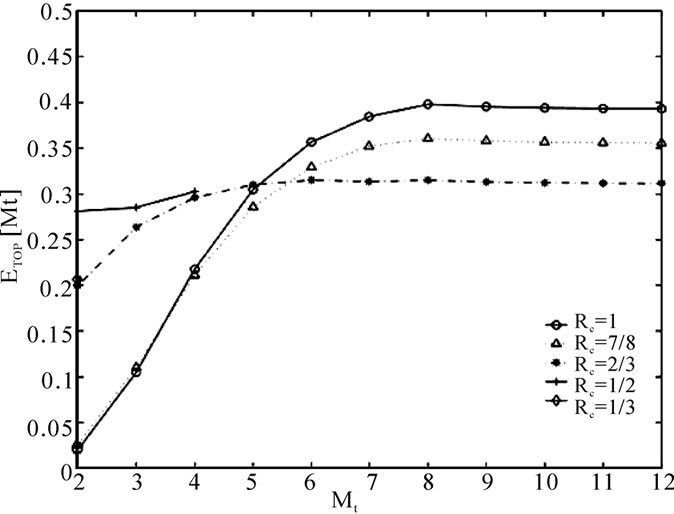
Figure 10. TCP NewReno energy efficiency ETCP [Mt] for gtarget = 2dB.

Figure 11. TCP NewReno energy efficiency ETCP [Mt] for gtarget = 3dB.
Typical required SNR values considered in link budget design of UMTS, for high-rate data and urban environments, are assumed [29]. The 2.4GHz wireless link is experiencing slow fading therefore correlated errors occur in the transmitted PDUs. As the channel fading correlation properties depend directly on the normalised Doppler bandwidth fDt [30], fDt was considered equal to 0.1.

Figure 12. TCP throughput for different multiples of typical buffer size Cxrtt.
The TO duration is set to  in the analytical model, as generally suggested in the literature [17]&[31], whilst tON and tOFF are set equal to 1s.
The following fixed-point approximation is used to initialise the TCP-HARQ model and to measure its performance:
1) The maximum cwnd, TO duration, ETCP[rtt] and ptotal are fed into the TCP model in order to calculate TCP initial arrival rate to the LL and its corresponding throughput (Equations 18 and 19). ETCP[rtt] and ptotal are initiallly considered 2Dwired and 0.01, respectively.
2) The predicted TCP initial arrival rate is input into the HARQ model where the corresponding ptotal and EHARQ[D] are calculated per each set of (Rc,Mt) (Equations 11 and 12).
3) These HARQ performance values are fed back to the NewReno model where the ETCP[rtt] and TCP bit rate are again computed (Equations 17 and 18).
4) This process is repeated until ptotal, ETCP[rtt] and TCP throughput values converge into constant values per each (Rc,Mt) set.
Simultaneously, TCP throughput, ptotal and ETCP[rtt] are monitored in the ns-2 simulations for the (Rc,Mt) sets under different gtarget. These values are compared to those calculated analytically to assess the accuracy of the model.
5.2. TCP-HARQ Performance
The impact of HARQ parameters on TCP performance under gtarget=1.25,2 and 3dB representing high, moderate and low error rates, respectively, is shown in Figures 6–11. The impact of the buffer size on the TCP-HARQ system is shown in Figure 12.
5.2.1. TCP Throughput
High error rates. Under gtarget=1.25dB, the code rates of  and
and  are beneficial to TCP throughput as shown is Figure 6. The rest of the code rates exhibit lower bit rates and similar loss probabilities to the NewReno flow with no-coding. The main factor which negatively affects the performance of the flows with Rc=
  and
and  is that pG and pB (the mean PDU error probabilities in the Good and Bad state) are very high. Therefore, more retransmissions are necessary to successfully transmit a MSS, which translates into higher buffer occupancy, which increases the wired loss probability, pK. On the other hand, with low redundancy (Rc=
 and
and ), the wireless loss probability, pW, is the main factor which causes TCP to recover the lost segments mostly through TOs. As a result of this and of the high service times, the cwnd does not reach its maximum value during the connection causing lower throughput.
All code rates show the same trend: their throughput is improved with an increasing number of retransmissions. However, this gain is not unbounded, it depends on Rc, on the required number of transmissions to successfully send a PDU EPDU[Mt], on the buffer size and, of course, on the available bandwidth. For gtarget=1.25dB, the maximum number of transmissions supported by the HARQ analytical model of a flow without coding or with Rc= is Mt=22. Further retransmissions caused E[SDU]Ct2 (Equation 13) to exhibit complex values because of the high service times in the buffer, i.e. the traffic intensities reach high values due to the high buffer occupancy times. The flow with Rc=
 also presented complex values but they appeared for lower persistance levels, Mt=7, and due to the high traffic intensities caused by the high code rate. In the cases of complex values in the analytical model, their simulation counterparts exhibited lower throughputs given that the high ptotal caused TCP to recover the lost MSSs through mostly TOs.
The TCP connection whose PDUs are encoded with Rc= shows the maximum achievable throughput, 19 MSS/s, for the 22nd transmission; higher retransmissions do not increase its MSS rate. This occurs because the required number of transmissions to successfully send a PDU, EPDU[Mt], becomes quasi-constant for
 , as do the service times. Then, pK also shows quasi-constant values, which causes a similar number of dropped segments for
 . In this specific connection, for low persistance levels, TOs are due to mainly pW whilst FRs rarely occur. In contrast, corruptive losses are increasingly recovered by FRs and those congestive by TOs as Mt increases, i.e. as a result of the high number of retransmissions needed to successfully send a segment, the traffic intensity grows causing pK to also grow. Then, the buffer discards arriving segments of the same cwnd in such a manner that they can only be recovered by TOs. The importance of considering a finite buffer size can be understood through this close interrelation between pK and pW, which will dictate TCP-HARQ system performance.
Since the maximum achievable throughput of Rc= is 14 MSS/s for Mt=7, the optimal parameters which provide the highest NewReno throughput for gtarget=1.25dB are Rc =
 , Mt=22.
Moderate error rates. The impact of moderate error rates on NewReno performance can be clearly seen in Figure 7. In contrast to the previous case, the maximum throughput is achieved with a significant lower number of retransmissions, Mt=8 and no-coding. More retransmissions do not translate into higher throughputs because, as explained previously, EPDU[Mt] is almost invariable for .
.
Even when the highest receiving MSS rate is significantly higher than that under gtarget=1.25, it represents roughly 40% of the available bandwidth. In this case, a higher number of MSS is recovered by FRs because of the lower pW. However, the TOs caused by pK appear for lower persistance levels than in the case of gtarget=1.25dB. Better channel quality causes lower required retransmissions per PDU, EPDU[Mt], which subsequently causes lower rtt. This lower rtt makes TCP behave more aggressively: its cwnd increases rapidly causing higher input traffic rates in the buffer and a higher pK. Since TCP has to implement multiple FRs and TOs to recover losses, its sending MSS rate is continuously reduced. This reduction causes low pK which together with low pW, allow again, the rapid cwnd growth which leads to early throughput oscillations and, ultimately, a reduction in the average throughput.
In Figure 7, the flow with Rc= exhibits a higher throughput up to Mt=7, however its rate growth is bandwidth bounded for Mt=8. In this specific case, the redundant bits are having a negative impact on the throughput. The performance gain of adapting HARQ parameters according to the SNR instead of using fixed-settings is obvious. If instead of selecting the optimal parameters for gtarget=2dB, (Rc=1,Mt=8), fixed-setings were used, e.g. Mt=4 (Long Retry Limit in WLANs), Rc=
 will provide the best possible performance. However, this will exhibit a lower throughput (22MSS/s) than that given by HARQ with adaptive parameters (31 MSS/s).
Low error rates. For gtarget=3dB, it is clear from figure 8 that the maximum NewReno throughput has increased, compared to the previous two cases, using fewer retransmissions. The highest receiving MSS rate shows a growth of 130% and 40% compared to those of gtarget=1.25 and 2dB, respectively.
As expected, the flow, which performs best, is that with no-coding. It reaches its best throughput for Mt=6. The throughput shows negligible gain above this value due to the almost invariable EPDU[Mt]. The average throughput represents 50.25% of the available radio link bandwidth. The performance is mainly affected by congestion, that is, the buffer size and, in the case of the rest of the flows, the high degree of redundancy. The MSSs discarded by the LL buffer are recovered mostly through TOs whilst fewer FRs due to pW take place because of the optimal SNR of the wireless link.
From these results, we can say that TCP connections over wireless links exhibiting high error rates need the implementation of both error control schemes, i.e. both high FEC coding and ARQ. For moderate and low error rates, the sole use of ARQ improves NewReno performance. In addition, the adaptive selection of the code rate and the number of retransmissions will provide higher TCP improvement than that of HARQs with fixed-settings.
5.2.2. TCP Energy Efficiency
The NewReno energy efficiencies, ETCP[Mt], are shown in Figures 9–11 where it is observed that the efficiency increases with the number of retransmissions. This occurs because increasing the ARQ retransmissions hide more losses from TCP, which decreases the number of TCP retransmissions. However, above a certain number of retransmissions, ETCP[Mt] becomes almost invariable as ptotal shows negligible change due to the quasi-constant EPDU[Mt] and the finite buffer size. As expected, the higher gtarget, the better ETCP[Mt].
Interestingly, the NewReno flow with Rc= exhibits a different trend in Figure 9. It initially has a better ETCP[Mt] which decreases with the number of retransmissions. Since its pW is lower due to the effect of the coding, the average number of retransmissions per PDU is lower than that of the rest of the flows. This triggers a better use of the link spectrum. However, increasing Mt raises pK and its resulting ptotal due to the negative impact of Rc which causes a greater number of losses to be recovered by TCP. The flow which achieves the highest radio channel efficiency in Figure 9 is that with no-coding and Mt=22 which are not the optimal HARQ parameters selected previously. In contrast, for moderate and low error rates, the HARQ parameters providing the highest throughput also provide the best use of the wireless link bandwidth as shown in Figures 10 and 11. Again, the advantages of adaptive HARQ settings are demonstrated for this cross-layer scheme.
5.3. Impact of Buffer Size
The impact of buffer size on the performance of TCPHARQ system is shown in Figure 12. Different multiples of the buffer size were tested with the optimal HARQ parameters previously selected for each gtarget, i.e. gtarget=1.25dB: (Rc= ,Mt=22), gtarget=2dB: (Rc=1,Mt=8) and gtarget=3dB: (Rc=1,Mt=6).
In the case of gtarget=1.25dB, it is only possible to increase the buffer size (Cxrtt) by 45%, otherwise the model presents complex values. It can be seen that the analytical model predicts similar TCP throughput for buffer sizes in the order of 0.35Cxrtt. Nevertheless, the throughput of the ns-2 simulations shows lower values with this buffer capacity. The MSS rate of the simulations reaches the optimal value of (Rc= ,Mt=22) for buffer sizes of 0.70Cxrtt. Therefore, even when the buffer capacity is not reduced as dramatically as predicted, it can be safely reduced by 30% without detriment to TCP throughput.
For gtarget=2dB, the analytical throughput is equal to the optimal given by (Rc=1,Mt=8) for buffer capacities in the order of 0.50Cxrtt. The simulations exhibit this behaviour for buffer sizes of 0.60Cxrtt. The difference between the mathematical and the simulated throughput is lower in this case. Incrementing the buffer capacity does not contribute to an improvement in the throughput given the higher buffer occupancy times of these larger buffers.
For gtarget =3dB, the predicted TCP throughput is equal to the optimal of (Rc=1,Mt=6) for buffer sizes of 0.45Cxrtt. Simulations exhibit the optimal throughput with buffer capacities of 0.60Cxrtt. Increasing the typical buffer size in these conditions results in MSS rate reduction which differs from the previous case, gtarget=2dB, where no throughput change was exhibited. This occurs because, under gtarget=3dB, pK significantly increases with respect to pW. Therefore, more TOs occur which compromise the throughput.
It has been demonstrated that, in this TCP-HARQ analytical scheme, higher buffer sizes do not provide lower wired loss probabilities because of the high traffic intensities. However, LL buffer sizes can be safely reduced in the order of 30-40% of the traditional buffer sizes according to the current SNR of the radio channel. Better transmission conditions lead to higher capacity reductions. A decrease in the buffer capacity not only saves buffer memory but also causes lower delays (which is of particular importance if multimedia applications are to be sent through the buffer). Furthermore, these results agree with those of [32] where it is stated that router buffers can be reduced. Even though [32] refers to buffers in core networks, the results here have shown that, in the case of this HARQ-TCP system, it can also apply for egress links. However, it is necessary to analyse typical traffic patterns of the particular link.
6. Conclusions
The accuracy and correctness of the analytical model of the TCP-HARQ system predictions is demonstrated even with the number of assumptions made in the development of HARQ and TCP characterisations. In particular, the assumptions of the two different loss models assumed in the link and transport layers: HARQ is modelled under the assumption of correlated losses due to a slow fading channel whilst losses detected by TCP are modelled as Bernoulli losses. Thus, the use of HARQ randomises the correlated losses of the radio channel and makes them appear independent at the TCP level.
It was also shown that the optimal code rate and persistence level depend on the wireless channel error rate. The use of a truncated HARQ improves TCP NewReno throughput over a radio link experiencing high channel error rates, whilst the use of little or no redundancy and truncated ARQ provides throughput enhancement for TCP flows over links experiencing moderate or low error rate. For these types of link it is also possible to achieve the best usage of the wireless bandwidth if optimal HARQ settings are used. In addition, a HARQ system, which dynamically selects optimal parameters, will provide higher throughput improvement than that of a HARQ with fixed-settings.
Higher improvement is shown in other works (e.g. [15] or [17]) since they do not consider a finite buffer size, something which does impact performance. As the SNR of the wireless channel increases, the congestive losses increasingly dictate the total loss probability of the system. Even for connections with optimal radio channel quality, the rapid growth of the cwnd causes high wired loss probabilities in the buffer. As a result, a higher percentage of lost segments is recovered by TCP retransmissions with a subsequent reduction in the average throughput.
Further, it was shown that LL buffer sizes can be reduced by 30-40% with respect to the typical size, according to the current SNR, without detriment to TCP NewReno throughput.
Since it is assumed that the LL has information about the transmission quality of the radio channel, cross-layer communication has to take place between the physical and link layers. As it is also considered that the top-down TCP explicit notification contains information about the delay in the wired section of the network, further cross-layer communication involving the routers in the TCP connection path also occurs. In addition, if mechanisms such as IP QoS routing are implemented on the wired links, the TCP performance predictions computed by the LL entity will be more precise, i.e. if the TCP connection over the wired link is required to not exceed certain delay bounds, Dwired will be more accurate. Thus, the importance of cross-layer communication schemes in the improvement of network performance can be understood.
The model presented sets an analytical framework and future work can consider the impact of adaptive modulation schemes and IP QoS routing on the TCP NewReno-HARQ system, as well as the adequacy of the model for different network topologies and several mobile nodes.
7. Acknowledgements
N. L. Ewald-Arostegui was funded by the National Council on Science and Technology of Mexico under grant 131801.
8. References
[1] K. Pentikousis, “TCP in wired-cum-wireless environments,” IEEE Communications Surveys and Tutorials, Vol. 3, pp. 2–14, 2000.
[2] F. Hu and N. K. Sharma, “Enhancing wireless internet performance,” IEEE Communications Surveys and Tutorials, Vol. 4, pp. 2–15, 2002.
[3] Y. Tian, K. Xu, and N. Ansari, “TCP in wireless environments: Problems and solutions,” IEEE Transactions on Mobile Communications, Vol. 43, pp. S27–S32, 2005.
[4] B. Sardar and D. Saha, “A survey of TCP enhancements for last-hop wireless networks,” IEEE Communications Surveys and Tutorials, Vol. 8, pp. 20–34, 2006.
[5] K. C. Leung and V. O. K. Li, “Transmission control protocol TCP in wireless networks: Issues, approaches, and challenges,” IEEE Communications Surveys and Tutorials, Vol. 8, pp. 64–79, 2006.
[6] M. Allman, V. Paxson, and W. Stevens, “TCP congestion control,” IETF RFC 2581, 1999.
[7] S. Floyd, T. Henderson, and A. Gurtov, “The newreno modification to TCP’s fast recovery algorithm,” IETF RFC 3782, 2004.
[8] A. Medina, M. Allman, and Sally Floyd, “Measuring the evolution of transport protocols in the internet,” ACM SIGCOMM Computer Communications Review, Vol. 35, pp. 37–51, 2005.
[9] A. Kumar, “Comparative performance analysis of versions of TCP in a local network with a lossy link,” IEEE Transactions on Networking, Vol. 6, pp. 485–498, 1998.
[10] A. Abouzeid, R. Sumit, and A. Murat, “Comprehensive performance analysis of a TCP session over a wireless fading link with queuing,” IEEE Transactions on Wireless Communications, Vol. 2, pp. 344–356, 2003.
[11] M. Rossi, R. Vicenzi, and M. Zorzi, “Accurate analysis of TCP on channels with memory and finite round-trip delay,” IEEE Transactions on Wireless Communications, Vol. 3, pp. 627–640, 2004.
[12] A. Kumar and J. Holtzman, “Comparative performance analysis of versions of TCP in a local network with a mobile radio link,” Indian Academy of Science Proceedings in Engineering Sciences, Sadhana, pp. 1–22, 1998.
[13] H. Chaskar, T. V. Lakshman, and U. Madhow, “TCP over wireless with link level error control: Analysis and design methodology,” IEEE Transactions on Networking, Vol. 7, pp. 605–615, 1999.
[14] C. F. Chiasserini and M. Meo, “A reconfigurable protocol setting to improve TCP over wireless,” IEEE Transactions on Vehicle Technology, Vol. 51, pp. 1608–1620, 2002.
[15] L. Le, E. Hossain, and T. Le-Ngoc, “Interaction between radio link level truncated ARQ, and TCP in multi-rate wireless networks: A cross-layer performance analysis,” IET Communications, Vol. 1, pp. 821–830, 2007.
[16] C. Barakat and A. A. Fawal, “Analysis of link-level hybrid FEC/ARQ-SR for wireless links and long-lived TCP traffic,” Performance Evaluation, Vol. 57, pp. 453–476, 2004.
[17] F. Vacirca, A. De Vendictis, and A. Baiocchi, “Optimal Design of Hybrid FEC/ARQ schemes for TCP over Wireless Links with Rayleigh Fading,” Transactions on Mobile Computing, Vol. 5, pp. 289–302, 2006.
[18] C. Barakat and E. Altman, “Bandwidth tradeoff between TCP and link-level FEC,” Computer Networks, Vol. 9, pp. 133–150, 2002.
[19] J. Sarkar, S. Sengupta, M. Chatteerjee, and S. Ganguly, “Differential FEC and ARQ for radio link protocols,” IEEE Transactions on Communications, Vol. 55, pp. 1458–1472, 2006.
[20] N. L. Ewald and A. H. Kemp, “Performance analysis of link-layer hybrid ARQ with finite buffer,” Proceedings of IEEE PIMRC, Cannes, pp. 1–5, 2008.
[21] J. G. Proakis, “Digital communications,” 4th Edition, McGraw Hill, 2001.
[22] V. Parson and S. Floyd, “Wide area traffic: The failure of Poisson modelling,” IEEE Transactions on Networking, Vol. 3, pp. 226–244, 1995.
[23] J. Cao, W. S. Cleveland, D. Lin, and D. X. Sun, “Internet traffic tends toward poisson and independent as the load increases,” Nonlinear Estimation and Classification, Lectures Notes in Statistics, Springer, Berlin, pp. 83–110, 2003.
[24] J. Cao and K. Ramanan, “A poisson limit for overflow probabilities,” Proceedigns of IEEE INFOCOM, Las Vegas, pp. 994–1003, 2002.
[25] G. Raina and D. Wischik, “Buffer sizes for large multiplexers: TCP queueing theory and instability analysis,” in: Proceedings of NGI’ 05, Rome, pp. 173–180, 2005.
[26] J. M. Smith, “Optimal design and performance modelling of M/G/1/K queueing systems,” Mathematical and Computer Modelling, Vol. 39, pp. 1049–1081, 2004.
[27] N. L. Ewald and A. H. Kemp, “Analytical model of TCP NewReno through a CTMC,” Proceedings of EPEW 09, Lecture Notes in Computer Science, Springer, Berlin, pp. 183–196, 2009.
[28] W. K. Grassmann, M. I. Taksar, and D. P. Heyman, “Regenerative analysis and steady state distributions for markov chains,” Operations Research, Vol. 33, pp. 1107– 1116, 1985.
[29] H. Holma and A. Toskala, Ed., “WCDMA for UMTS radio access for third generation mobile communications,” 2nd Edition, Wiley, 2002.
[30] M. Zorzi, R. R. Rao, and L. B. Milstein, “On the accuracy of a first-order Markov model for data transmission on fading channels,” Proceedings of IEEE ICUPC’95, pp. 211–215, 1995.
[31] C. Casetti and M. Meo, “Modeling the stationary behaviour of TCP Reno connections,” Proceedings of International Workshop QoS-IP, pp. 141–156, 2001.
[32] Y. Ganjali and N. McKeown, “Update on buffer sizing in internet routers,” ACM SIGCOMM Computer Communications Review, Vol. 36, pp. 67–70, 2006.