Journal of Intelligent Learning Systems and Applications
Vol.5 No.3(2013), Article ID:35392,9 pages DOI:10.4236/jilsa.2013.53016
Application of Neural Networks to Matlab Analyzed Hyperspectral Images for Characterization of Composite Structures
![]()
Faculty of Science and Information Technology, Department Computer Science, Al-Zaytoonah University of Jordan, Amman, Jordan.
Email: m.iskandarani@hotmail.com
Copyright © 2013 Mahmoud Z. Iskandarani. This is an open access article distributed under the Creative Commons Attribution License, which permits unrestricted use, distribution, and reproduction in any medium, provided the original work is properly cited.
Received February 13th, 2013; revised March 13th, 2013; accepted March 20th, 2013
Keywords: Hyperspectral; PVT; Image Analysis; Damage Detection; Classification; Neural Networks; WEA
ABSTRACT
A novel approach to damage detection in composite structures using hyperspectral image index analysis algorithm with neural network modeling employing Weight Elimination Algorithm (WEA) is presented and discussed. The matrix band based technique allows the monitoring and analysis of a component’s structure based on correlation between sequentially pulsed thermal images. The technique produces several matrices resulting from frame deviation and pixel redistribution calculations with ability for prediction. The obtained results proved the technique to be capable of identifying damaged components with ability to model various types of damage under different conditions.
1. Introduction
Advanced layered composite materials are in wide use in many applications. Fiber reinforced composites with polymeric matrices (FRP or laminates) and polymeric sandwich materials, with thin laminate faces and foam or impregnated cores, are examples of such structures. The structural design and maintenance of composite structures involving these materials need comprehensive evaluation and characterization of mechanical properties and behavior under different loading conditions, in both undamaged and damaged state. The marked inhomogeneity and anisotropy of these materials makes them vulnerable to a variety of damages. For this reason, reliable composite structures need adequate NDT/NDE methods along the maintenance activities and knowledge of residual strength/stiffness or service life estimation linked to certain damage patterns. In the end, development of damage tolerant materials may be considered a goal towards further increasing the attractiveness of composite materials in building high tech reliable products.
Pulse Video Thermography (PVT) is a versatile NDT inspection method, ready to be used in industrial applications assisted by intelligent software for this purpose.
The subjected material reacts rapidly after the initial thermal pulse because the thermal front propagates, by diffusion, under the surface and also because of radiation and convection losses. The presence of a defect reduces the diffusion rate so that when observing the surface temperature, defects appear as areas of different temperatures with respect to surrounding sound areas once the thermal front has reached them. Consequently, deeper defects will be observed later and with a reduced contrast. Such approach is common in the automotive industry. Other common applications of the active PVT scheme are in quantitative subsurface defect assessment (cracks, delaminations, impact damages, disbondings, moisture), thermophysical property evaluation; in all kind of industries [1-5].
In hyperspectral image analysis approach, image fusion which is the process of combining relevant information from two or more images into a single image takes place. The resulting image will be more informative than any of the input images.
The image fusion techniques allow the integration of different information sources. The fused image can have complementary spatial and spectral resolution characteristics. Such techniques are usually used in satellite imaging; where two types of images are available. The panchromatic image acquired by satellites is transmitted with the maximum resolution available and the multispectral data are transmitted with coarser resolution. This will usually be two or four times lower. At the receiving end, the panchromatic image is merged with the multispectral data to convey more information [6-10].
In this paper the hyperspectral approach is adopted to detect and analyze damage in composite structures. The adaption of the technique is to assume the high resolution panachromatic image (PAN) to be the reference image while the image of the damaged component to be the low resolution multispectral image (MS).
2. Background
As composite materials are finding increasing use in more demanding applications, requiring a high degree of accuracy and reliability, considerable effort is being made to define and setup quality control procedures and inspection methods. Controlling the quality of raw composite materials is carried out to detect the following:
1) Excessive void contents or porosity.
2) Contamination or foreign particle inclusions 3) Variation in the degree of resin cure 4) Inconsistent fiber volume fraction 5) Dimensional inaccuracies 6) Poor fiber-matrix bonding 7) Broken or damaged fibers.
A composite structure may also be damaged in service due to physical damage such as impact or fatigue creep. The influence of the environment on a structure due to ingress or moisture, exposure to hot and wet conditions for over long periods, contamination from oils or fluids may also cause damage, like surface abrasion and dents, delamination, fiber crack, bonding failure. Such defects are all potentially detrimental to the mechanical integrity, and consequently to the structural performance of a component. The extent to which a defect will affect the performance will depend on the geometry of the structure, the location and orientation of the defect, the type of applied stress field and the working environment.
Confidence in the application of safety critical structural composites in vehicles would be improved if a fast accurate method of assessing manufacturing flaws and service damage in relation to the structural engineering performance was available. A perceived problem with composite structures is that internal damage may seriously weaken a structure yet be undetected due to little surface evidence.
Infrared thermography has been used as an outstanding non-destructive testing method. Its basic principle is exciting an object thermally/mechanically and using infrared camera to monitor changes of the object’s surface temperature. The subsurface discontinuities will heat diffusion, thus will affect the thermal distribution of the surface. Various excitation sources can be used, such as cold/hot air, high-powerful lamps and flashes, sonic/ultrasound transducers, and others. There are also different heating techniques. Modulated and pulsed heating are among the most popular ones. There are two modes for thermography, one where the specimen is heated from one side, with thermal data is collected from the same side, called reflection mode, and the other where the specimen is heated from one side, while thermal data is collected from the opposite side, called transmission mode.
In almost all application areas, the basic goal of hyperspectral image analysis is to classify or discriminate objects. Common problems in the area of hyperspectral analysis involving data relevancy include optimal selections of wavelength, number of bands, and spatial and spectral resolution. Despite the fact that hyperspectral image analysis is used to perform index analysis in hyperspectral and multispectral satellite imagery, it is assumed that it can be used for image comparison of similar or processed images, of completely different origin [11-15].
As there is a need to identify which type of composite a component under test belongs to specific category, the technique will enable the used algorithm to determine if the level of damage or defect in the component is critical according to established database that takes into account mechanical and physical factors, Testing different composite structures using Hyperspectral technique and Pulse Video Thermography (PVT) is carried out, as hyperspectral uses different bands with different wavelengths to analyze the image results, which enables better recognition and classification. This resulted in successful recognition and component classification obtained with characterization of tested composite [16-20].
3. Method
While hyperspectral data are very rich in information, processing the hyperspectral data poses several challenges regarding computational requirements, information redundancy removal, relevant information identification, and modeling accuracy.
Driven by classification or discrimination accuracy, it is expected that, as the number of hyperspectral bands increases, the accuracy of classification should also increase. Nonetheless, this is not always the case in a developed model.
Redundancy in data can cause convergence instability of models. Furthermore, variations due to noise in redundant data propagate through a classification or discrimination model. The same is true of spectral information that has no relation to the feature being classified in the underlying mathematical model. Such information is the same as noise to any statistical model, even if it is unique and accurate.
Thus, processing a large number of hyperspectral bands can result in higher classification inaccuracy than processing a subset of relevant bands without redundancy.
The novel approach of using Hyperspectral technique applied to PVT of images coupled with neural networks algorithm is an excellent system to overcome the previous weakness in image analysis and classification. The algorithm used to implement such an approach in classifying and predicting damage level is carried out using Weight Elimination Algorithm (WEA), which is a bidirectional Bottom-Up, Top-Down pruning algorithm. It starts with a simple, then complex network and drives unnecessary weights during training towards zero as follows:
1) The neural network is built constructively (BottomUp), where its size and complexity are modified (TopDown) to achieve a stable network with error below a pre-defined initial value.
2) The training patterns are scaled within controllable values to prevent oscillations.
3) The network is subjected to various patterns during training with constant recording of weights and removal of any connections that might contribute to bad classification and generalization, then redistribution of removed connection weights among the rest of the interneuron connections.
4) The overall number of actively connected neurons in the hidden layer is reduced during the process, due to weight and bias eliminations.
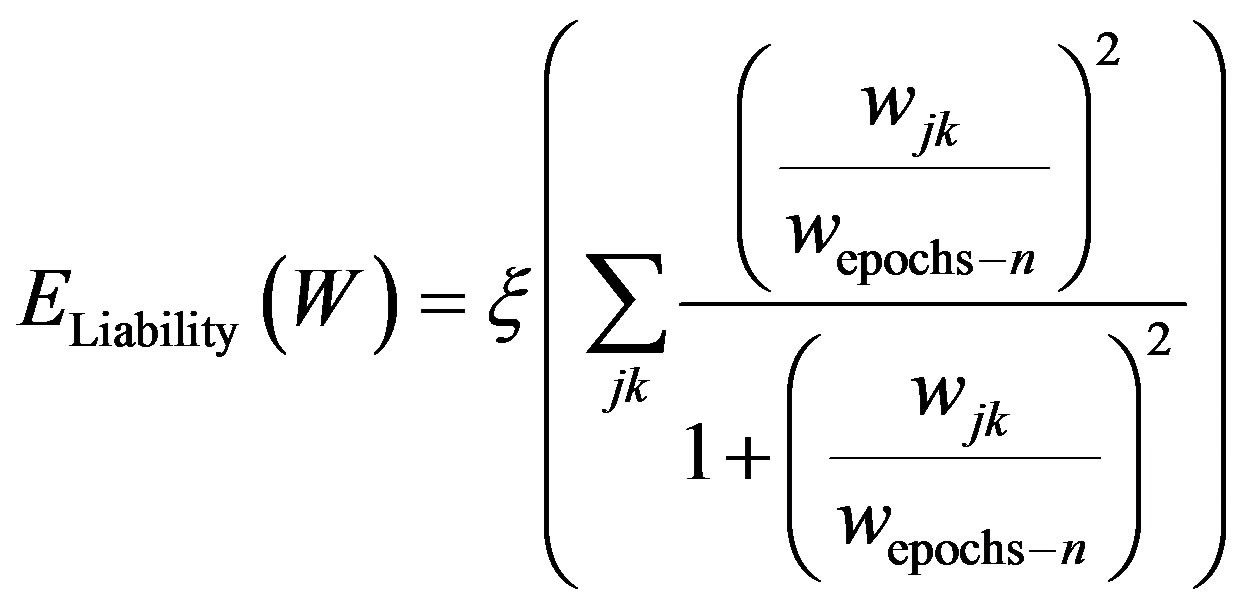
5) The WEA makes use of a liability function that is based on the error function. By reducing the number of connection weights and hence the model’s complexity using the weight-elimination liability term, it is expected that network’s classification performance to improve.
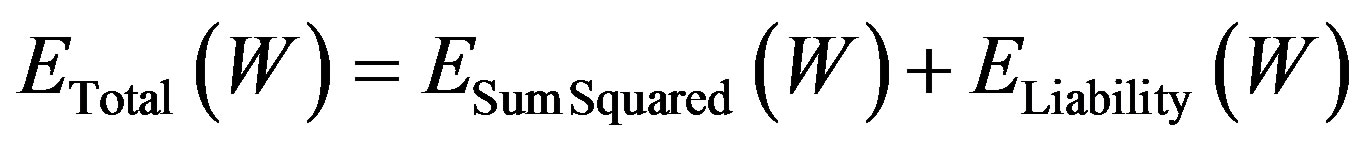
The weight-elimination overhead function is shown in Equation (1). The liability term in weight-elimination minimizes the sum of performance error and the number of weights using standard back propagation technique.
 (1)
(1)
 is the combined overhead function that includes the initial overhead function,
  and the weight-elimination term
 .
.
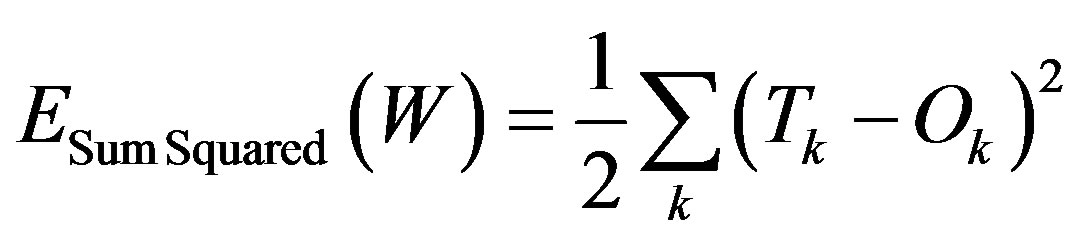 (2)
(2)
where:
 : Target Output
 : Actual Output
 (3)
(3)
Hence;
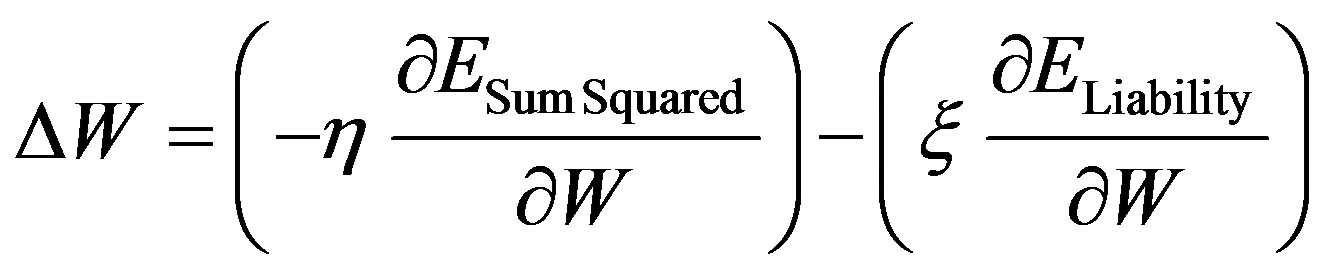 (4)
(4)
where
 : Learning Rate (between 0 and 1)
W represents the weight vector,  is the weight-reduction factor, and
  represents the individual weight of the neural network model.
The role of the weight-reduction factor is to determine the relative importance of the weight-elimination term. Larger values of  pushes small weights to further reduce their size. Small values of
  will not affect the network.
The scale parameter,  , is a scale parameter computed by the WEA, and chosen to be the smallest weigh from the last epoch or set of epochs to force small weights to zero [21-26].
4. Experimental Arrangements
Figure 1 shows the experimental setup for testing the composite structures using PVT.
An algorithm is used to compute hyperspectral indices with emphasis on image deviation. The purpose of the used program is to provide such index results in a matrix format and apply matrix analysis techniques to indentify and classify composites.
Table 1 shows the types of samples under test.
Figures 2-5 show composite structure thermal images for sample1.
Figures 6-9 and Figures 10-13 show a set of images for samples 2 and 3.
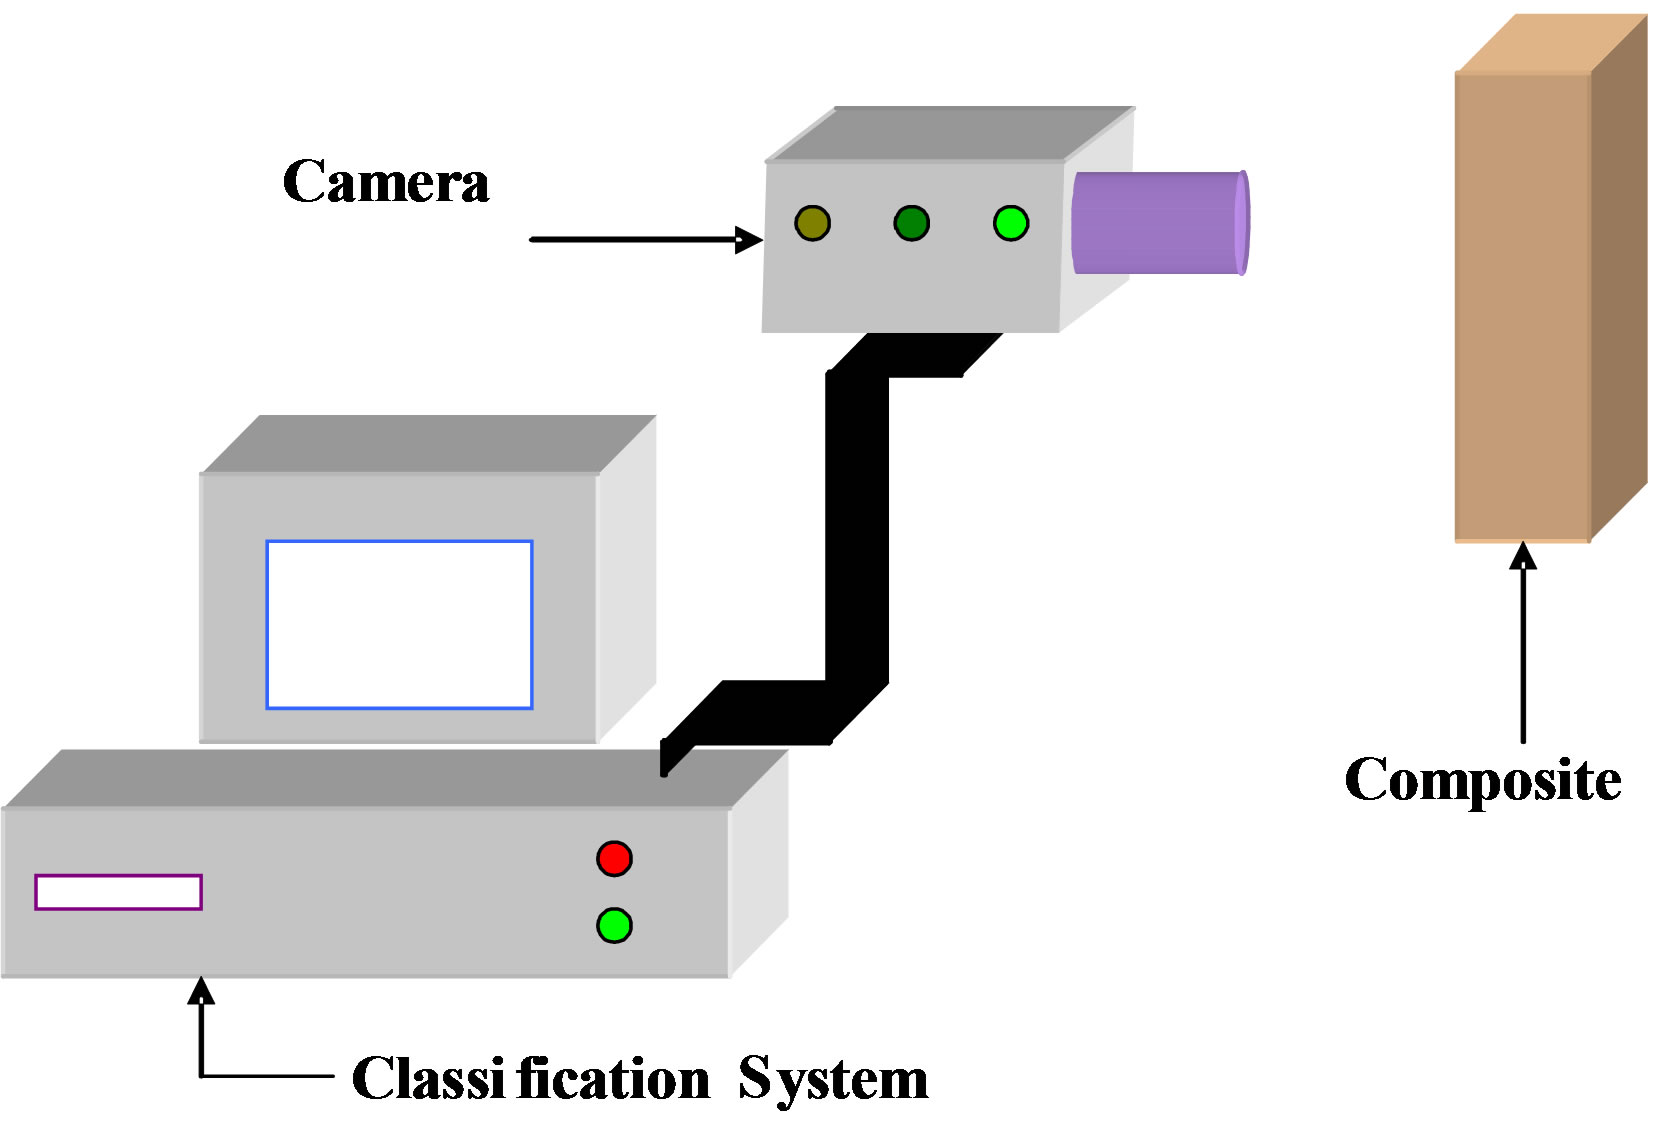
Figure 1. Experimental set up.
Table 1. Tested component types.
Figure 2. Sample 1 thermal image at 4.39 S.
Figure 3. Sample 1 thermal image at 13.39 S.
Figure 4. Sample 1 thermal image at 18.39 S.
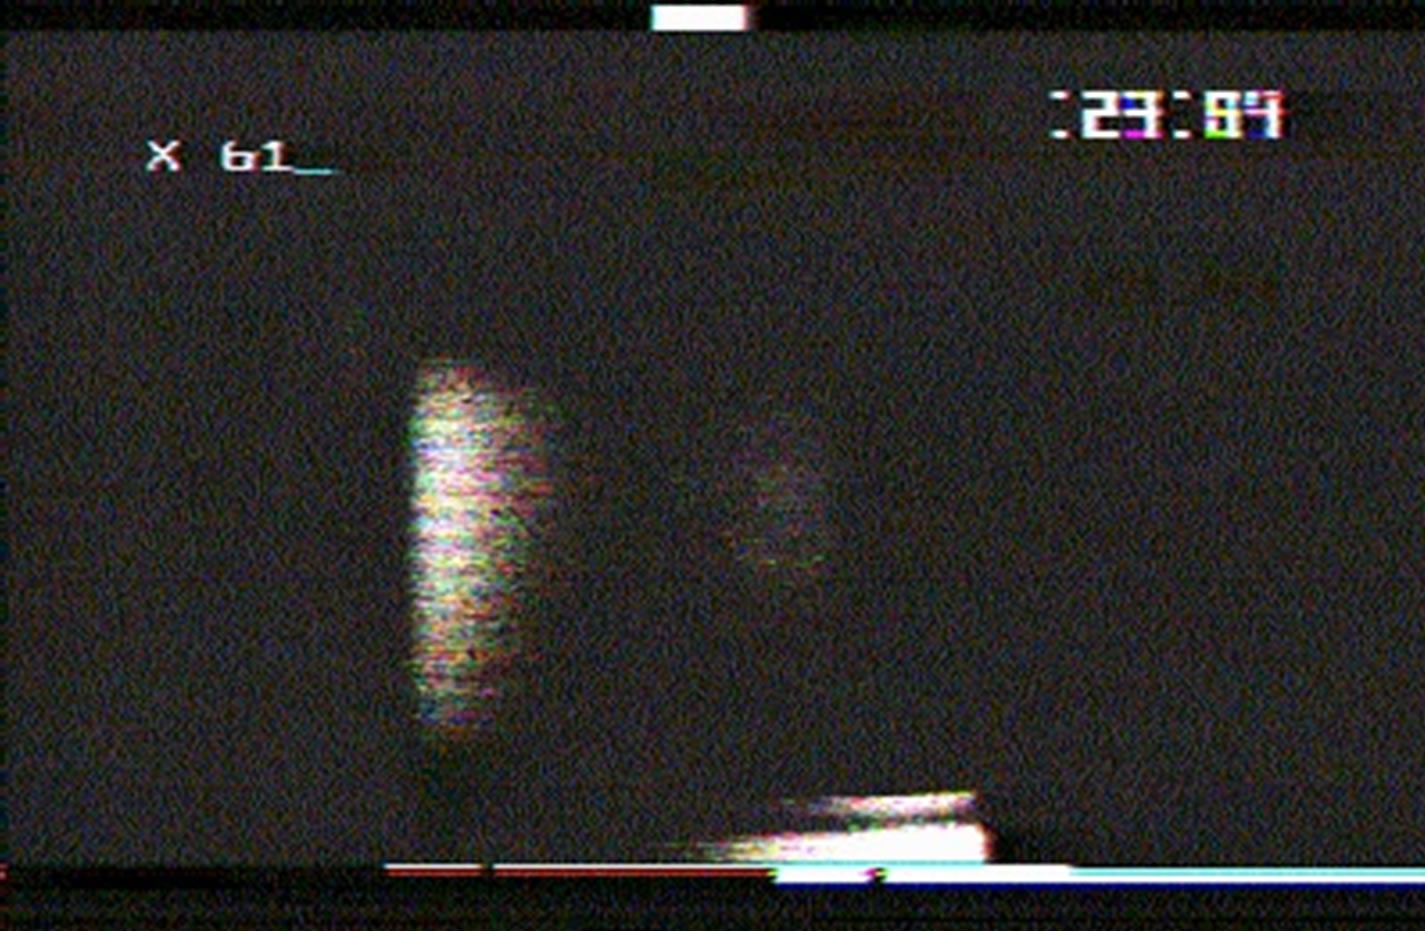
Figure 5. Sample 1 thermal image at 23.39 S.
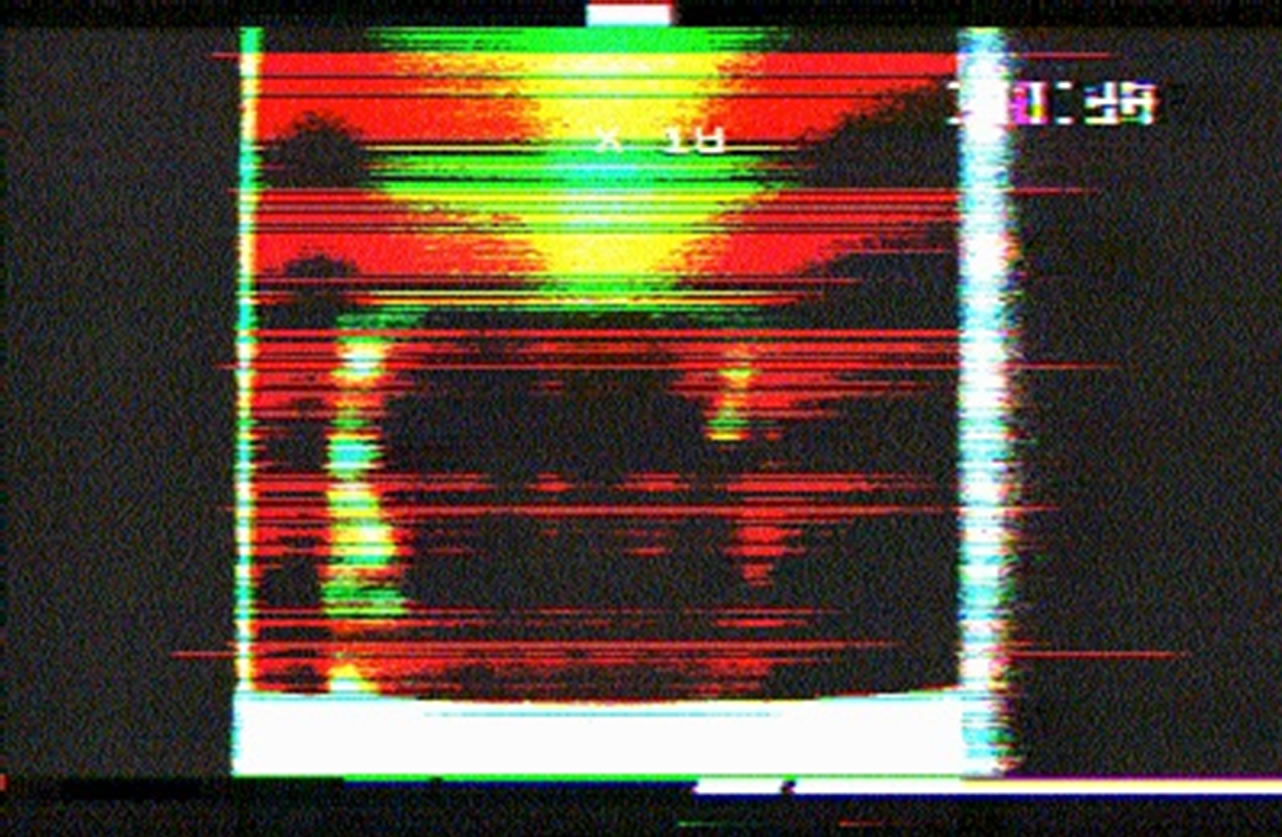
Figure 6. Sample 2 thermal image at 1.34 S.
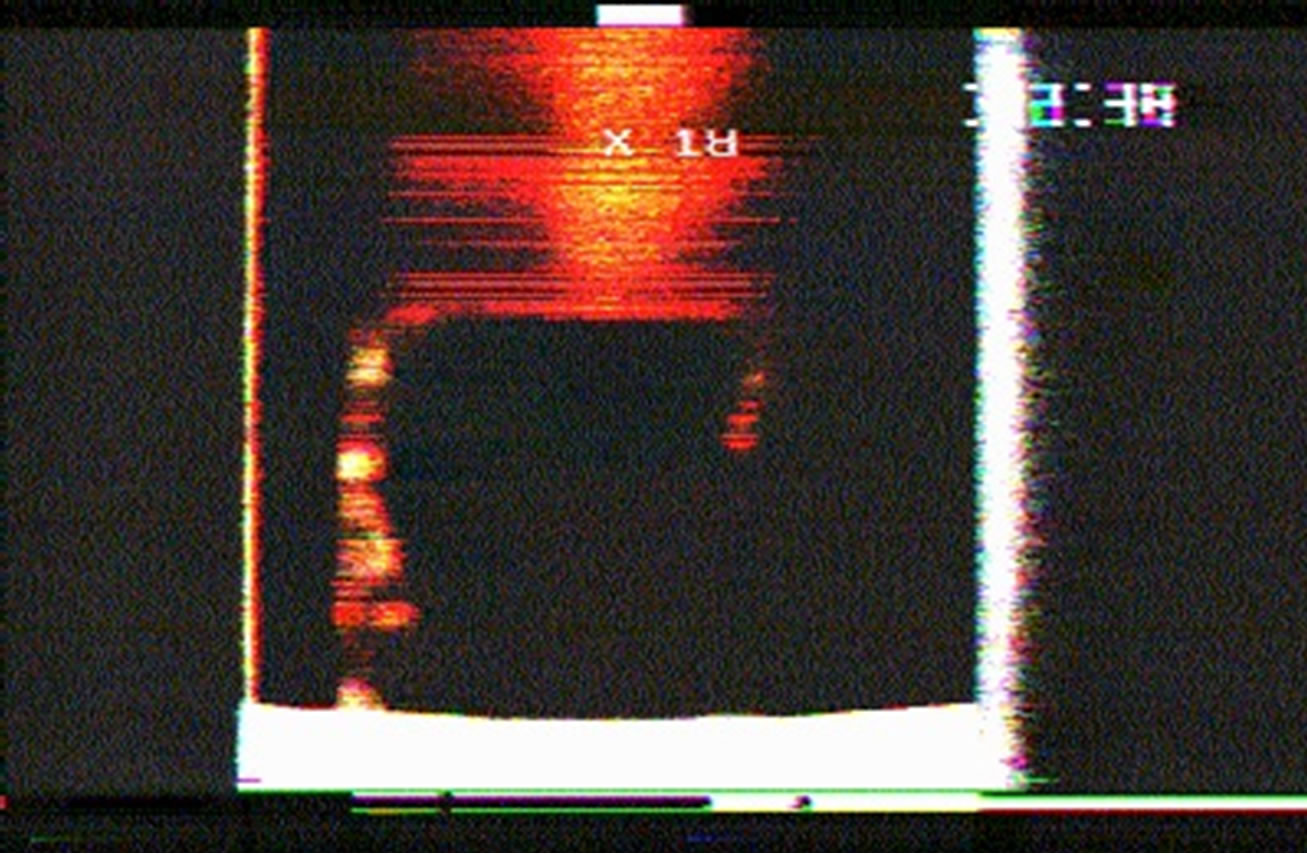
Figure 7. Sample 2 thermal image at 2.34 S.
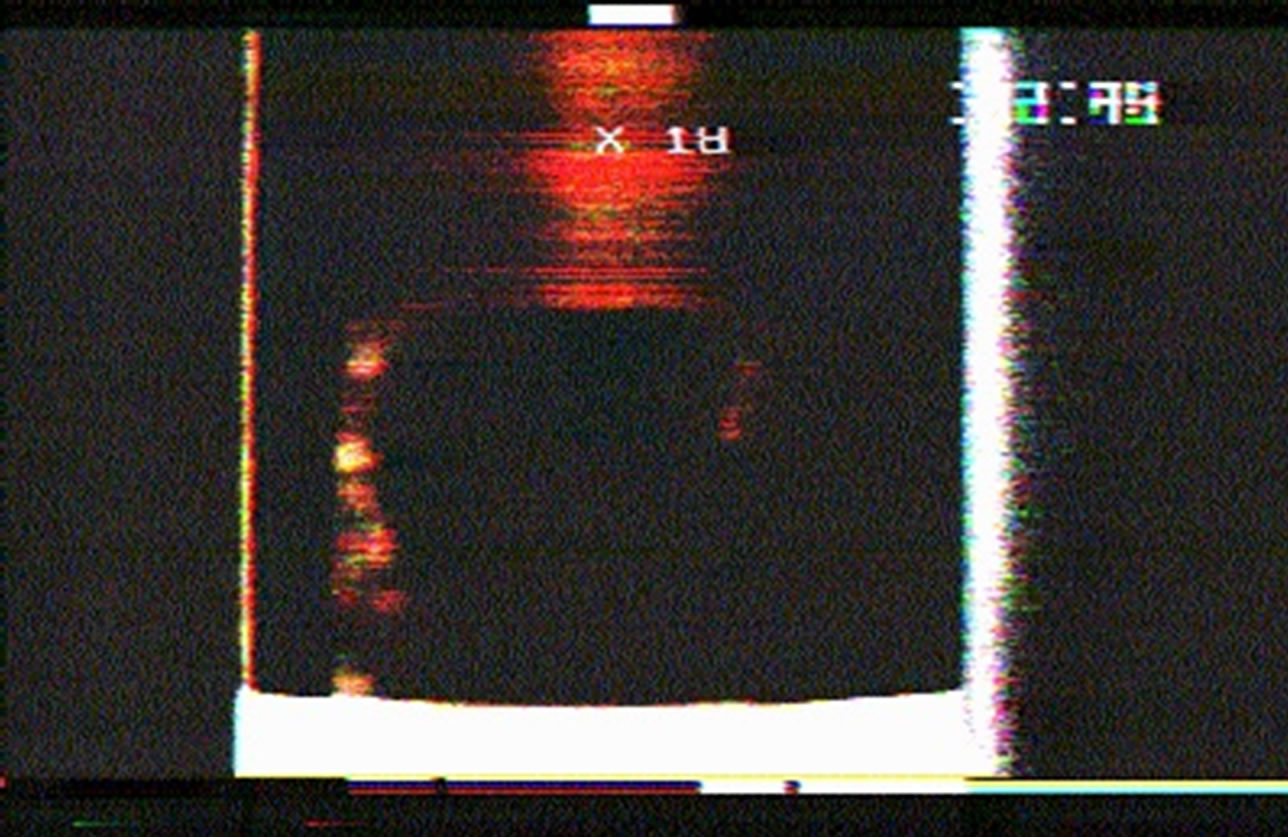
Figure 8. Sample 2 thermal image at 2.39 S.

Figure 9. Sample 2 thermal image at 4.24 S.
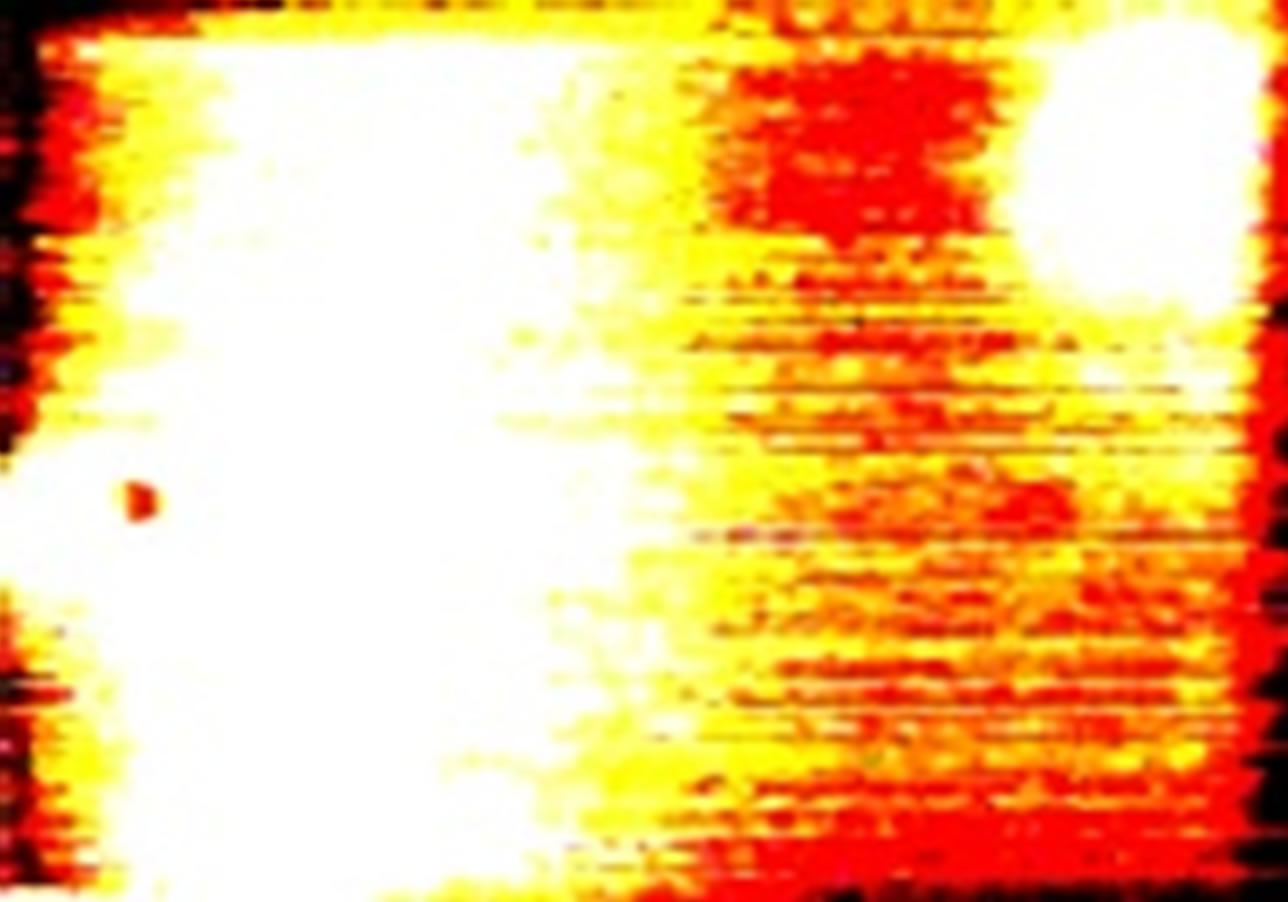
Figure 10. Sample 3 thermal image at 2.39 S.
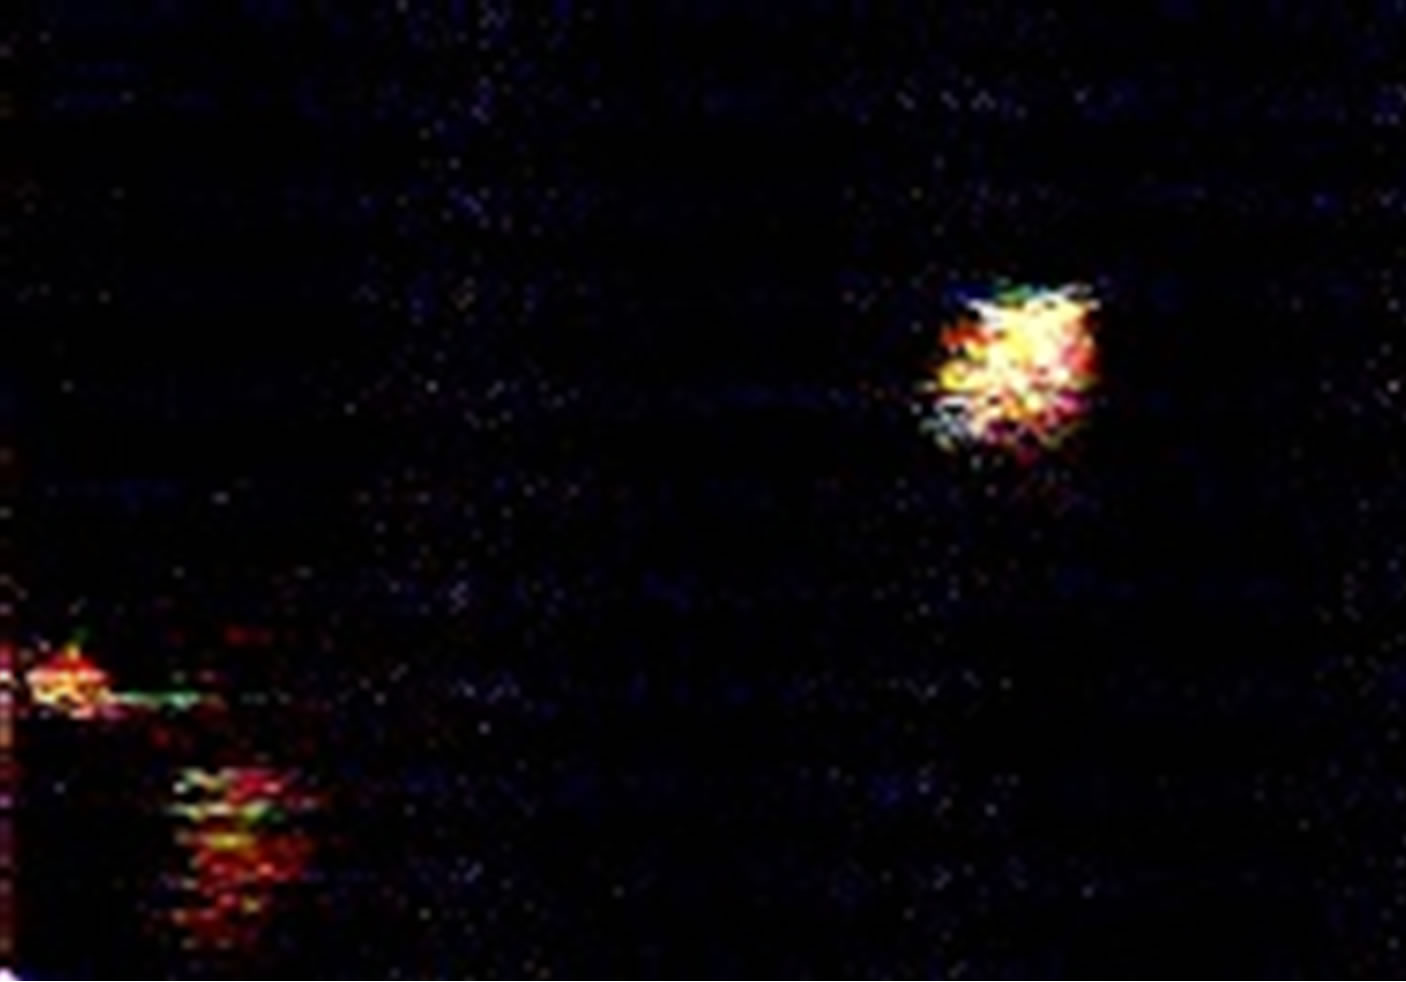
Figure 11. Sample 3 thermal image at 8.09 S.
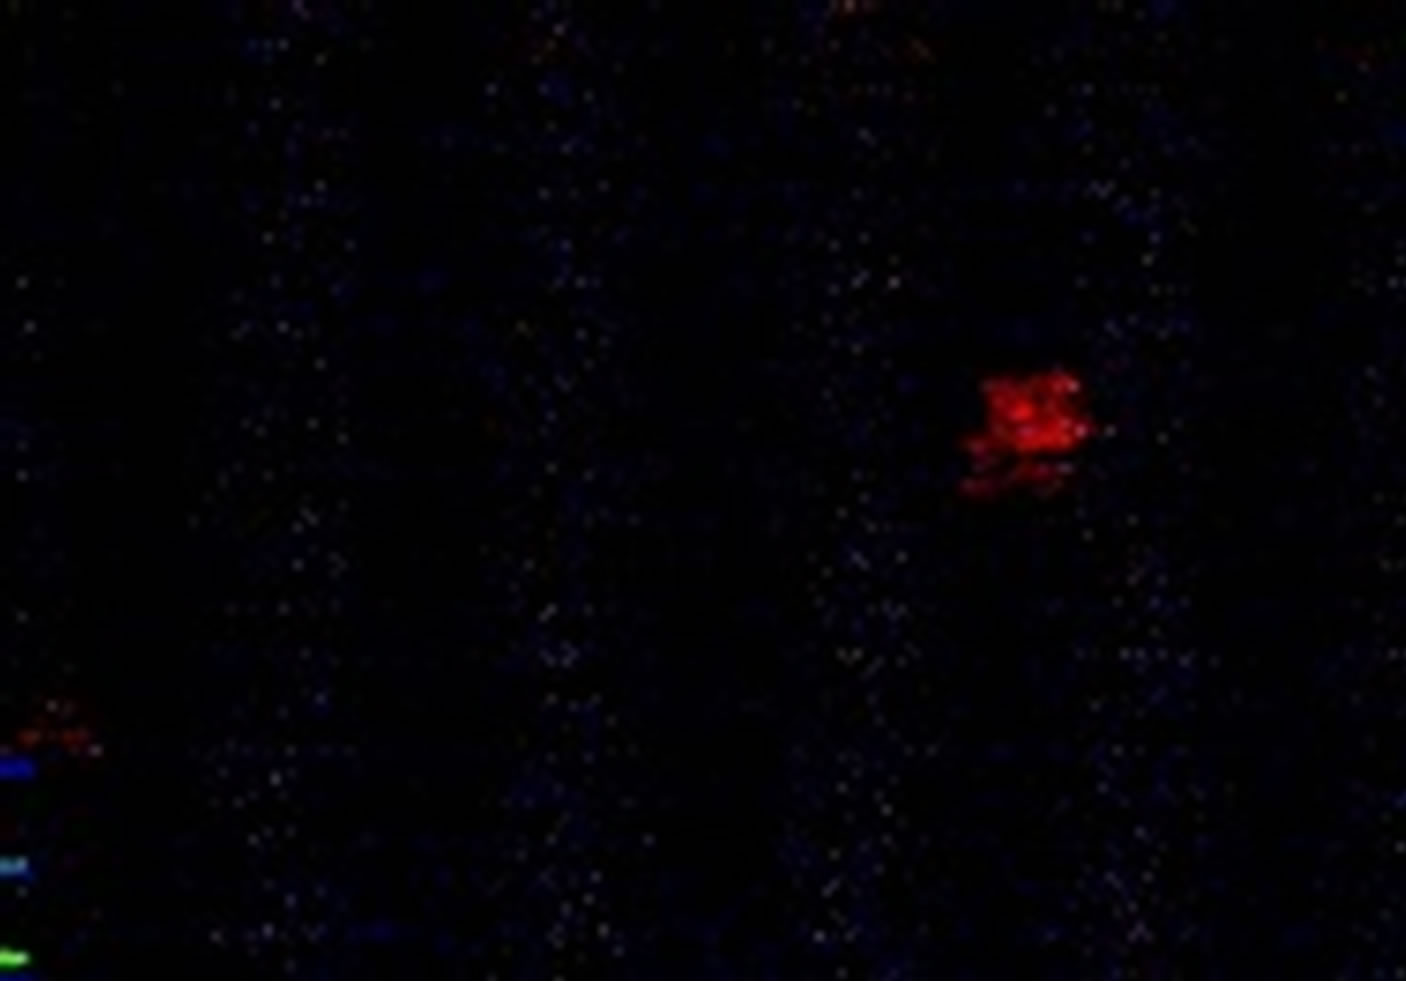
Figure 12. Sample 3 thermal image at 11.49 S.

Figure 13. Sample 3 thermal image at 15 S.
5. Discussion
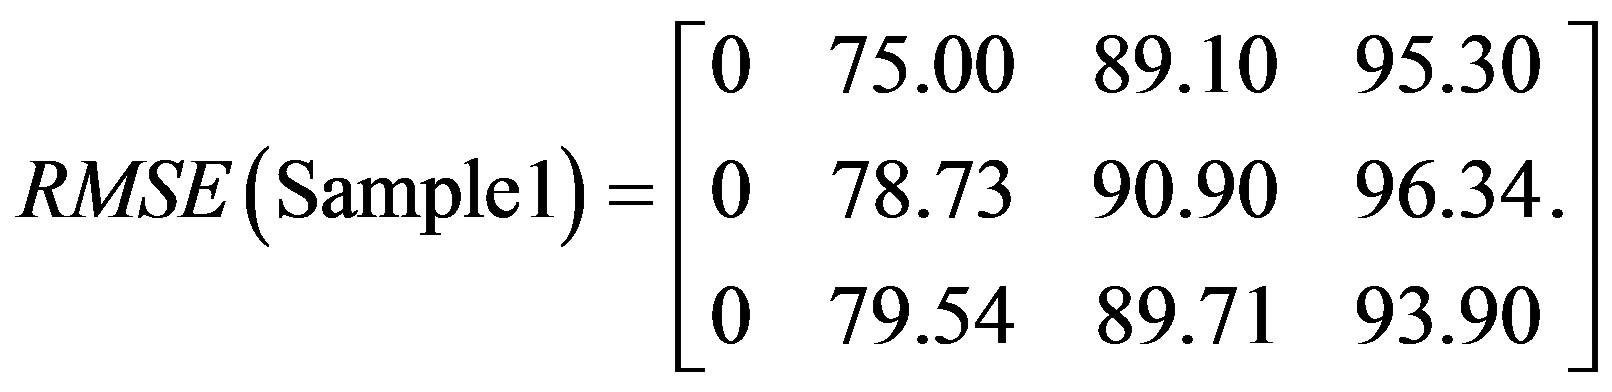
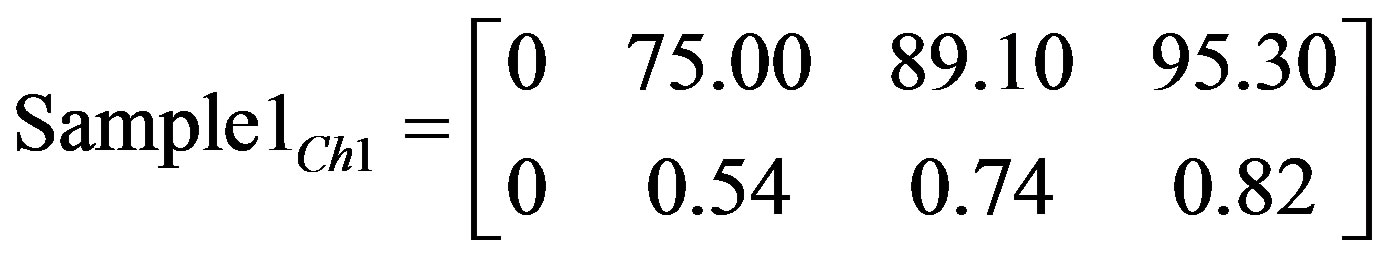
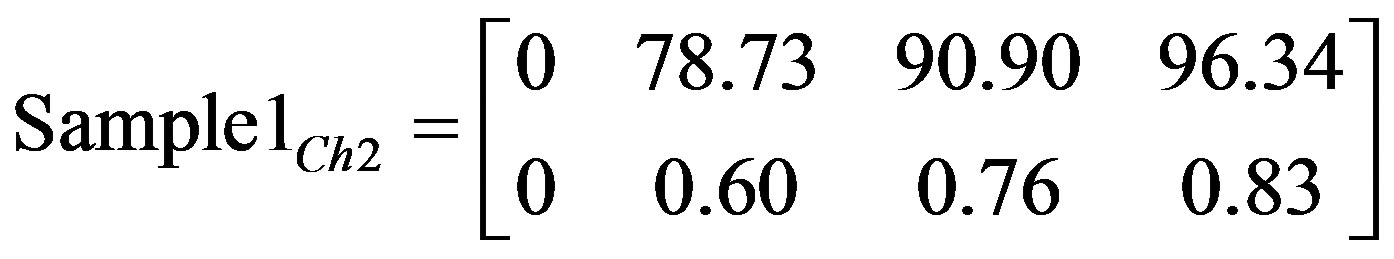
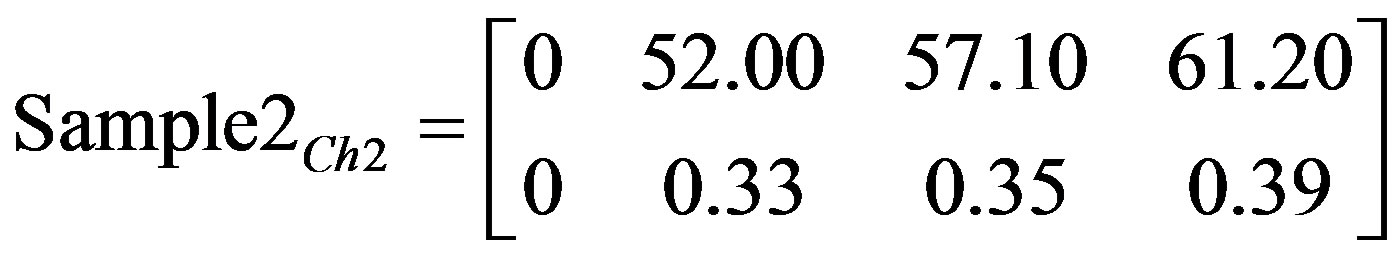
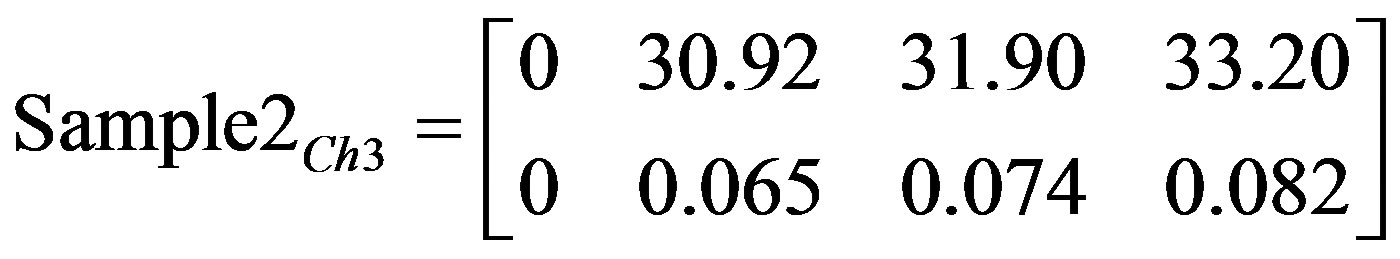
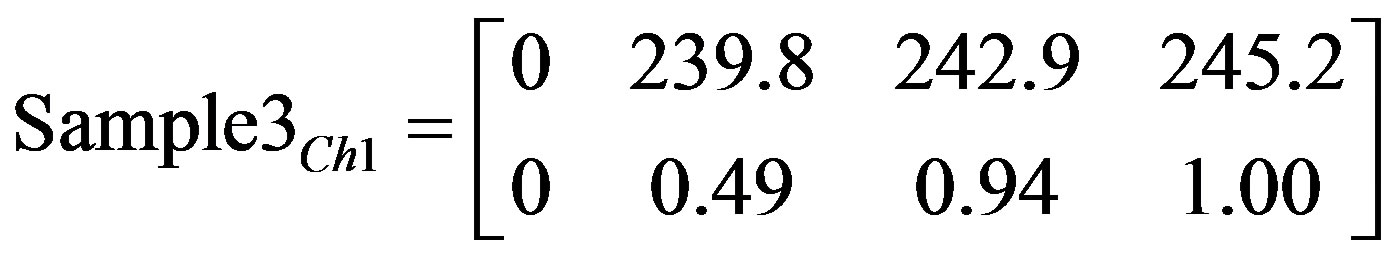
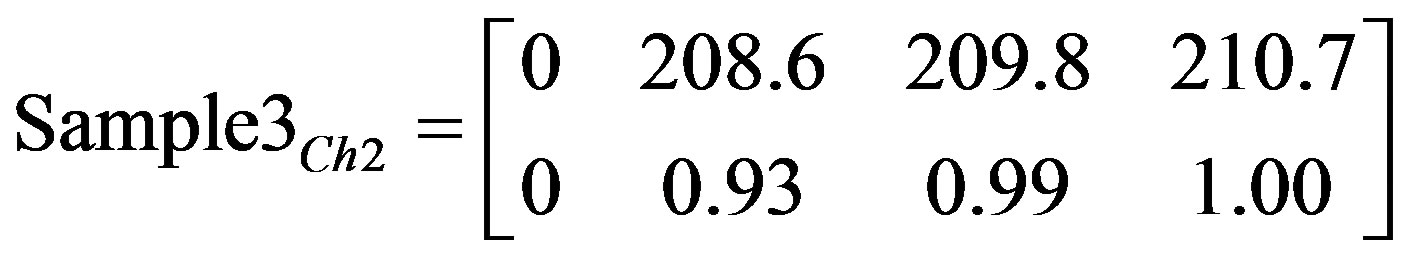
Three bands used to analyze the captured thermal images with functions applied to compute image indices as shown in matrices 5 - 10.
 (5)
(5)
 (6)
(6)
 (7)
(7)
 (8)
(8)
 (9)
(9)
 (10)
(10)
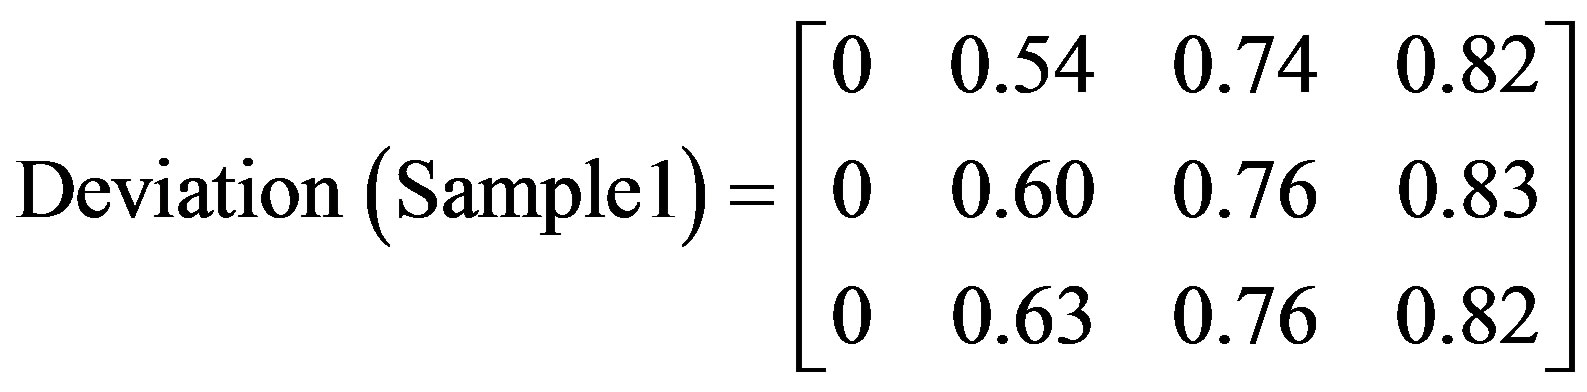
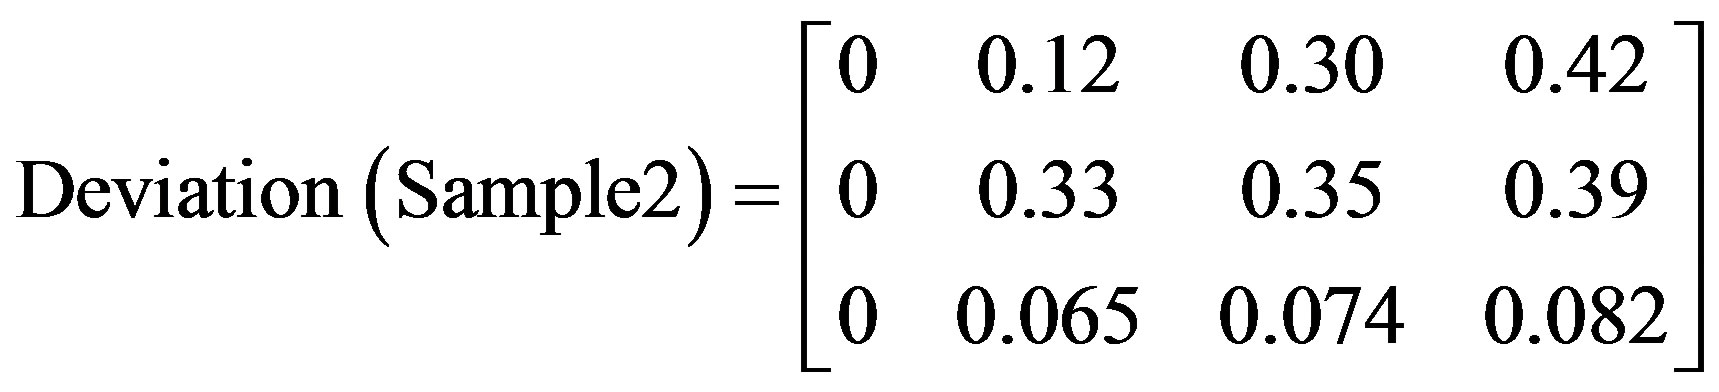
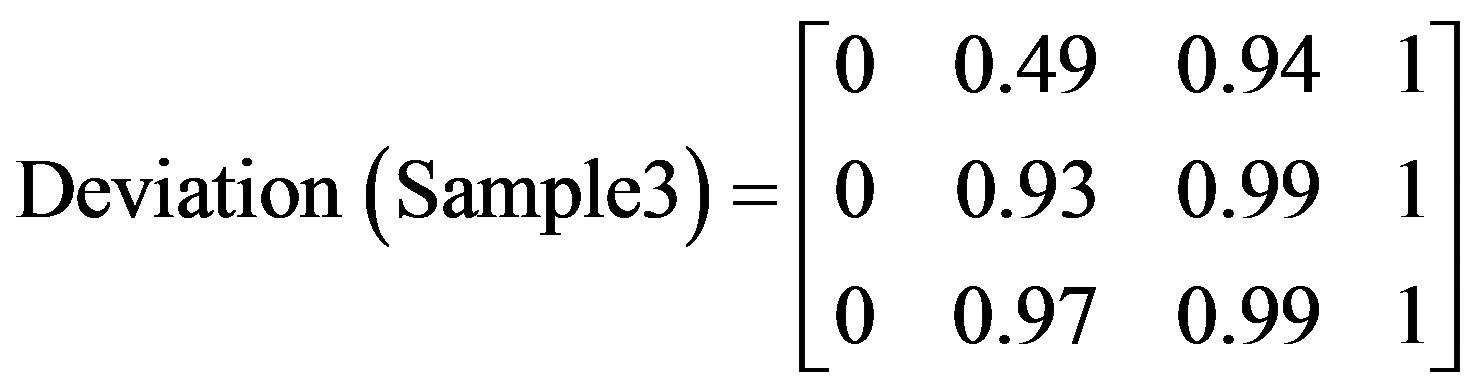
Matrices 6, 8, and 10 show results after applying image deviation function to the captured images in Figures 2-13.
The matrices clearly show an accurate characteristic difference between the three samples under test in terms of deviation as a function of time. Such differences are used in determining the level of damage per component specification and threshold specified.
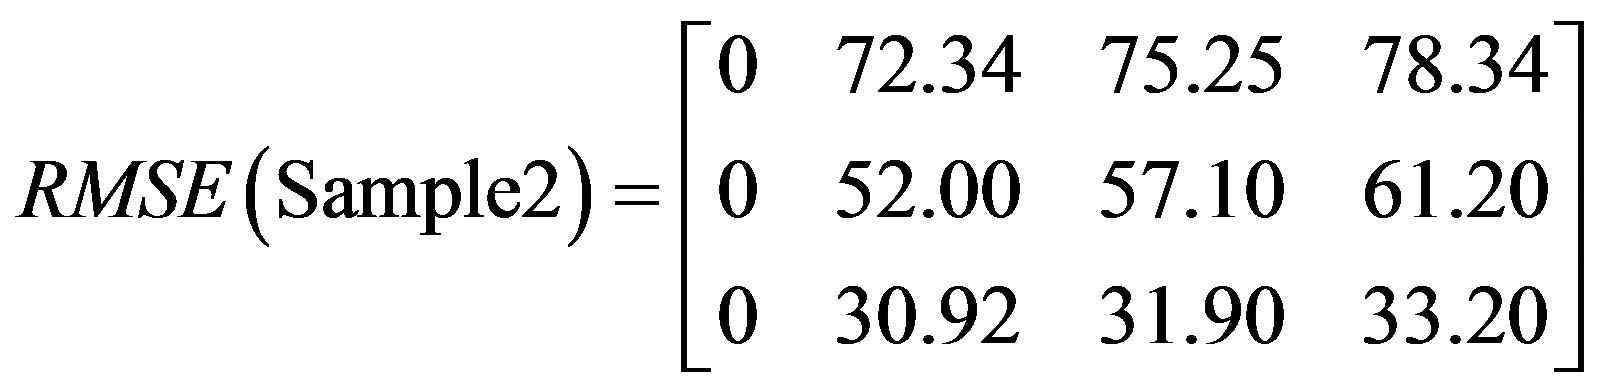
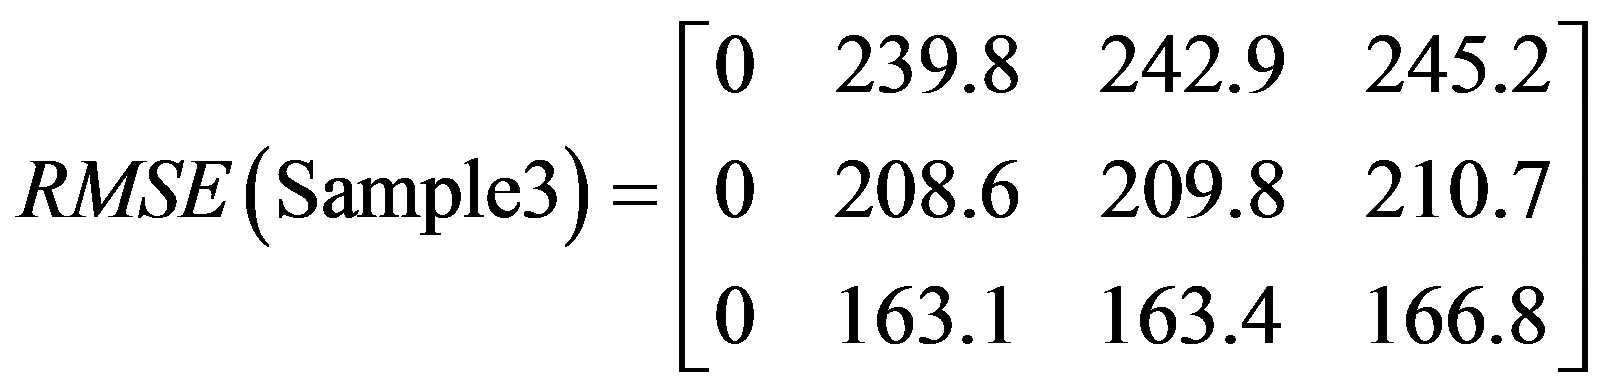
From matrices (5)-(10), characteristic matrices can be produced as shown in matrices (11)-(19).
 (11)
(11)
 (12)
(12)
 (13)
(13)
 (14)
(14)
 (15)
(15)
 (16)
(16)
 (17)
(17)
 (18)
(18)
 (19)
(19)
Figures 14-16 show how RMSE is affected as a function of pulse diffusion over time. The plots clearly indi-
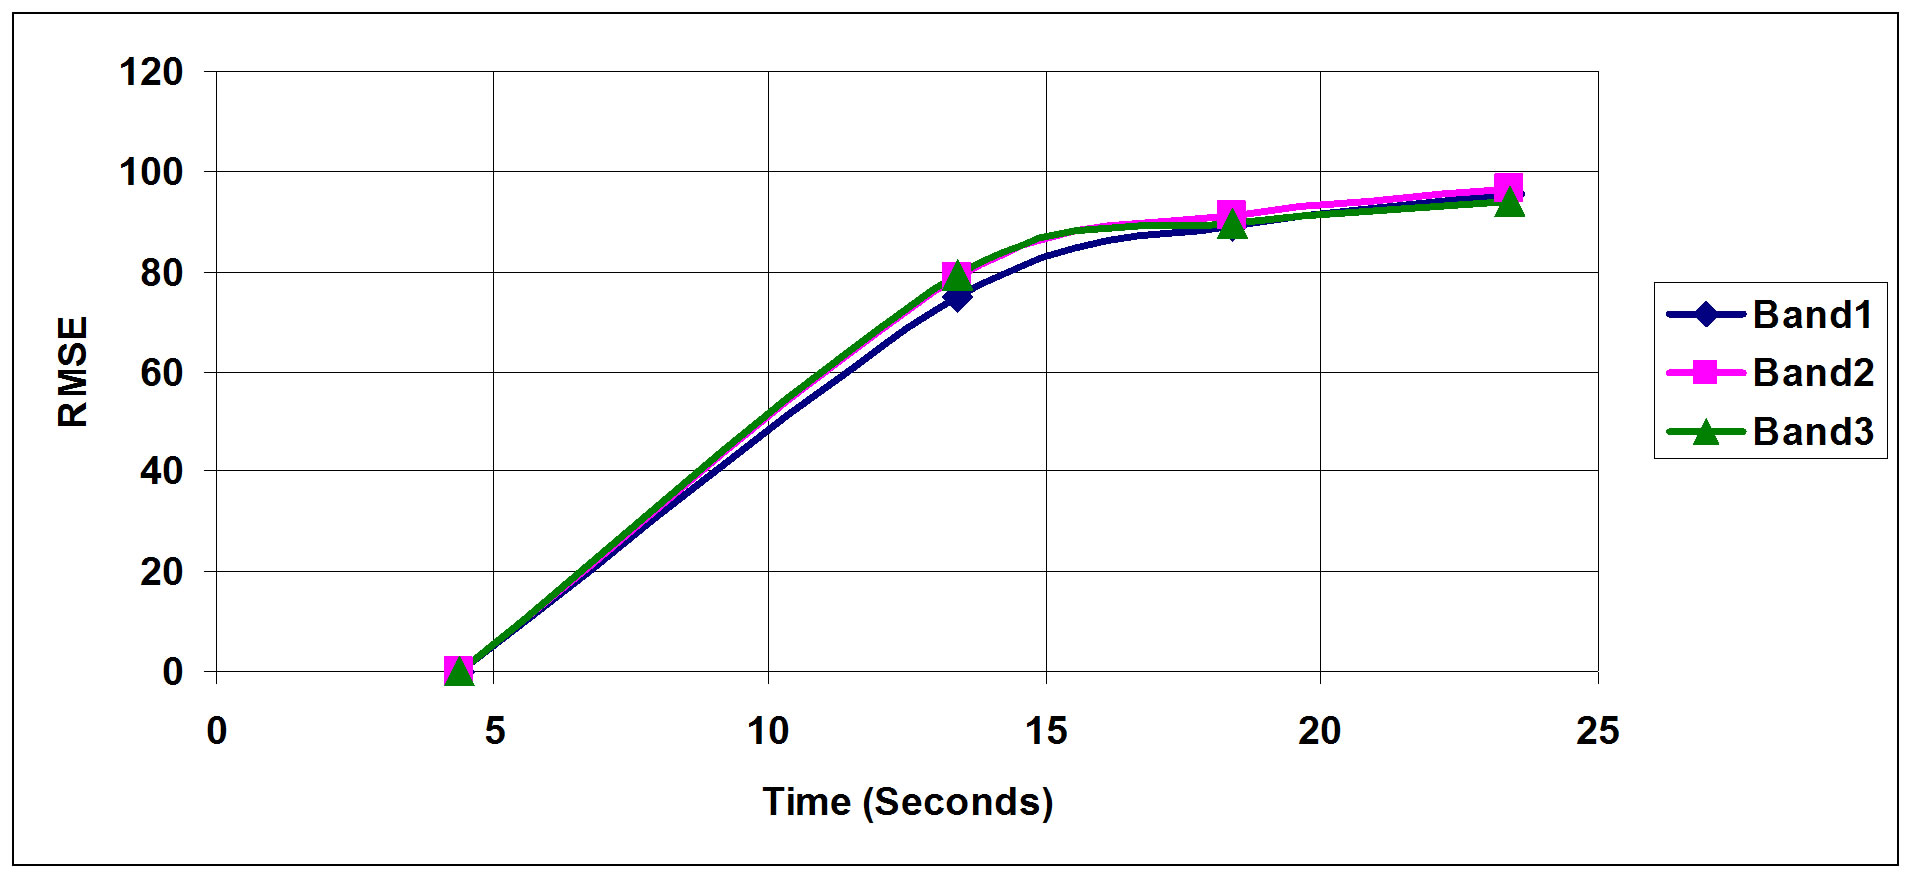
Figure 14. Samples 1 RMSE.
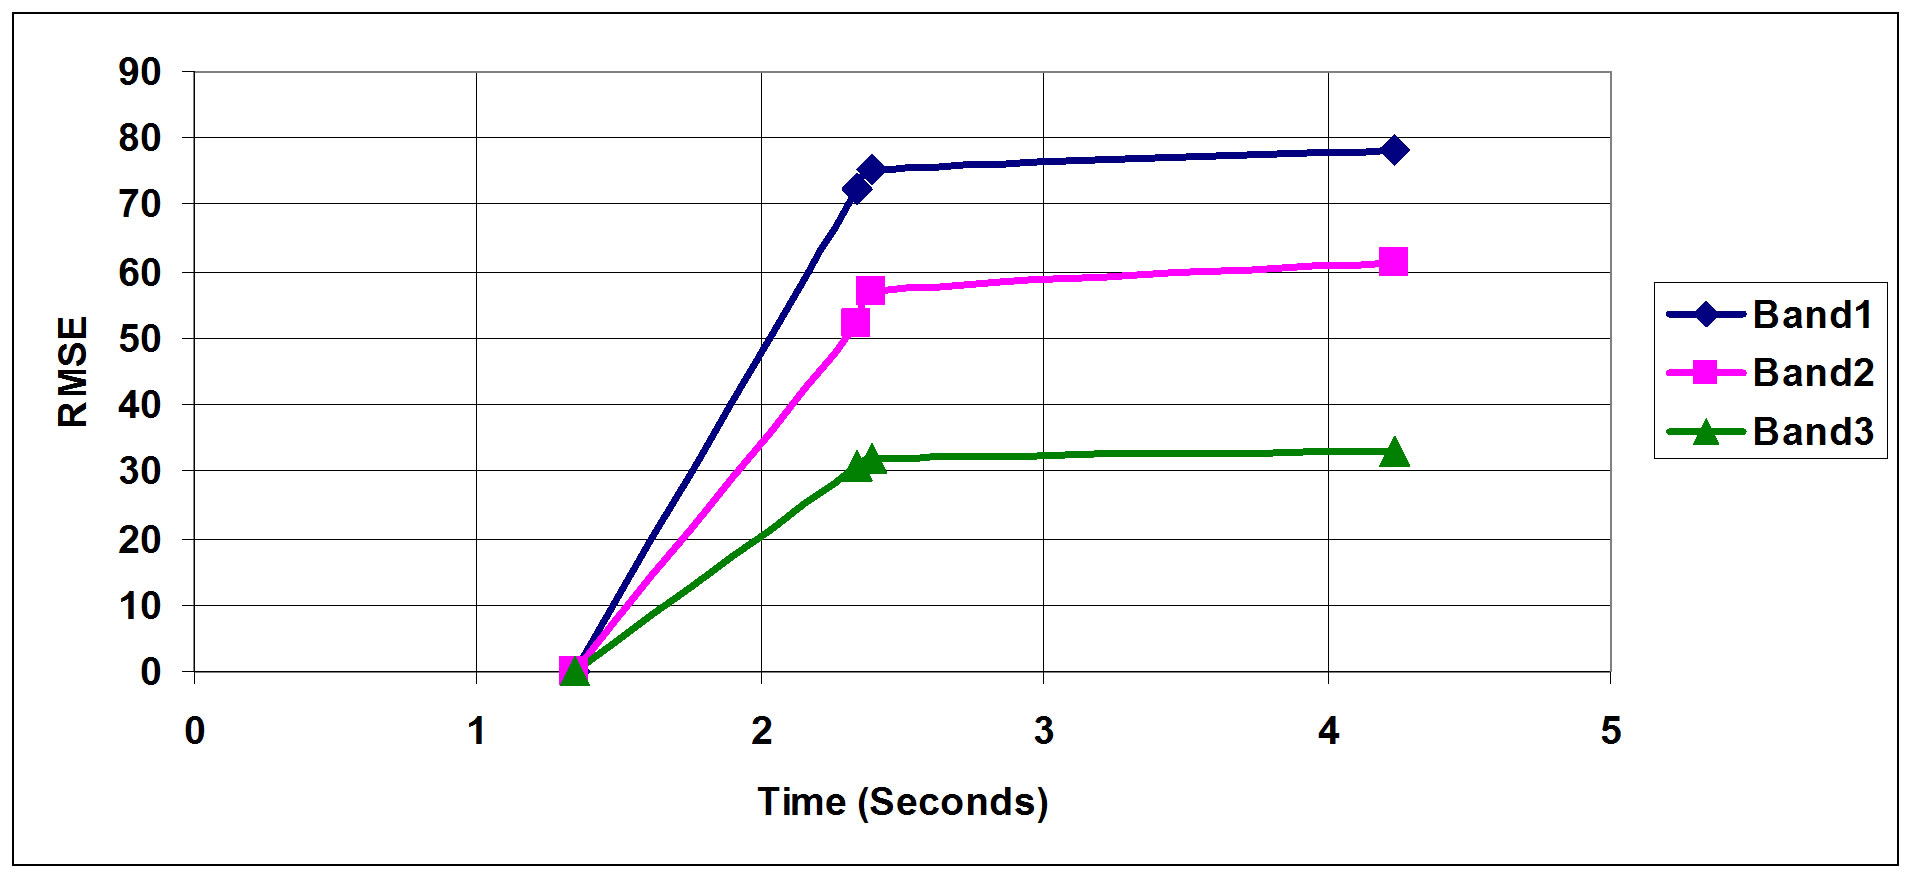
Figure 15. Sample 2 RMSE.
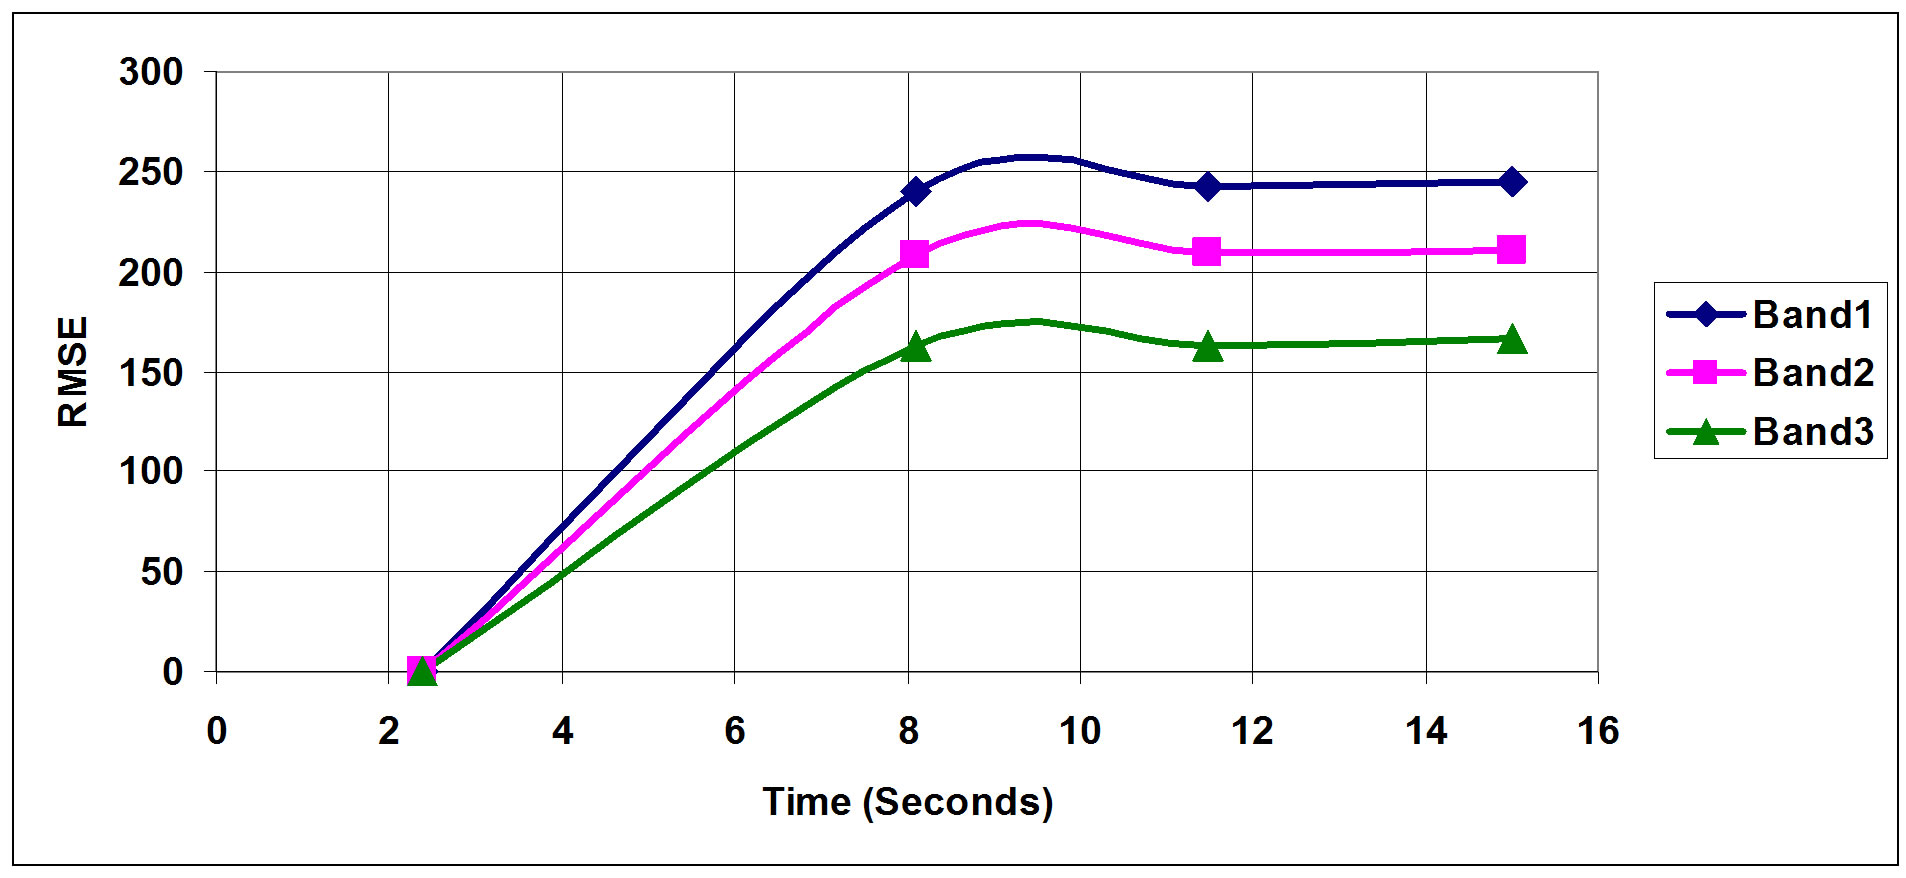
Figure 16. Sample 3 RMSE.
cate that the origin of each one is a different structure. This is clearly indicated and supported by the hyperspectral tri-band outputs from the analyzed images. Under normal conditions and with the use of traditional image analysis techniques the plots could be interpreted as originated from the same sample under different mechanical conditions, however, with the availability of more than one band, this is proved otherwise.
The time period within which a pulse diffused in a tested sample depends on its physical characteristics and level of damage or defects if any in the sample. The deviation index computed is a strong indicator of how good a sample is as deviation values per time transition indicate how much damage a components might have suffered. These findings are shown in Figures 17-19.
Matrices 20 - 22 show a computed time independent accumulative RMSE values that are used to characterize each tested component and are further used to predict other components. A comparison between tested components is shown in Figure 20.
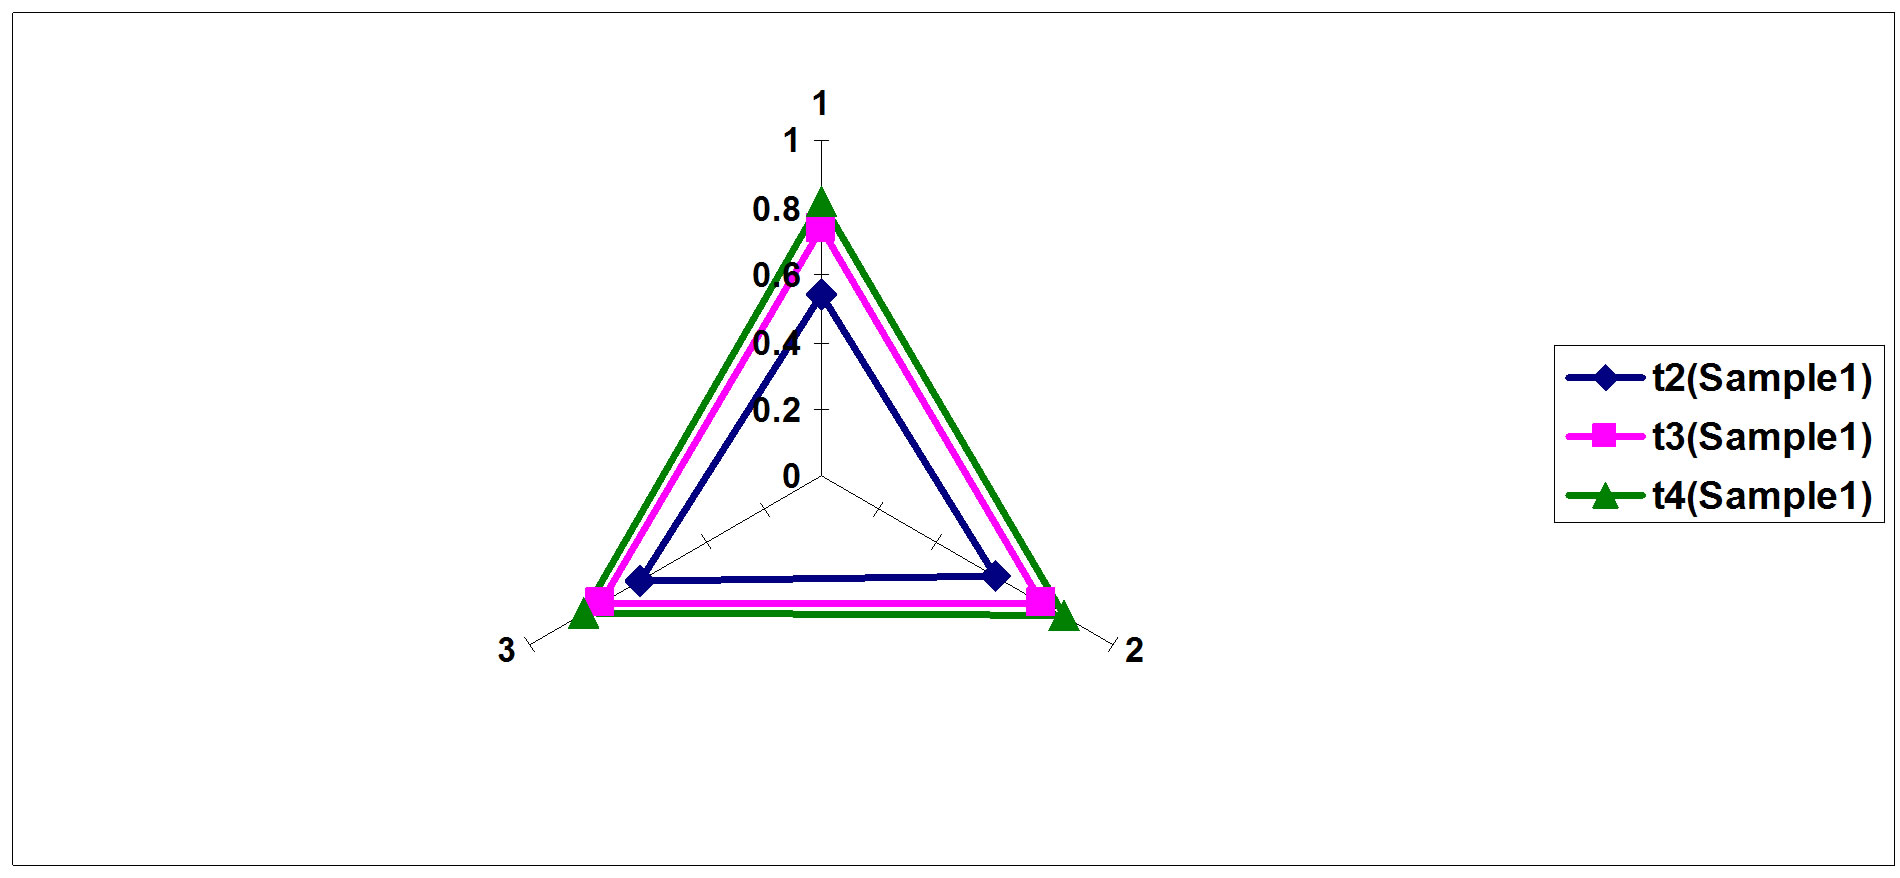
Figure 17. Sample 1 hyperspectral deviation.
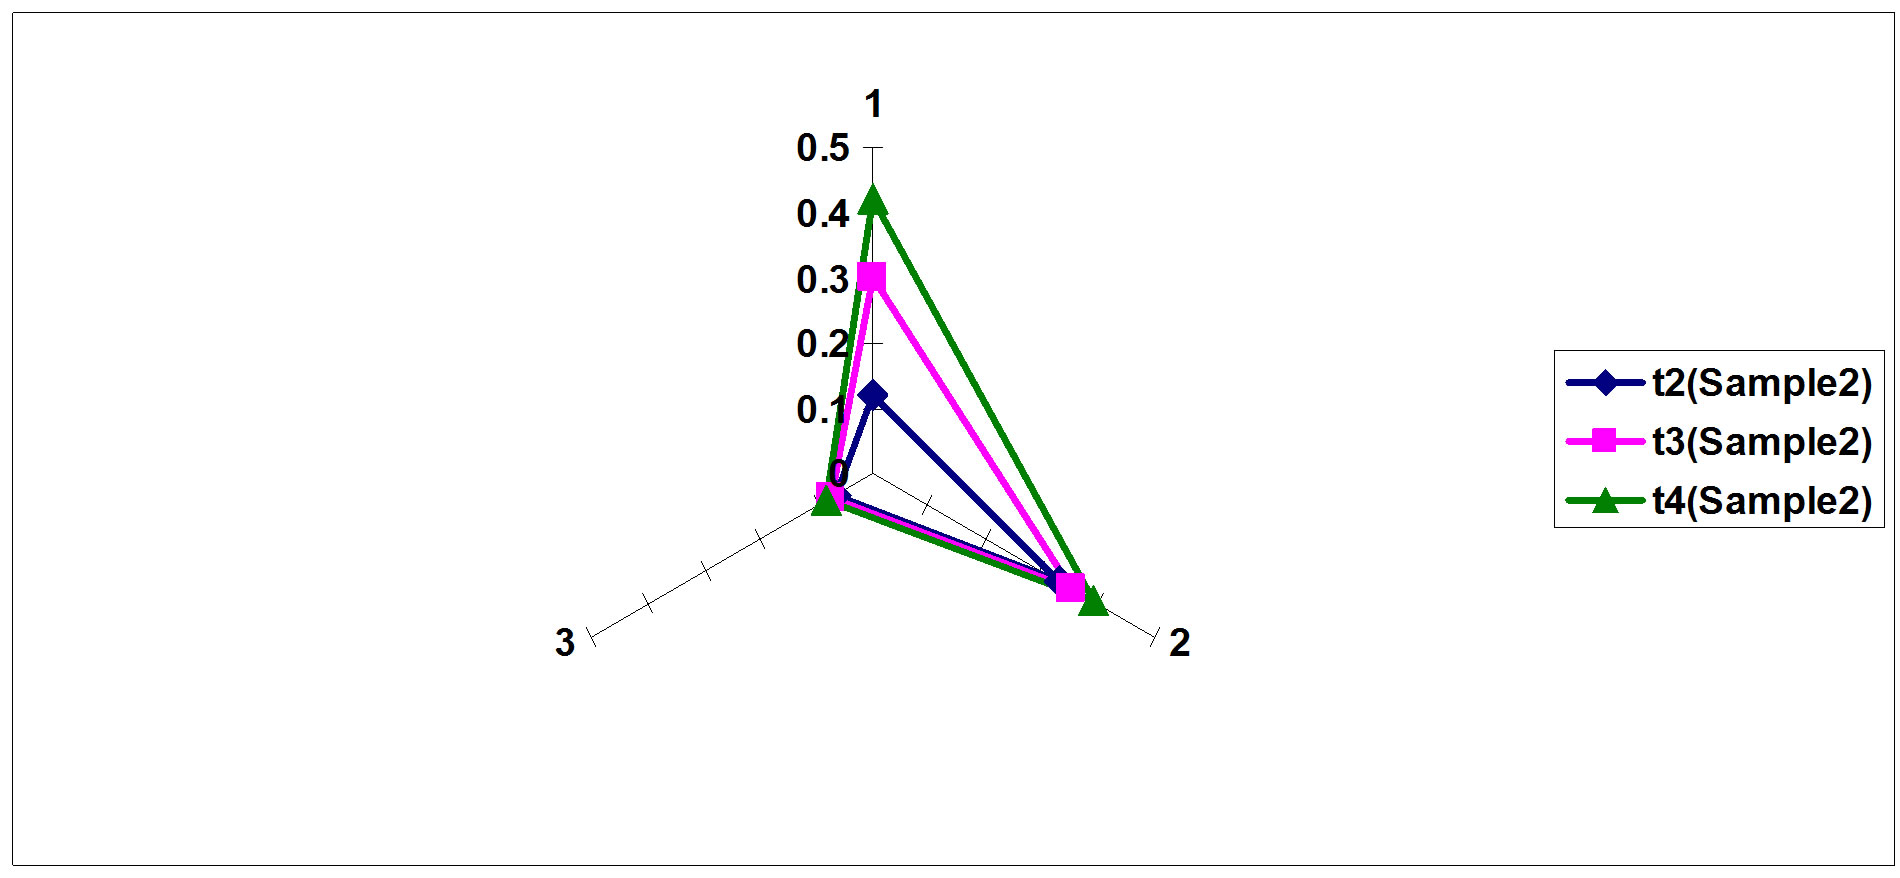
Figure 18. Sample 2 hyperspectral deviation.
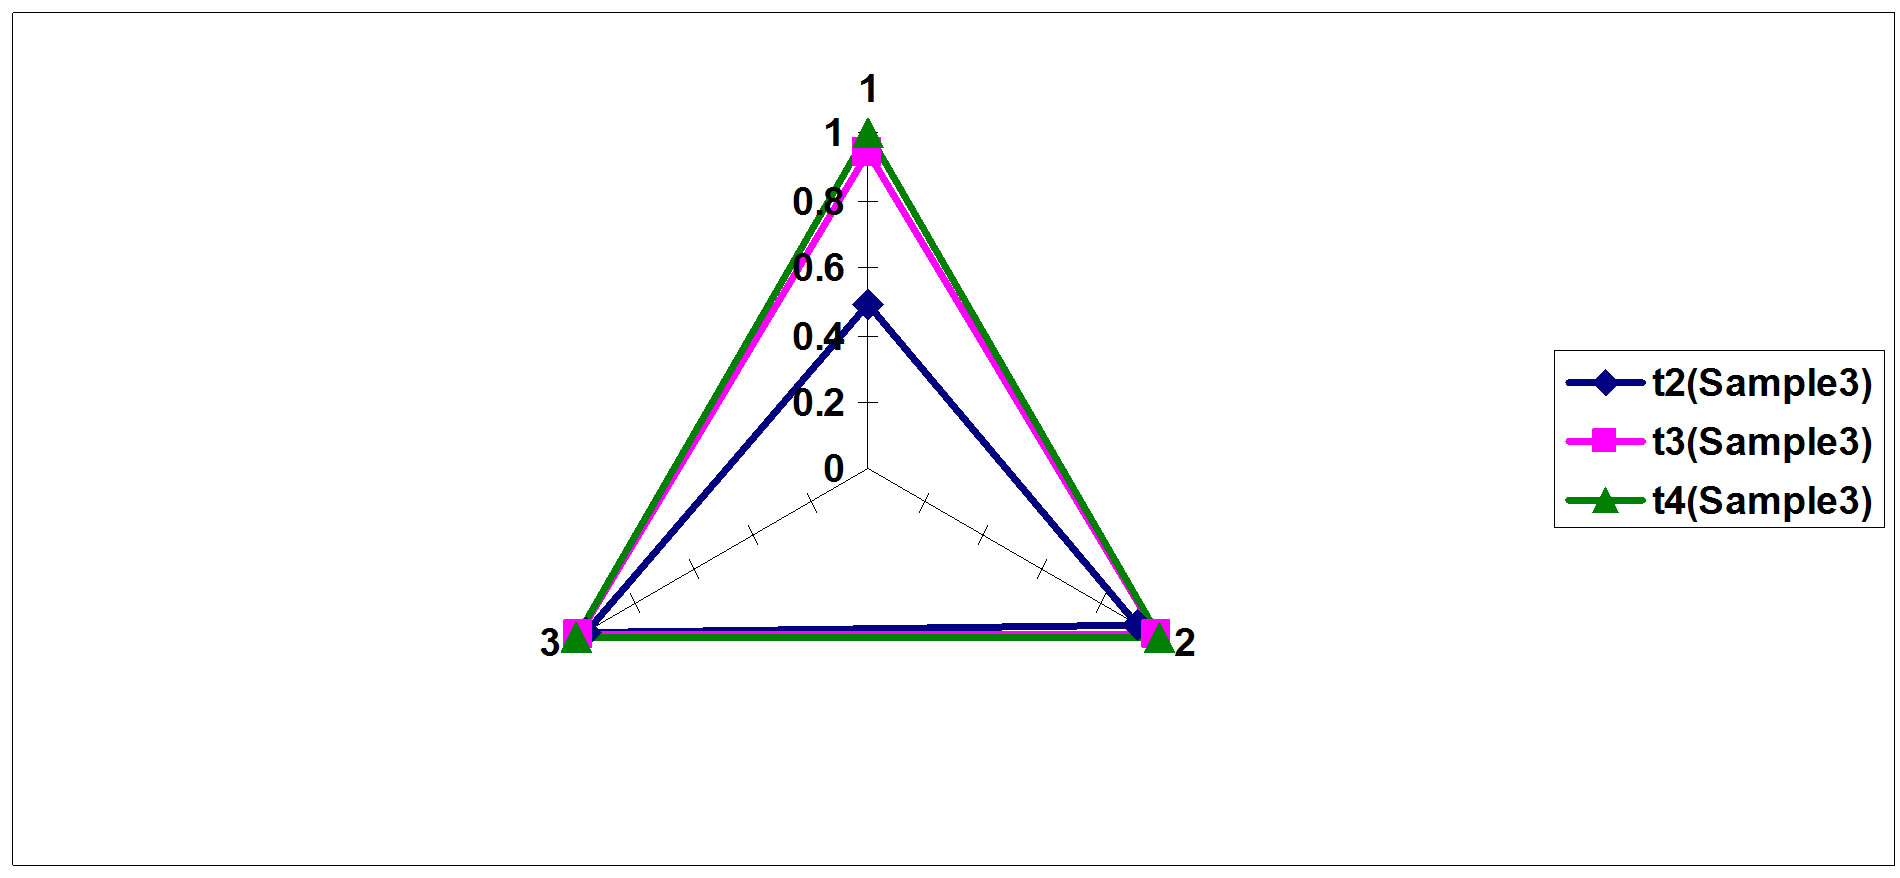
Figure 19. Sample 3 hyperspectral deviation.
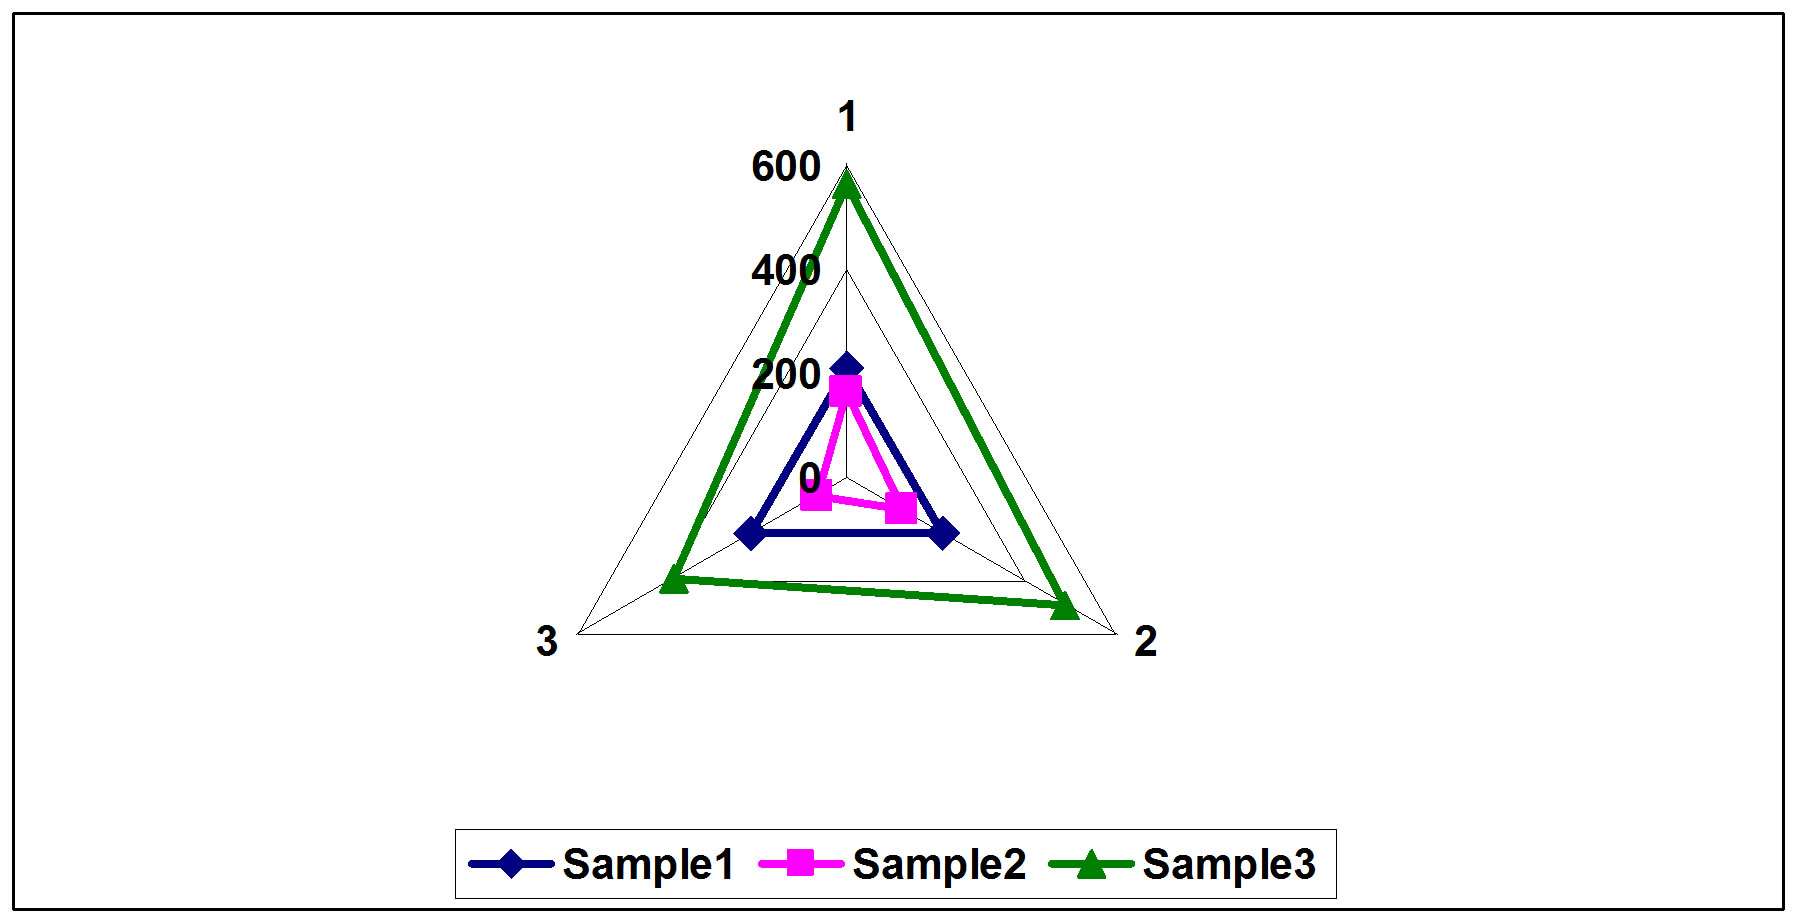
Figure 20. Accumalative RMSE time independent comparison between tested samples.
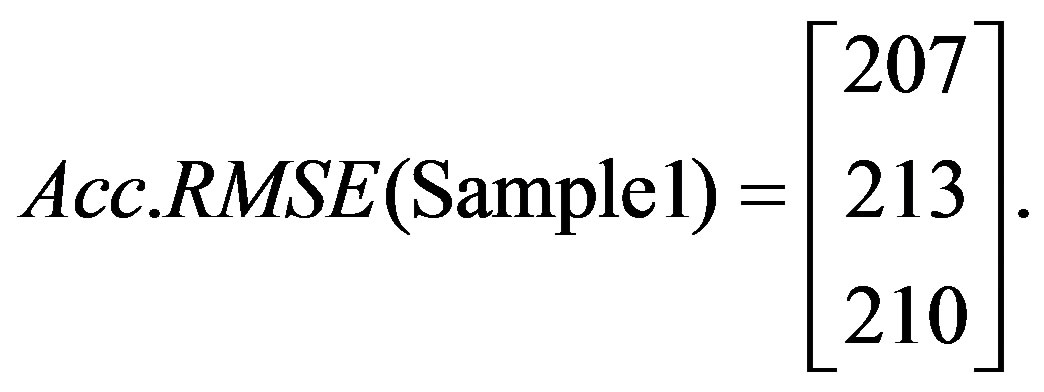 (20)
(20)
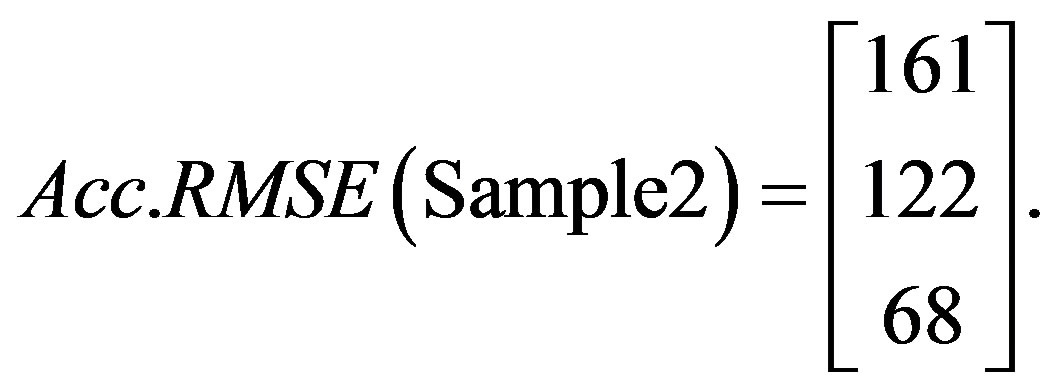 (21)
(21)
 (22)
(22)
To validate the obtained results, and that a sample type can be identified through its hyperspectral image indices, Sample 1 is retested at different time intervals (Identified as Sample 4) as shown in Figures 21-24 with image in Figure 2 taken as a reference.
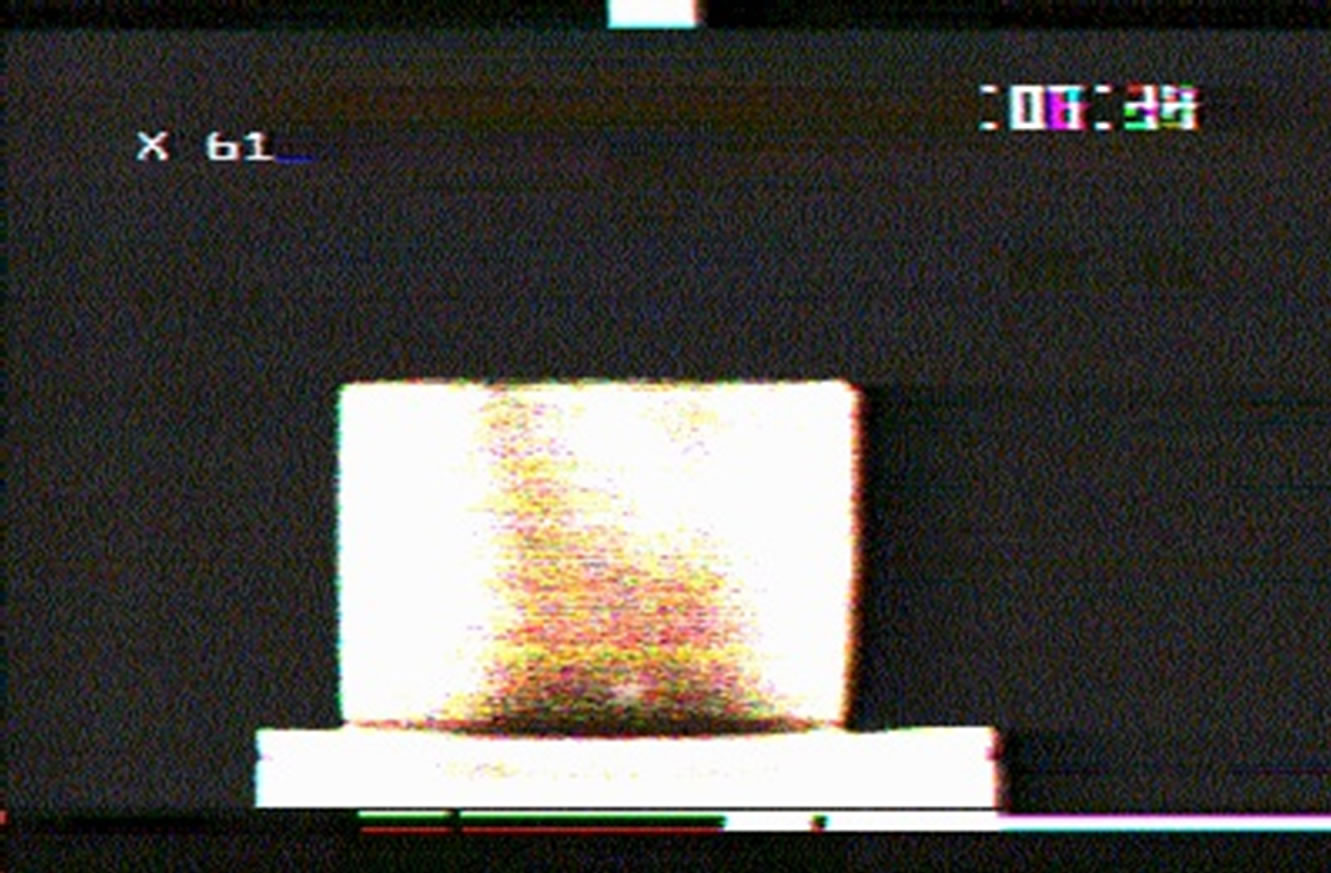
Figure 21. Sample 4 thermal image at 7.39 seconds.
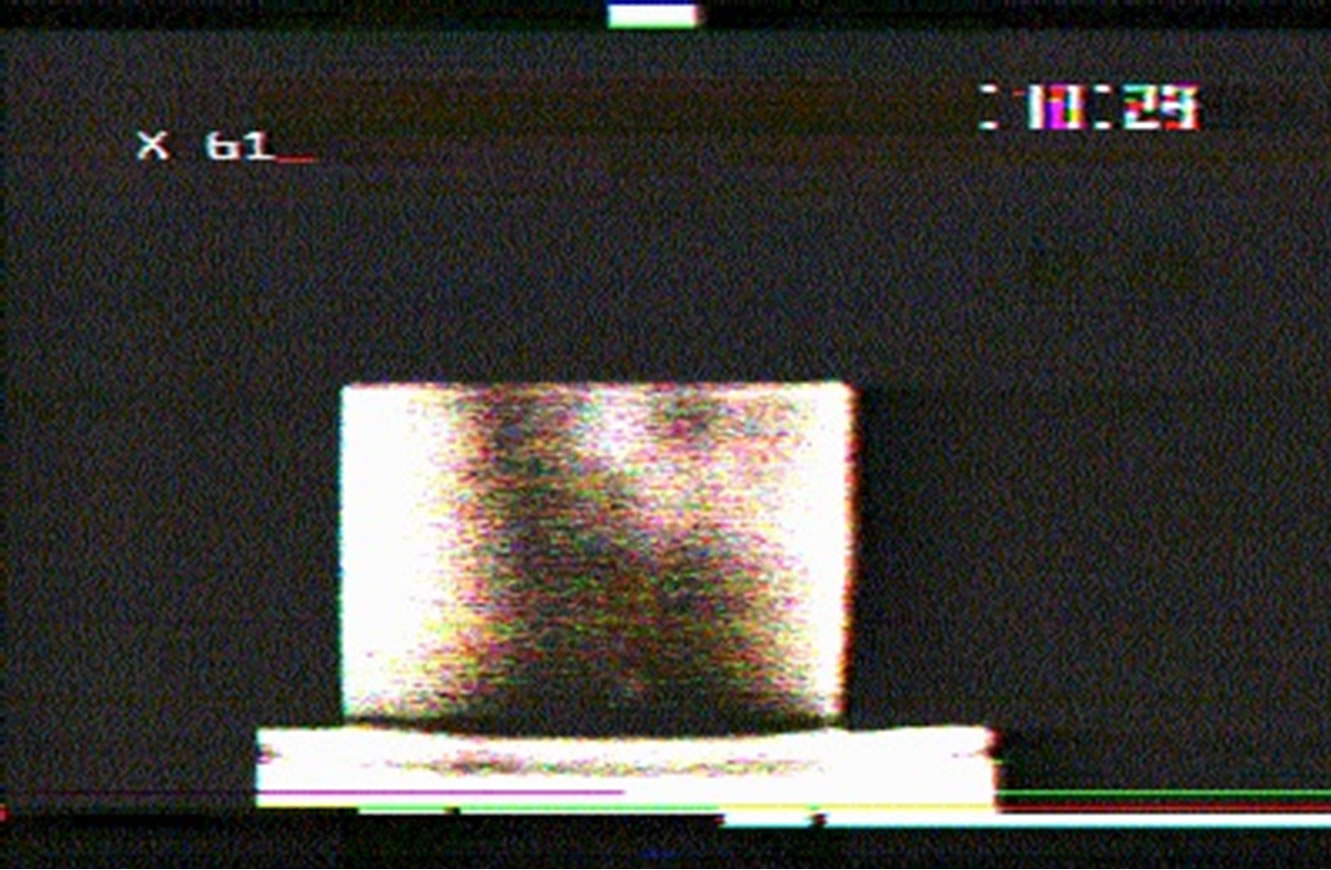
Figure 22. Sample 4 thermal image at 11.23 seconds.
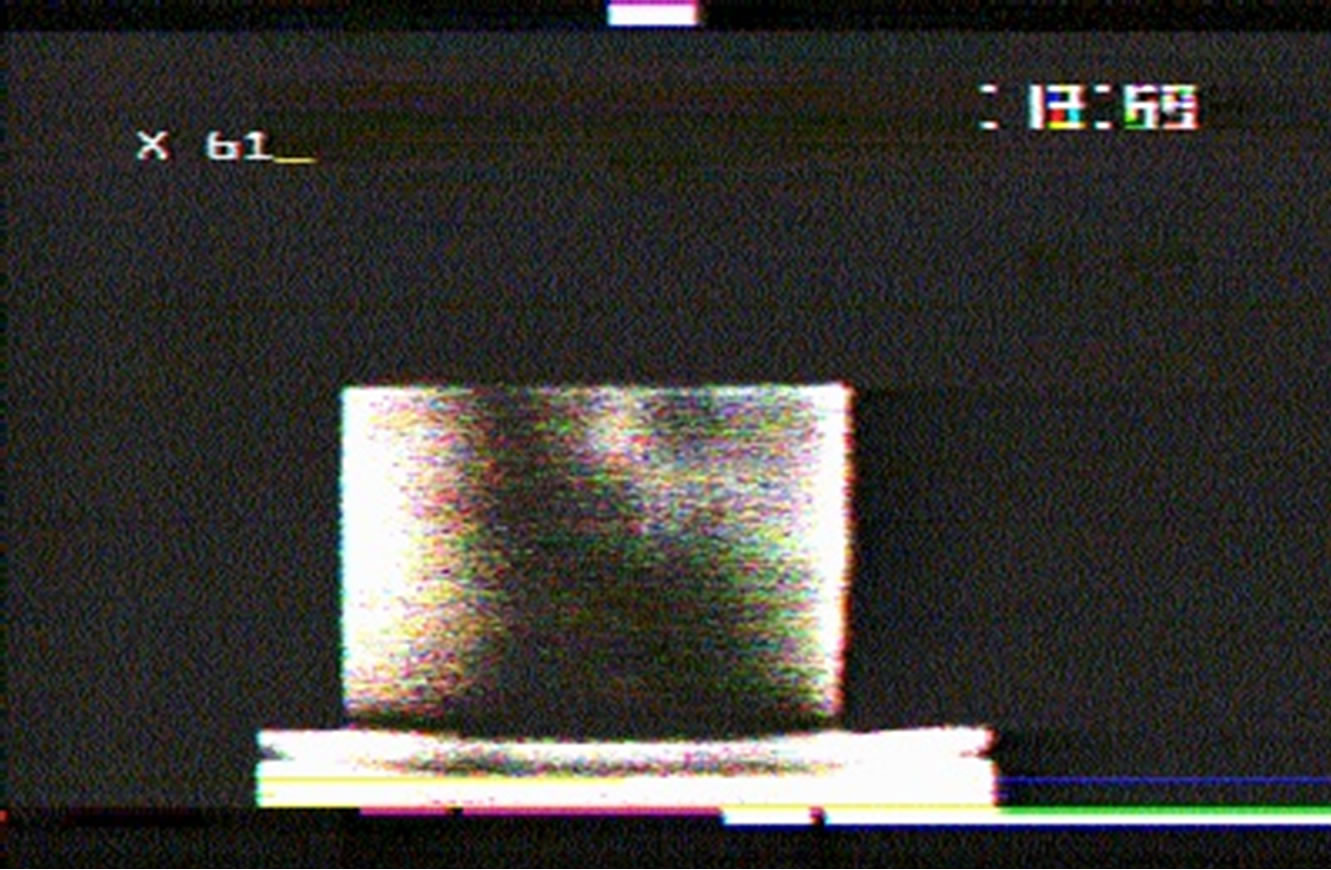
Figure 23. Sample 4 thermal image at 13.59 seconds.
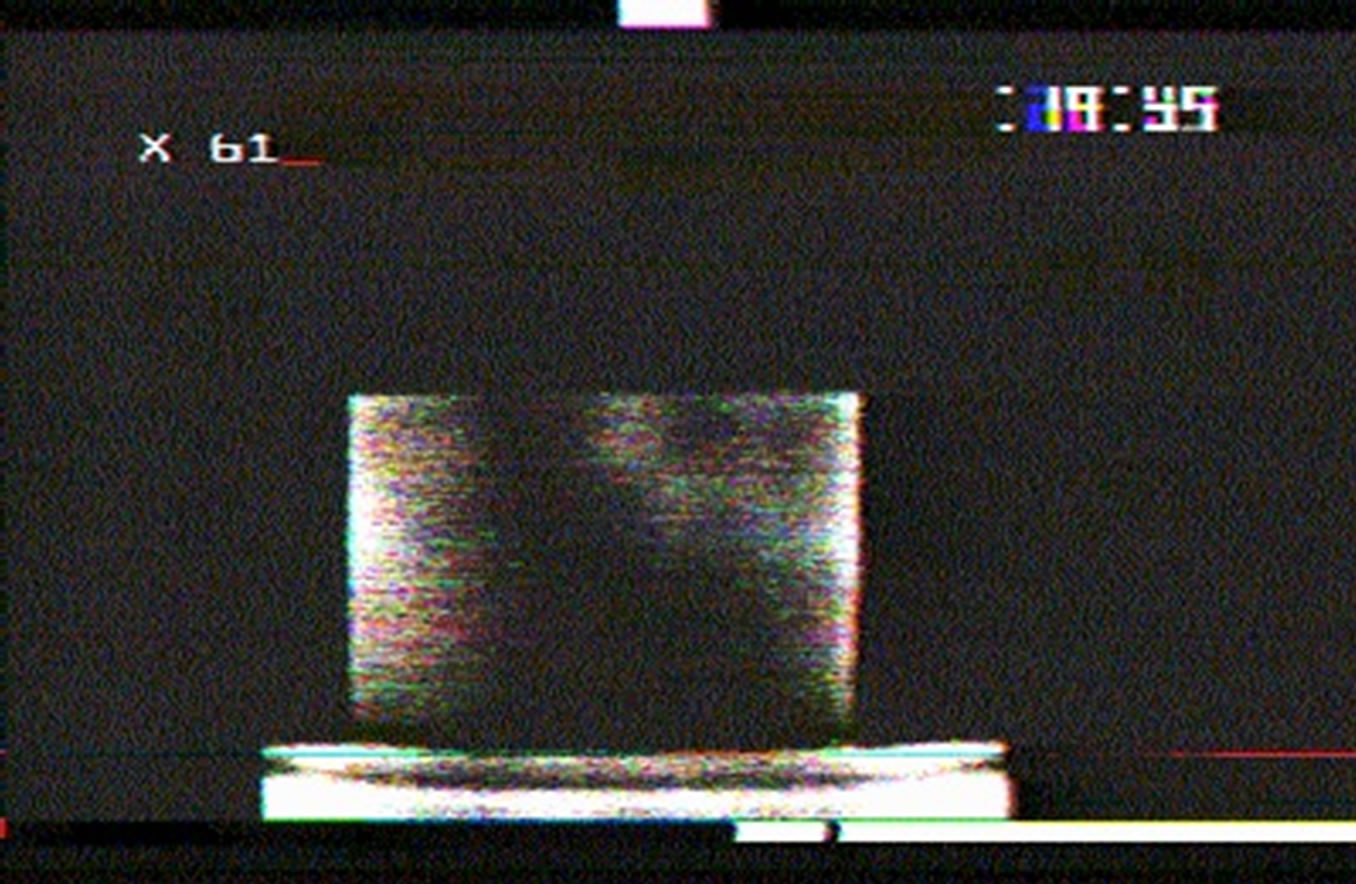
Figure 24. Sample 4 thermal image at 19.45 seconds.
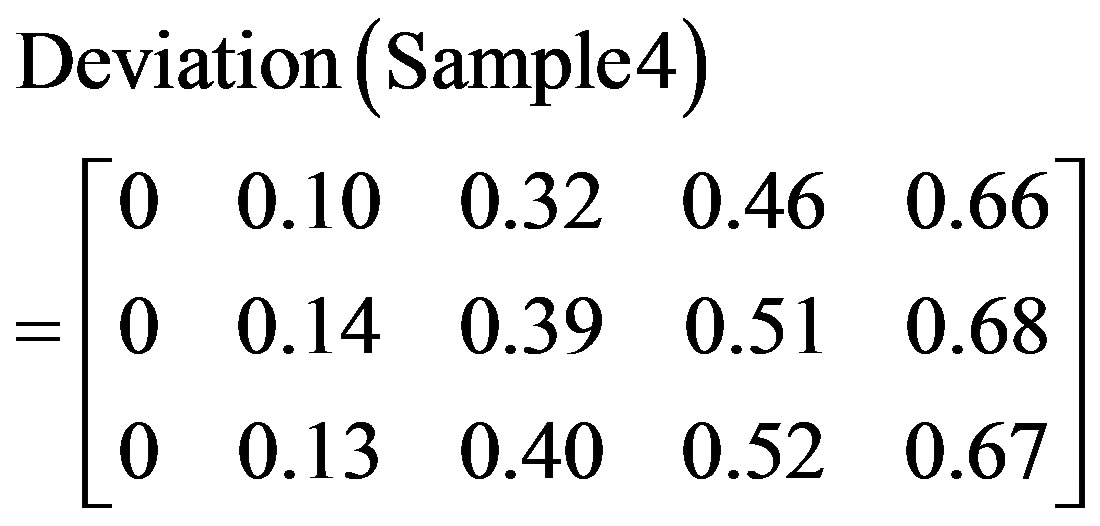
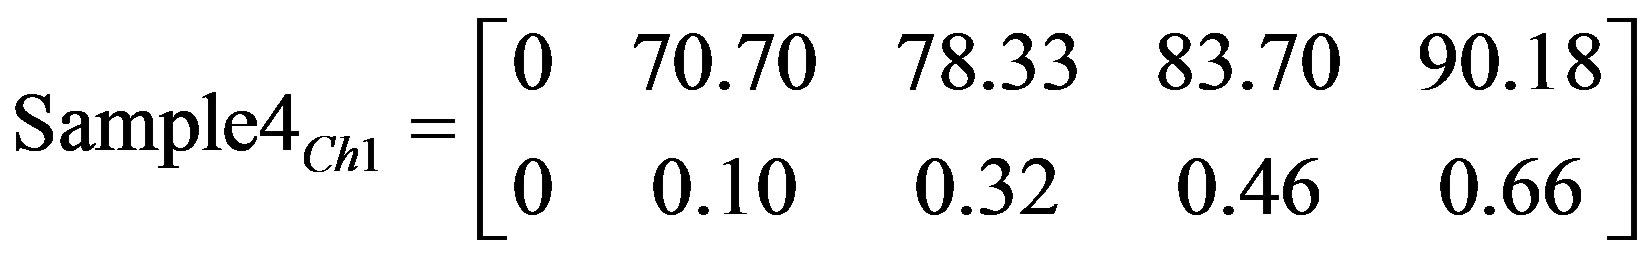
The obtained image indices, matrices, and characteristic matrices are shown in (23)-(27).
 (23)
(23)
 (24)
(24)
 (25)
(25)
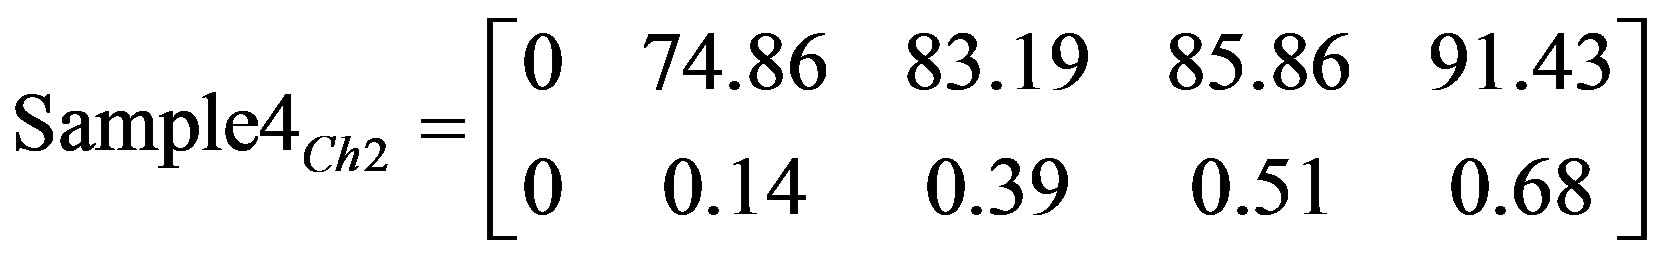 (26)
(26)
 (27)
(27)
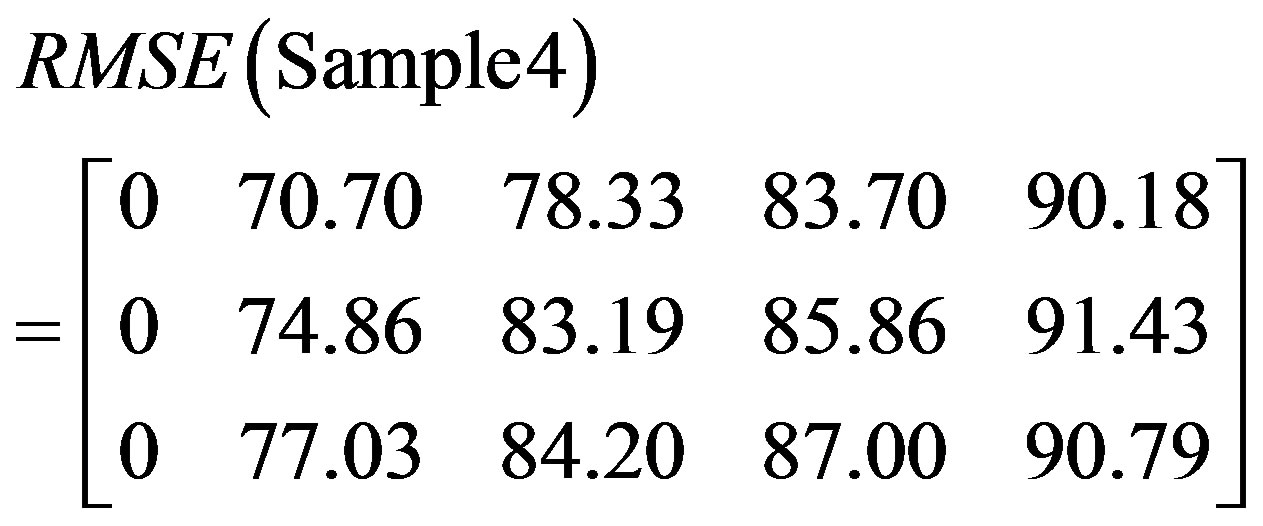
The RMSE time independent characteristic matrix is shown in (28)
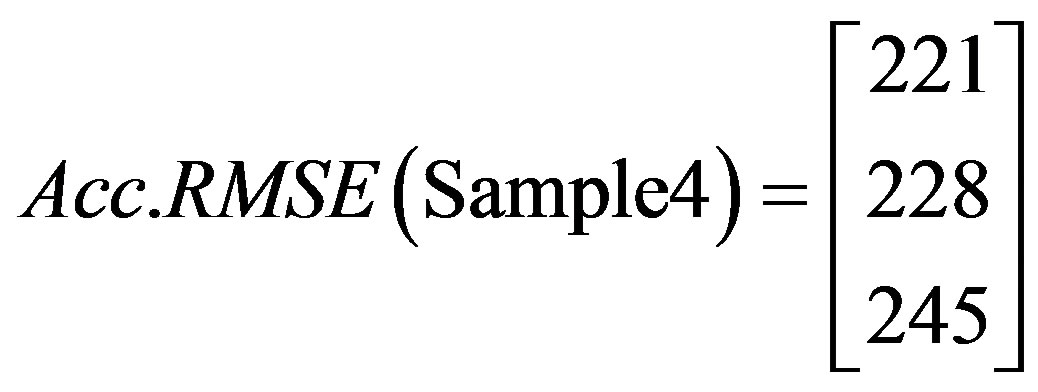 (28)
(28)
By examining the range of Acc. RMSE for all tested samples, it is clear that Sample 4 belongs to Sample 1 group and in fact it is the same component tested at different time intervals.
To support this claim, values in (20), (21), and (22) are used to train a Neural Network Model shown in Figure 25.
Table 2 shows training and predicted data. From the testing data, it is clear that Sample 4 is recognized as in the same class as Sample 1, hence, mechanical specifications and thresholds and damage limitations are applied according to that class, which is assigned class 1. Thus, intervals and ranges can be established to determine the type of tested component.
To cover missing input data, a more complicated
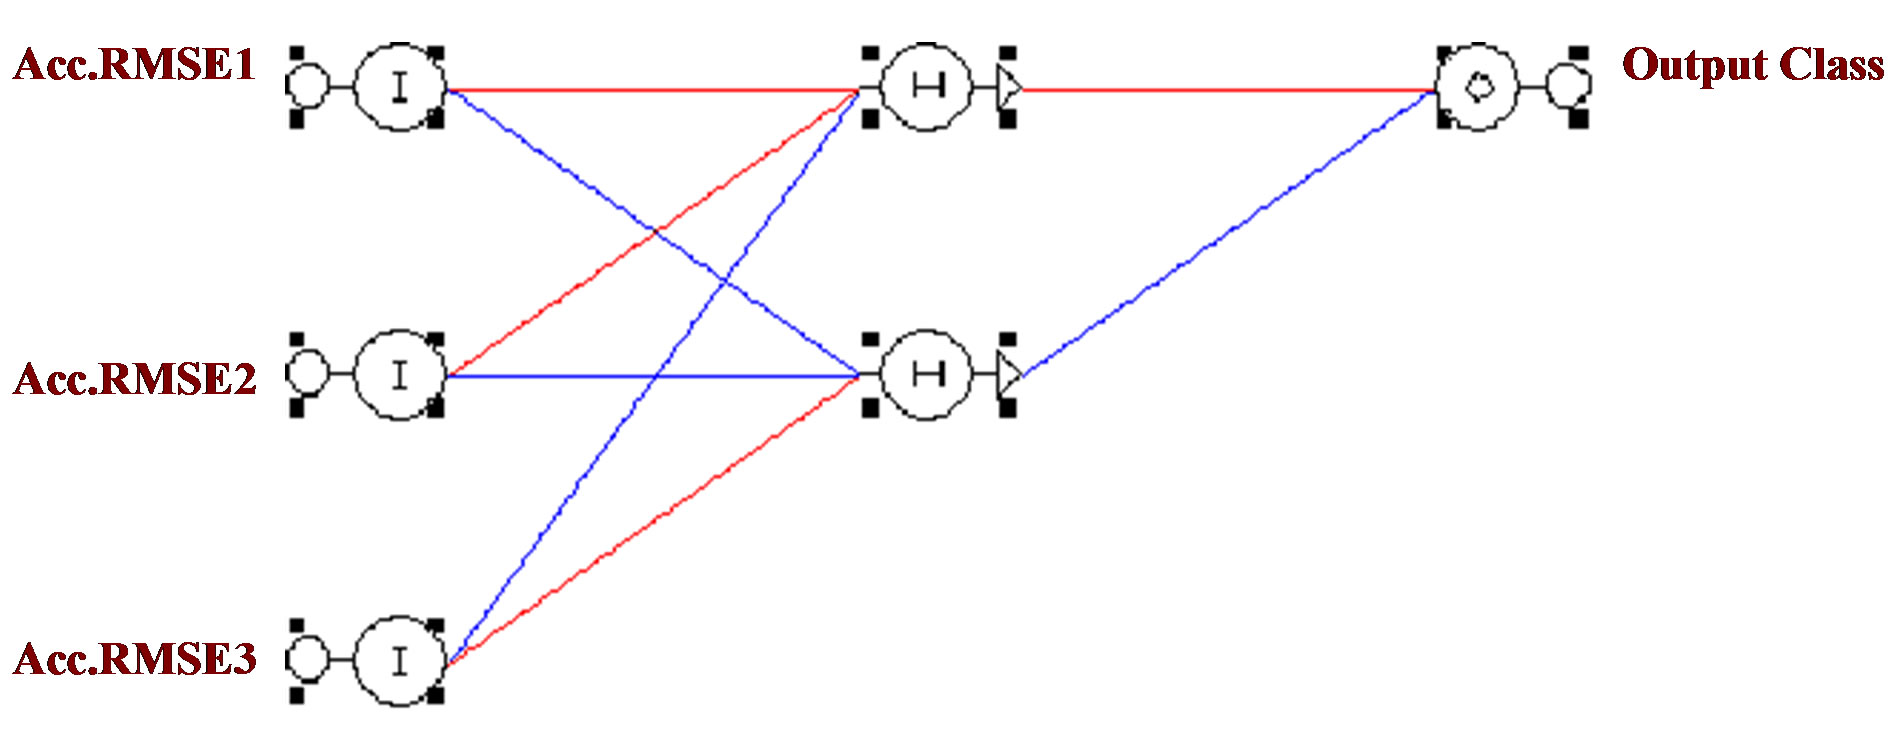
Figure 25. Neural network training model.
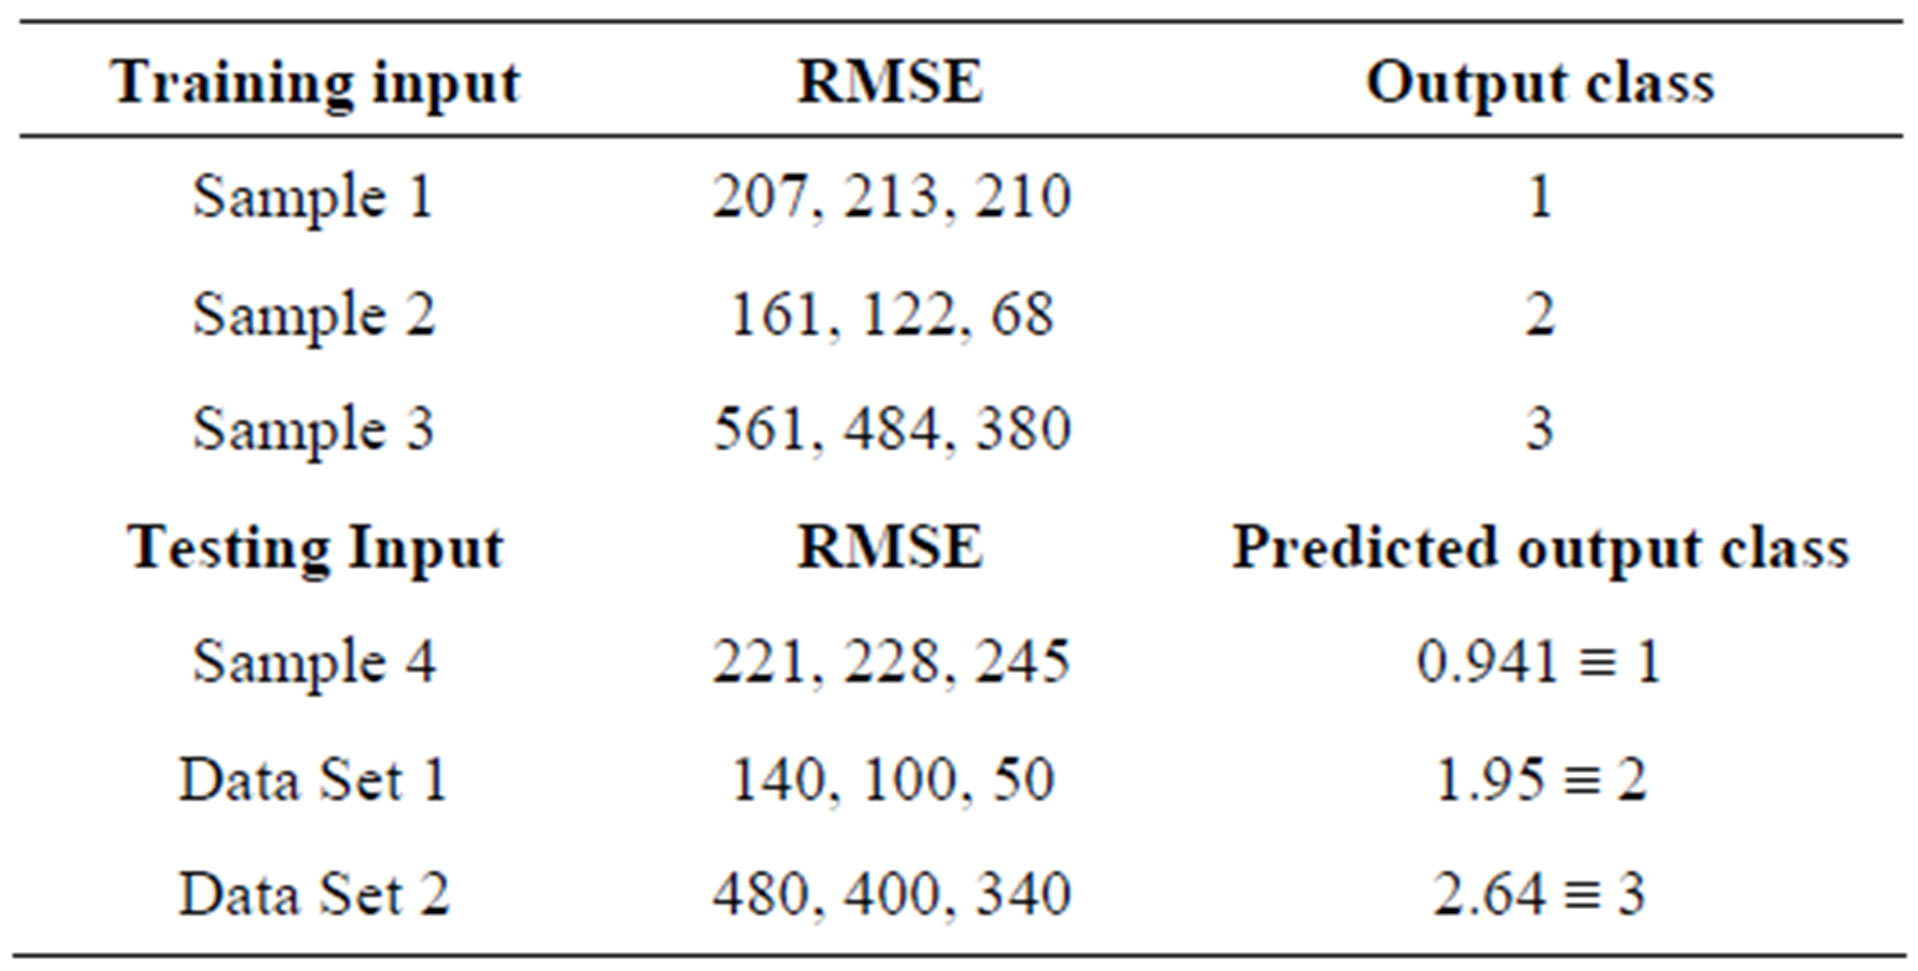
Table 2. Training and testing data for WEA neural model.
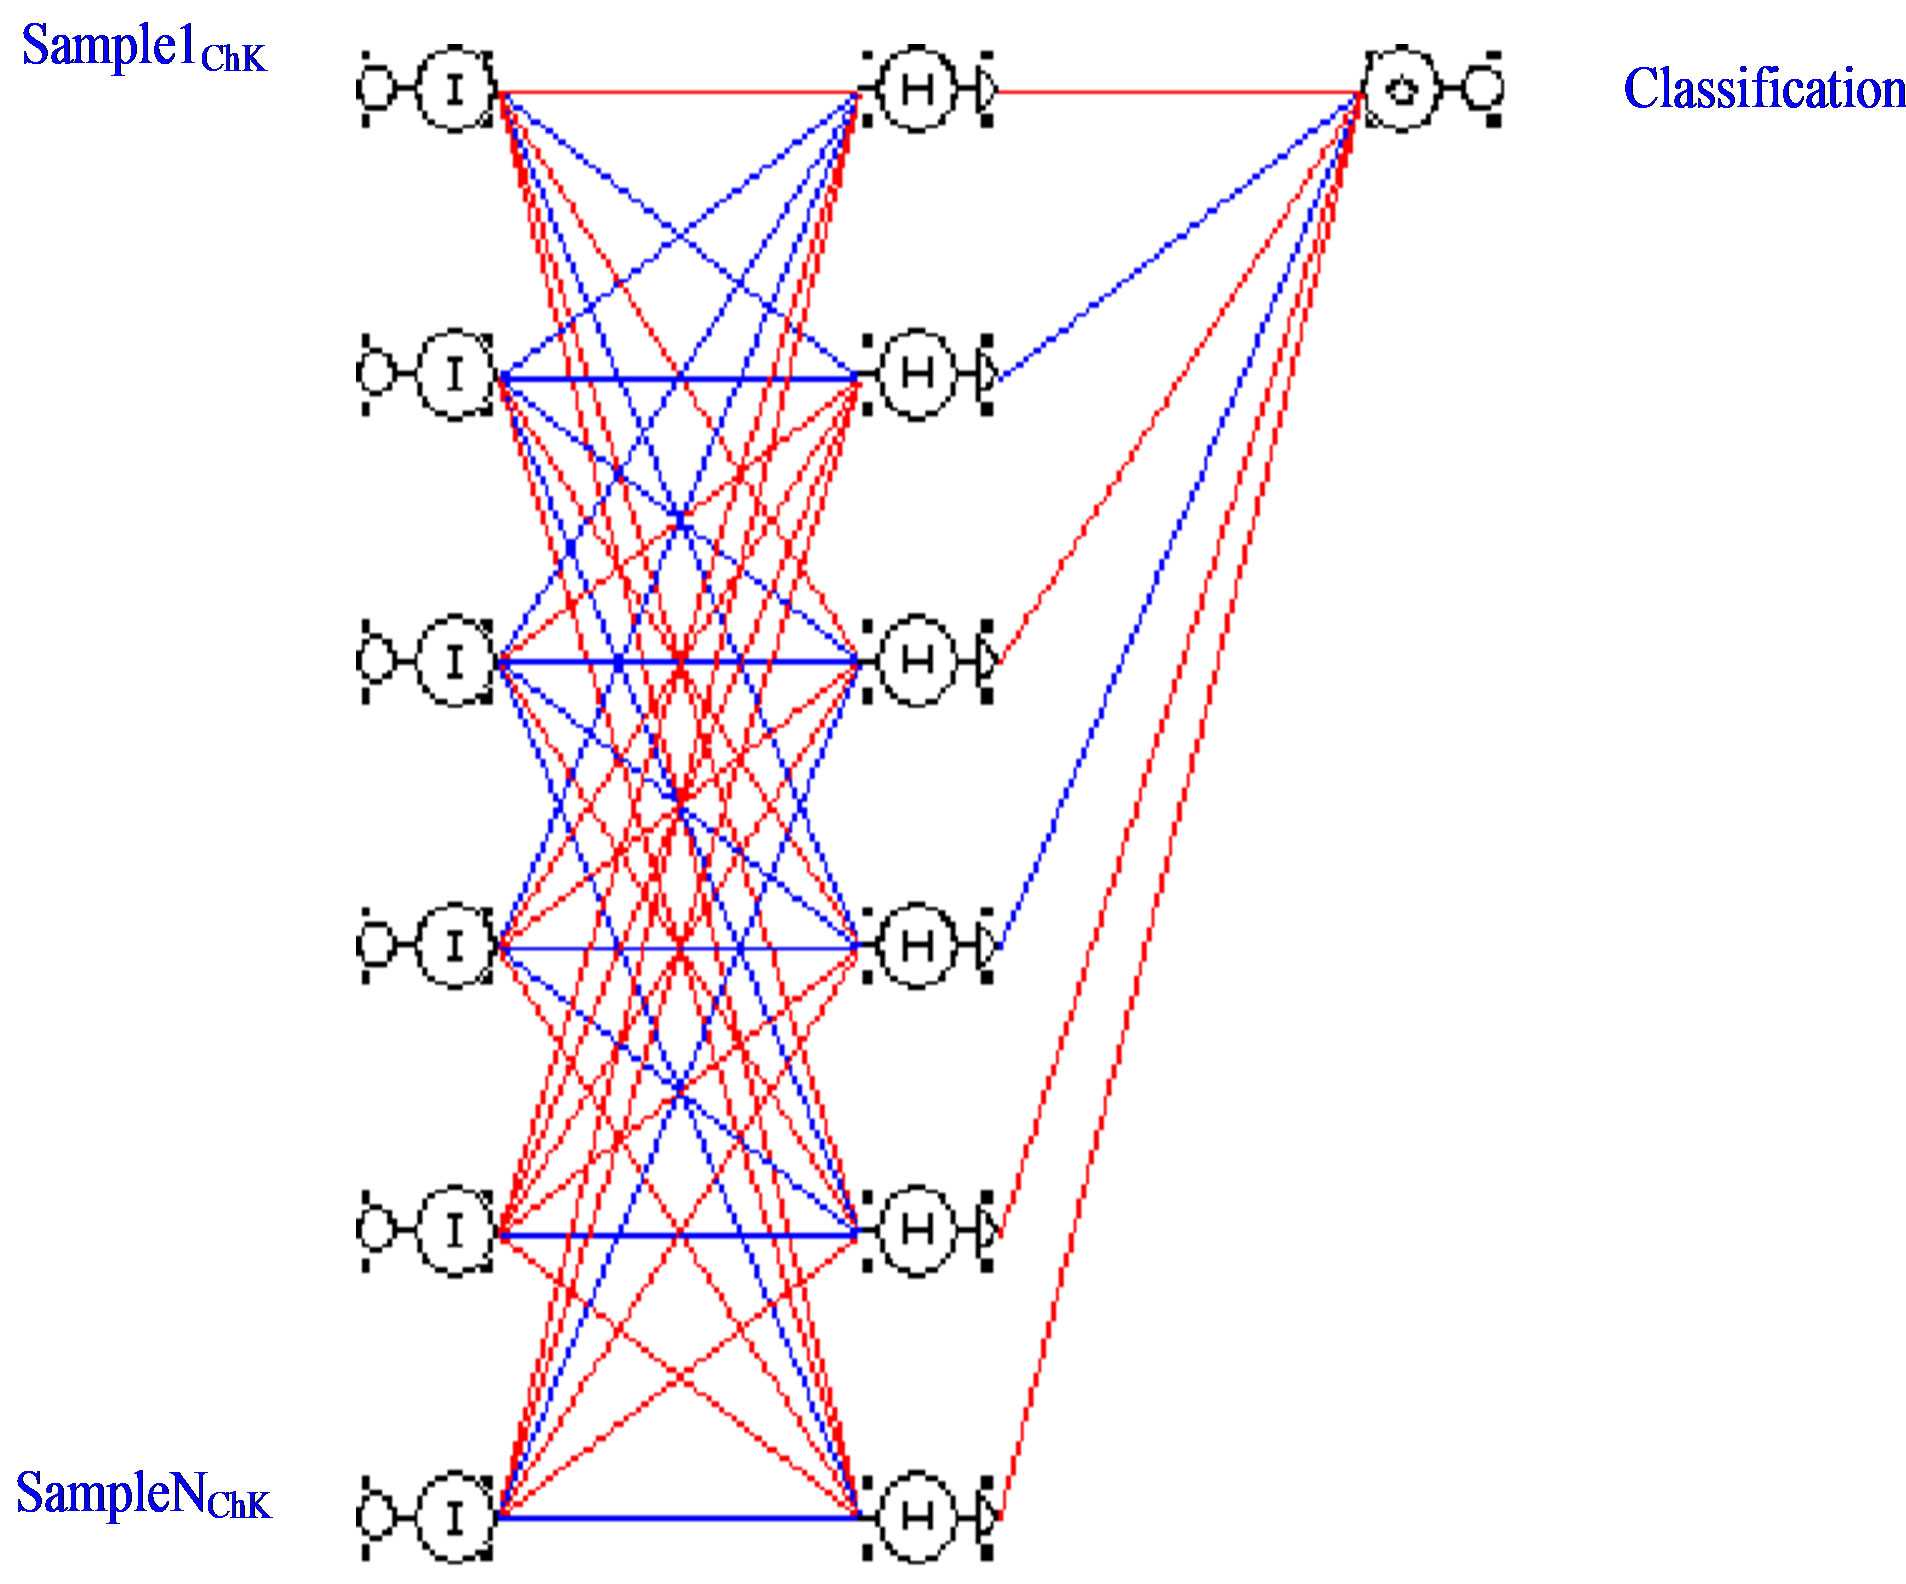
Figure 26. Comprehensive neural network model.
model could be designed which takes into account all hyperspectral bands and more image measuring indices to classify and predict.
Such Neural Network with N-inputs describing characteristic matrices for Samples is shown in Figure 26. In the Figure, K represents number of hyperspectral bands per sample.
6. Conclusion
Using hyperspectral approach to characterize composite components has the very distinct advantage of providing more than one band to enable discrimination and classification. Such availability of data is very essential to judge a component and provides a rich database for an intelligent system such as Neural Networks to enable prediction and future analysis.
The advantage of employing Acc. RMSE is to simplify the designed Neural Network Model and provide faster and easier approach to prediction and classification.
REFERENCES
- S. Holland and J. Renshawb, “Physics-Based Image Enhancement for Infrared Thermography,” NDT & E International, Vol. 43, No. 5, 2011, pp. 1-15.
- C. Spiessberger, A. Dillenz and T. Zweschper, “Active Thermography for Quantitative NDT of CFRP Components,” NDT in Aerospace, Vol. 3, No. 2, 2010, pp. 1-7.
- M. Kutin, S. Ristić, M. Puharić, M. Vilotijević and M. Krmar, “Thermographic Testing Of Epoxy-Glass Composite Tensile Properties,” Contemporary Materials, Vol. II, No. 1, 2011, pp. 88-93. doi:10.5767/anurs.cmat.110201.en.088K
- G. Vijayaraghavan, M. Majumder and K. Ramachandran, “Quantitative Analysis of Delaminations in GRP Pipes Using Thermal NDTE Technique,” Journal of Advanced Research in Mechanical Engineering Vol. 1, No. 1, 2010, pp. 60-68.
- G. Wróbel, Z. Rdzawski, G. Muzia and S. Pawlak, “Quantitative Analysis of the Fibre Content Distribution in CFRP Composites Using Thermal Non-Destructive Testing,” International Scientific Journal, Vol. 41, No. 1, 2010, pp. 28-36.
- J. Casey and J. Kerekes, “Misregistration Impacts on Hyperspectral Target Detection,” Journal of Applied Remote Sensing, Vol. 3, No. 1, 2009, Article ID: 033513.
- A. Picon, O. Gita, P. Whelan and P. Iriondo, “Fuzzy Spectral and Spatial Feature Integration for Classification of Nonferrous Materials in Hyperspectral Data,” IEEE Transactions on Industrial Informatics, Vol. 5, No. 4, 2009, pp. 483-494. doi:10.1109/TII.2009.2031238
- J. Fu, H. Caulfield, D. Wu and W. Tadesse, “Hyperspectral Image Analysis Using Artificial Color,” Journal of Applied Remote Sensing, Vol. 4, No. 1, 2010, Article ID: 043514.
- J. Carven-Jones, M. Cudenov, M. Stapelbroek and E. Dereniak, “Infrared Hyperspectral Imaging Polarimeter Using Birefringent Prisms,” Applied Optics, Vol. 50, No. 8, 2011, pp. 1170-1185. doi:10.1364/AO.50.001170
- A. Weber-Bargioni, A. Schwartzberg, M. Cornaglia, A. Ismatch, J. Urban, Y. Pang, R. Gordon, J. Bokor, M. Salmeron, D. Ogletree, P. Ashby, S. Cabrini and P. Schuck, “Hyperspectral Nanoscale Imaging on Dielectric Substrates with Coaxial Optical Antenna Scan Probes,” Nano Letters, Vol. 11, No. 3, 2011, pp. 1201-1207. doi:10.1021/nl104163m
- A. Abd-Elrahman, R. Pandi-Chhetri and G. Vallad, “Design and Development of a Multi-Purpose Low-Cost Hyperspectral Imaging System,” Remote Sensing, Vol. 3, No. 3, 2011, pp. 570-586.
- F. Kruse, J. Taranik, M. Coolbaugh, J. Michaels, E. Littlefield, W. Calvin and B. Martini, “Effect of Reduced Spatial Resolution on Mineral Mapping Using Imaging Spectrometry—Examples Using Hyperspectral Infrared Imager (HyspIRI)-Simulated Data,” Remote Sensing, Vol. 3, No. 8, 2011, pp. 1584-1602. doi:10.3390/rs3081584
- D. Yudovsky, A. Nouvong, K. Schomacker and L. Pilon, “Assessing Diabetic Foot Ulcer Development Risk with Hyperspectral Tissue Oximetry,” Journal of biomedical Optics, Vol. 16, No. 2, 2011, Article ID: 026009. doi:10.1117/1.3535592
- P. Vines, C. Tan, J. David, R. Attaluri, T. Vandervelde, S. Krishna, W. Jang and M. Hayat, “Versatile Spectral Imaging with an Algorithm-Based Spectrometer Using Highly Tuneable Quantum Dot Infrared Photodetectors,” IEEE Journal of Quantum Electronics, Vol. 47, No. 2, 2011, pp. 190-197. doi:10.1109/JQE.2010.2065216
- A. Plaza, Q. Du, Y. Chang and R. King, “High Performance Computing for Hyperspectral Remote Sensing,” IEEE Journal Of Selected Topics in Applied Earth Observations and Remote Sensing, Vol. 4, No. 3, 2011, pp. 528-544. doi:10.1109/JSTARS.2010.2095495
- M. Chikr El-Mezouar, N. Taleb, K. Kpalma and J. Ronsin, “An IHS Based Fusion for Color Distortion Reduction and Vegetation Enhancement in IKONOS Imagery,” IEEE Transactions on Geoscience and Remote Sensing, Vol. 49, No. 5, 2011, pp. 1590-1602. doi:10.1109/TGRS.2010.2087029
- M. Chikr El-Mezouar, N. Taleb, K. Kpalma and J. Ronsin, “Vegetation Extraction from IKONOS Imagery Using High Spatial Resolution Index,” Journal of Applied Remote Sensing, Vol. 5, No. 1, 2011, Article ID: 053543. doi:10.1117/1.3624518
- X. Li, L. Li and M. He, “A Novel Pan Sharpening Algorithm for WorldView-2 Satellite Images,” International Conference on Industrial and Intelligent Information (ICIII 2012), Vol. 31, Singapore, 17-18 March 2012, pp. 18-23.
- G. Camps-Valls, J. Benediktsson, L. Bruzzone and J. Chanussot, “Introduction to the Issue on Advances in Remote Sensing Image Processing,” IEEE Journal of Selected Topics in Signal Processing, Vol. 5, No. 3, 2011, pp. 365-369. doi:10.1109/JSTSP.2011.2142490
- A. Mahyari and M. Yazdi, “Panchromatic and Multispectral Image Fusion Based on Maximization of Both Spectral and Spatial Similarities,” IEEE Transactions on Geoscience and Remote Sensing, Vol. 49, No. 6, 2011, pp. 1976-1985. doi:10.1109/TGRS.2010.2103944
- M. Iskandarani, “Application of Unified Smart Classification and Modified Weight Elimination Algorithms to Damage Evaluation in Composite Structures,” WSEAS Transactions on Computers, Vol. 9, No. 9, 2010, pp. 1002-1011.
- F. Han, Q. Ling and D. Huang, “Modified Constrained Learning Algorithms Incorporating Additional Functional Constraints into Neural Networks,” Information Sciences, Vol. 178, No. 3, 2008, pp. 907-919. doi:10.1016/j.ins.2007.09.008
- J. Yang, H. J. Qu and L. Zhou, “Research on the Evaluation Methods of Bid of Construction Project Based on Improved BP Neural Network,” WSEAS Transactions on Computers, Vol. 1, No. 9, 2010, pp. 93-102.
- P. Tripathi, “Image Compression Enhancement Using Bipolar Coding with LM Algorithm in Artificial Neural Network,” International Journal of Scientific and Research Publications, Vol. 2, No. 8, 2012, pp. 1-6.
- C. Ramesh and R. Kumar, “Mathematical and Neural Network Models for Prediction of Wear of Mild Steel Coated with Inconel 718—A Comparative Study,” International Journal of Scientific and Research Publications, Vol. 2, No. 7, 2012, pp. 1-8.
- V. Nguyen, J. Starzyk, W. Goh and D. Jachyra, “Member, Neural Network Structure for Spatio-Temporal LongTerm Memory,” IEEE Transactions on Neural Networks and Learning Systems, Vol. 23, No. 6, 2012, pp. 971-983. doi:10.1109/TNNLS.2012.2191419